ANALYSIS
The total economic value of Amazonian deforestation,
1978 – 1993
Mariano Torras *
Department of Economics and Finance,Adelphi Uni6ersity,Garden City,NY 11530, USA
Received 12 July 1999; received in revised form 4 November 1999; accepted 8 November 1999
Abstract
National income accounting has been criticized because of its failure to encompass the notion of sustainability. Several studies address this problem through ‘green’ income accounting — i.e. by adjusting conventionally measured GDP for reduction in a given country’s ‘stock’ of natural resources. These studies generally base value on the unit net price of the resource. Other studies go beyond net price, emphasizing a natural resource’s total economic value (TEV) — that is, its non-marketable as well as its marketable values. This paper combines the green income accounting and TEV approaches and applies the new framework to Brazil in order to assess the foregone economic benefits resulting from Amazonian deforestation. The results lend support to calls for greater policy emphasis on conservation of unique and irreplaceable ecosystems. © 2000 Elsevier Science B.V. All rights reserved.
Keywords:Brazil; Income accounting; Ecosystem valuation; Total economic value
www.elsevier.com/locate/ecolecon
1. Introduction
World Resources Institute (WRI) studies on Indonesia (Repetto et al., 1989) and Costa Rica (Solo´rzano et al., 1991) note that national income, or GDP, is misspecified in the United Nations system of national accounts (SNA), and argue that this misspecification may encourage
eco-nomic growth that is unsustainable. Since the SNA treats ‘man-made’ capital (e.g. machines, factories) as a form of wealth in a nation’s income accounts, these reports contend that it should also do so for natural resources. Yet, although depre-ciation of man-made capital counts against gross income in the national accounts, an analogous adjustment for ‘natural capital’ is absent from the SNA. The WRI reports seek to rectify this incon-sistency by estimating annual losses in the natural resource accounts for their respective countries, and deducting these from gross income.
* Tel.: +1-516-877-4644; fax:+1-516-877-4607. E-mail address:[email protected] (M. Torras)
These studies, like subsequent ones (see, e.g. Bartelmus et al., 1992; Cruz and Repetto, 1992; Margulis, 1992), base the value of the depleted resources on their associated potential revenue streams, assuming the overall ‘stock’ of natural resources to be diminishing over time. In other words, they implicitly embrace ‘development’ of natural areas over conservation. Other studies (e.g. Pearce, 1991; Kramer et al., 1992; Adger et al., 1995; Kumari, 1995), in contrast, take conservation benefits into account in assessing the total eco-nomic value (rather than merely the marketable value) of particular resources. These latter authors, however, do not apply these estimates to the revised income accounting framework discussed above.
This study is a synthesis of the two approaches. Rather than adjusting national income for the ‘natural capital’ loss evaluated, assuming eventual exhaustion of natural resource stocks, it deducts from national income values associated with con-servation benefits — i.e. the sustainable portion of marketable benefits and all non-marketable benefits. Additionally, the study introduces a method with which to adjust calculated value for increased (or decreased) resource scarcity over time. The framework is applied to Brazil, a country that has suffered considerable deforestation in its Amazon basin from 1978 to 1993. I hypothesize that income adjustments based on the Brazilian Amazon’s conservation benefits will, relative to GDP, exceed those based on the ‘development’ benefits estimated in earlier studies.
The remainder of this paper proceeds as follows. The next section reviews in greater detail the original premises of the natural resource account-ing studies. Section 3 discusses total economic value and presents unit value estimates for the Amazon forest. The results are presented in Section 4, showing both the extent of physical deforestation (by state and in aggregate) and the associated damages. Finally, Section 5 presents the conclusion and some parting thoughts.
2. Income and natural resource accounting: some problems
As noted by Repetto et al. (1989), it is difficult
to overstate the political and economic impact of the national income accounts. The GDP growth rate is the primary standard of economic progress for all countries, but especially for lesser-developed countries (LDCs). Yet GDP may represent unsus-tainable income. Not only does pursuit of GDP growth by an LDC offer no protection for its stock of natural resources, such a policy may be in conflict with its conservation.
Income, at a fundamental definitional level, en-compasses sustainability. As noted by Hicks (1946), ‘Income is the maximum value that a person can consume during a time period and still expect to be as well off at the end of the period as at the beginning’. In other words, cash flows that make one worse off over time ought to count as capital consumption, not income. The SNA notes this distinction in the case of ‘man-made’ capital (here-after KM), regarding its consumption as depreciation.
Hicks, of course, does not mention natural resources. Can they also be classified as capital? Although biologists or ethicists, among others, might object, we can certainly think of them as such. Literally, capital means wealth. Insofar as natural resources possess some economic value (an incontestable point), they are a form of capital by definition, despite not being produced, as isKM, by human hand or machine. Hence, sustainable in-come should be defined as the maximum flow that will still allow the aggregate value of KM and ‘natural capital’ (KN) stocks to be preserved.
The WRI studies on Indonesia and Costa Rica calculate the losses associated with the depletion of three types of KN stocks, and deduct these from GDP for a series of years in the 1970s and 1980s.1 For the most part, they base their value estimates on the world market price (minus extraction cost) of the resource in question. Both studies report considerable losses, and the Indonesia study finds growth in ‘green GDP’ for the studied period to
1Specifically, the Indonesia study considered timber,
be significantly less than conventionally measured GDP growth. Given the substantial resource de-pletion suffered by both countries, the findings of these reports support the general claim that GDP growth might, if KN stocks are eventually ex-hausted, be unsustainable.
Without a doubt, these studies make an impor-tant contribution to the environmental and devel-opment economics literature. However, the use of price as a proxy for value is open to question. Under complete markets and perfect competition, such an approach would not be unreasonable. In such a case, we would expect growing scarcity of a particular resource to be signaled by a rising price. Moreover, resource benefits that cannot be capitalized in the market — e.g. the potential social gain associated with a future discovery of a use of a particular plant — would, assuming perfect information, also be reflected in the price of the resource.
But in the real world, price is no safeguard against scarcity. If, for example, a forest is har-vested at an unsustainable rate, more wood prod-ucts are supplied to the world market than under a more prudent regime. The greater supply drives down the market price. Thus, basing the value of resources such as wood on the corre-sponding market price perversely results in artifi-cially low resource values, which may in turn imply less incentive to preserve them for future use.
Additionally, the world market price of a re-source is based on global supply and demand, which reflect the expected value-added of the re-source as a raw material in the production of other commodities. But there are ‘missing mar-kets’ for an abundance of other types of values that cannot be realized in the traditional global market. Due to the admittedly crude means of estimating some of these values, many economists are unwilling to consider them. Yet failing to do so introduces a severe anti-conserva-tion bias into the analysis, as noted by Pearce (1991):
Typically, development benefits can be fairly readily calculated because there are attendant cash flows…Conservation benefits, on the other
hand, are a mix of associated cash flows and ‘non-market’ benefits. Components with associ-ated cash flows are made to appear more ‘real’ than those without such cash flows…[D]ecisions are likely to be biased in favor of the develop-ment option because conservation benefits are not readily calculable…Unless incentives are devised whereby the non-market benefits are ‘internalized’…conservation benefits will auto-matically be downgraded…This ‘asymmetry of values’ imparts a considerable bias in favor of the development option.
Two observations are in order. First, many ‘non-market’ benefits cannot be provided by KM. In other words, it is imprecise to think of KNand
KM as mere substitutes. Widespread belief that human technology will continually develop alter-natives that reduce our dependence on natural resources no doubt contributes to their underpric-ing. The assertion by the WRI reports that sus-tainability requires preservation of total (i.e. man-made plus natural) capital implies that they are substitutable because it allows KN to be ex-hausted as long as the reduction is offset by increases in KM. Since natural resources con-tribute benefits not provided by KM — and vice versa — it is more accurate to regard the two forms of capital as complements. Many commod-ities (e.g. automobiles, furniture) would not be producible without raw materials. If KN and KM were truly substitutes, we would not requireKMin the first place. Most important, no amount or type of KM can fully replace the integrity of ecosystems damaged through excessive exploita-tion of natural resources. Therefore, a more pru-dent approach to sustainability would also require preservation of KN stock.
Of the world’s tropical forests, the Brazilian Amazon may be among the most valuable. Ac-counting for about 45% of Brazil’s area, many believe its vegetation plays an important role in regulating global temperatures. The Amazon is also home to an enormous and still unmeasured biological diversity, accounting for up to a tenth of all the Earth’s plant and animal species. Perhaps not as well known, the region contains about two-thirds of the earth’s surface fresh water (Pearce et al., 1990).
Economic development and deforestation have threatened the Amazon in recent decades, particu-larly following the late 1970s. The remainder of this paper estimates the ‘unit value’ of Amazonian forest, and assesses the overall loss Brazil has suffered from 1978 to 1993 as a result of deforestation.
3. Amazonian total economic value
3.1. The concept
The total economic value (TEV) of a natural resource is the sum of its direct, indirect, option, and existence values (see, among others, Pearce, 1991; Groombridge, 1992). Direct value is related to the direct use of the resource. In the case of tropical forests like the Amazon, this includes, in addition to commercial timber, materials like resins, latex, and dyes, as well as food such as fruit and nuts. Additionally, potential tourism revenues (recreational values) contribute direct use value.2
Indirect use value is associated with benefits that individuals experience indirectly, or as a conse-quence of the primary function of a given resource. For example, the forest’s ability to sequester car-bon from the atmosphere yields positive externali-ties by helping to regulate the global climate. As another example, forests are an effective defense against soil erosion, consequences of which include reduced soil fertility and downstream siltation.
Other indirect services that this study considers are flood control and water regulation.
Option values refer to all use values (both direct and indirect) that can be realized at some point in the future. The definition adopted here is limited to uncertain benefits, i.e. already-ascertained benefits merely postponed for future use (such as in the case of commercial timber) are not considered.3 Two of the best examples of this are future discov-eries of medicinal and agricultural uses for plants, and future findings of new ecological benefits contributed by the forest. This study only consid-ers the former in its estimates, given no reliable estimates of future ecological discoveries.
Finally, existence value is without a doubt the most elusive among the types of value noted. While most agree that it is ‘non-use’ in nature, there are many fundamentally distinct perspec-tives. For example, Madariaga and McConnell (1987) associate with existence value any non-use value, or even some types of use value like ‘vicar-ious consumption’ (e.g. viewing videos or TV programs about tropical wildlife or the forest in general). At the other extreme, Bergstrom and Reiling (1995) limit existence values merely to what the authors refer to as cognitive value, or the value in being able to ‘think about’ the resource. The range of existence value estimates considered in this study reflect this wide difference in perspec-tives.
Although TEV encompasses values that might overlap, the overestimate resulting from aggrega-tion of all value types will in most cases probably not be too severe. This is assuming, of course, that only the sustainable portion of direct benefits is counted, since extracting forest resources at an unsustainable rate leads to the ultimate exhaustion — or at least profound alteration — of the forest.4
3Many (e.g. Pearce, 1991) do not make a distinction
be-tween the two, but some do, such as Groombridge (1992), and Kramer et al. (1992). Groombridge, however, counts both certain and uncertain future benefits in TEV, designating the former option value, and the latter ‘quasi’ option value.
4The ‘sustainable portion’ is the extraction level that would
allow for preservation of the forest stock. This amount is equal to the level of growth, or natural regeneration, of the forest.
2Also important, though not considered in this study, is the
A more serious objection might be that fore-gone benefits from forest conservation (e.g. ranch-ing or farmranch-ing revenues) ought to factor into TEV-adjusted income. While it is true that this ‘opportunity cost’ does not figure in TEV-ad-justed income if the forest is conserved, neither do the forest conservation benefits. Only when the Amazon is deforested do the lost conservation benefits appear as ‘negative income’, and in such a case there is no associated opportunity cost, since there are presumed economic revenues associated with deforestation. Thus, TEV-adjusted income is consistent in its treatment of costs and benefits. In contrast, conventionally-measured income is clearly inconsistent under the deforestation op-tion, since ranching or farming revenues count while foregone conservation benefits do not.
This study estimates the TEV for a representa-tive hectare of area of Amazonian forest, and assesses the economic loss, in relation to total income, attributable to deforestation in the period spanning 1978 and 1993. These losses are de-ducted from Brazilian gross income, and growth rates for the revised income measure are com-pared to those for per capita GDP.
3.2. Data
Most of the numbers employed in the calcula-tions are drawn from other studies. In addition to listing the sources for these estimates, Table 1 presents a few details on the methodology for each. Two caveats are worth mentioning. First, many of the cited studies do not pertain to the Amazon nor, for that matter, to Brazil. They are, nevertheless, employed, absent an adequate selec-tion of corresponding Brazilian case studies. Sec-ond, calculating a general per-hectare value for the Brazilian Amazon implies that the Amazon’s vast expanse is of uniform ‘quality’. Again, this simplifying assumption is made necessary by the limited available data.
The sustainable Amazonian timber harvest is based on an annual natural regeneration rate of 0.51 m3
/ha.5 The timber net price ($708, 1993
prices) is a per-ton rather than per-cubic meter measure, so the product of the growth increment and the timber net price is multiplied by 0.85, the ratio of conversion between tons and cubic meters of timber, yielding the $307 ha/yr estimate. Both the regeneration figures and the conversion ratio are from Seroˆa da Motta and May (1992).
The replacement method is used to assess the value of nutrient losses resulting from soil ero-sion. Information on per-hectare tonnage losses, nutrient-fertilizer conversion ratios, and fertilizer prices are from Solo´rzano et al. (1991), Bastos Filho (1995), and Cavalcanti (1995). Data on the soil attributes for different Amazonian regions are from the Brazilian Institute of Geography and Statistics (IBGE, 1994). The estimated ‘on-site’ soil erosion cost in the Amazon is $68 ha/yr. In the absence of information on the ‘off-site’ (or downstream) costs, they are approximated here by extrapolating an on-site to off-site cost ratio from three other studies (Cruz et al., 1988; Dixon and Hodgson, 1988; Chopra, 1993), and applying it to Brazil.6 The ratio, 2:5, yields an estimate of $170 ha/yr that the Amazon contributes in off-site ero-sion control services. Thus, the value of the com-bined on-site and off-site services is $238 ha/yr.
For the remaining benefit categories, the calcu-lated annual per-hectare value is simply the mean of the estimates from the corresponding studies. Only one study was cited for the flood control estimate, as well as for the one for water regulation.
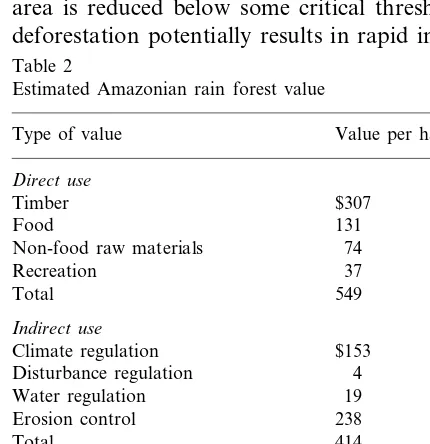
The annual TEV for a representative hectare of Amazon rain forest is summarized in Table 2. Total direct value is $549 (1993 prices), and indi-rect value equals $414 ha/yr.7Together, these two types of value account for over four-fifths of the Amazon’s TEV. At $307, sustainable timber ac-counts for well over half of the direct value subto-tal of $549. Foodstuffs contribute $131, and other
6Although crude, this method is certainly superior to
as-suming zero downstream effects.
7In truth, there is no consistent base year, given the
exten-sive number of studies that were consulted. Nevertheless, since the resource values are often rough estimates anyway, it is acceptable to simplify by ascribing all the estimates to 1993, the final year surveyed.
5The 0.51 figure is the weighted average (by area) of the
Table 1
Survey of tropical forest values
Value Source
Forest service Comments
($/ha per year)
Sustainable tim- 307 Author’s calcu- Based on Seroˆa da Motta and May, 1992 (see text). lations
ber
Food (fruits, 400 Peters et al. Study on the Mishana region of the Peruvian Amazon. Authors com-(1989) pile data on the average number of trees per hectare of each relevant nuts)
species, the annual fruit production for each type of tree, and the net price for each type of fruit.
Grimes et al.
46 Study coverage was the Ecuadorian Amazon. Only accounted for a (1994) subset of available food, as non-food raw materials and medicinal
benefits were also surveyed. Anderson et al.
59 Limited to value estimates for the babassu palm tree in the Brazilian Amazon.
(1991)
20 Pinedo-Vasques Authors surveyed the San Rafael reserve in Peru which, by their et al. (1992) admission, is much less biologically diverse than others, such as the
Mishana area surveyed by Peters et al. (1989). 22 Peters et al.
Other raw mate- Mishana, Peruvian Amazon. Only latex considered among non-food (1989)
rials items.
61 Grimes et al. Ecuadorian Amazon. Calculated value based entirely on forest supply of Protium, a ceramic resin.
(1994) Godoy et al.
116 Case study on the different uses of the Mexican te’lom forest groves. (1993) Authors base their estimate on an earlier study, but deduct projected
timber and coffee revenues.
Chopra (1993) Based on the Indian forest’s annual per-hectare output of fodder and 98
products such as sal leaves, tassan cocoons, bidi leaves, lacquer, and dyes. Reported value is mean of minimum ($89) and maximum ($107) values estimated by Chopra.
Recreation 50 Tobias and Travel cost method employed in the Monteverde Cloud Forest Re-serve (MCFR), Costa Rica. Calculated NPV (domestic and interna-Mendelsohn
tional) is $12.5 million. Factoring in MCFR’s 10 000 ha, and the (1991)
authors’ 4% discount rate (to convert NPV to annual flow) the per-hectare figure is $50.
Ruitenbeek
5 Study of the Korup National Park, Cameroon. Analytical criteria and (1992) shadow prices based on author’s discussions with government
plan-ners, though no further details are provided.
Edwards (1991) Author employs hedonic analysis to estimate a demand function for 55
vacations to the Galapagos islands, Ecuador. Calculated annual rev-enue is $39.7 million which, given the 720 000 ha in the 45 islands, translates to $55 per ha/yr.
100
Climate regula- Brown and Estimate based on projected average carbon sequestration rate per hectare of virgin tropical forest, and estimate of what percentage (2/3,
tion Pearce (1994)
per the authors) is released into the atmosphere when the area is deforested. Damage per ton estimate, $10, is extrapolated from other studies. Based on study of a variety of the world’s tropical forests. Fearnside (1997) Study on the Brazilian Amazon. Author provides a range of damage 70
estimates (from $1.80 to $66 per ton), based on other global warming studies. I employ his ‘medium’ estimate of $7.30 per ton in arriving at the estimate here.
Krutilla (1991) Survey of Malaysian tropical forest. Author bases estimates on costs 336
Table 1 (Continued)
Value Source Comments
Forest service
($/ha per year)
Pearce (1991) Estimates per-hectare deforestation-induced carbon release in Brazil to 59
be 90.8 tons. Discount rate of 5% assumed.
200 Pearce and Range of estimates provided, from low of $80 per ha/yr to high of $320. The mean ($200) is used in this study.
Moran (1994) Ruitenbeek
4 Study of Korup National Park, Cameroon. Value of lost flood control Flood control
(1992) benefits assumed to be a function of size of population affected, defor-estation in relation to remaining area, per capita income of affected population, and flood frequency.
Fearnside (1997) Study on the Brazilian Amazon. Author attributes economic loss to the Water regulation 19
loss of the water regulation function of the trees. Again, three estimates are given (low, medium, and high), the medium estimate being used in this study.
238
Erosion control Author’s calcula- Nutrient loss estimates based on the work of Bastos Filho (1995), Cav-alcanti (1995), and Solo´rzano et al. (1991), and data from the IBGE tions
(1994). Off-site (or downstream) effects based on the work of Chopra (1993), Dixon and Hodgson (1988), and Cruz et al. (1988). Value of downstream costs for Brazil extrapolated from these studies.
Adger et al. Mexico case study. Authors calculate the expected future benefit from 32
Option benefits
(1995) estimates of the number of plant species in the forest, the probability of a given species being useful, the royalty rate for the host country, the ‘likely’ value if product is internationally traded, and the area of the forest.
Pearce and
11 Worldwide survey of tropical forests. Same formula used as by Adger et al. (1995).
Moran (1994)
17 Mendelsohn Same approach as in Adger et al. (1995), and Pearce and Moran (1994). Study of several tropical forest areas.
(1997)
Fearnside (1997) Value of biodiversity maintenance in the Brazilian Amazon assumed to 20
be $10 per ha/yr (low estimate), $20 (medium), or $30 (high). Approxi-mations based on a possible range of annual payments international agencies could pay lesser-developed countries to preserve their tropical forests (from the work of Cartwright, 1985).
9 Grimes et al. Estimate of the annual per-hectare flow associated with three medicinal tree barks found in the Ecuadorian Amazon.
(1994)
Existence benefits 3 Kramer and Authors distribute questionnaires to US citizens, asking them how much they would be willing to pay to preserve an additional five per-Mercer (1997)
cent of all the world’s tropical forests. Two methods, payment card and referendum, used.
238 Echeverrı´a et al. Contingent valuation study on the Monteverde Cloud Forest Reserve (1995) (MCFR), Costa Rica. Both Costa Rican and non-Costa Rican visitors
are surveyed. Ruitenbeek
8 Considers estimates for six areas: the Beni Reserve in Bolivia, Amazo-nian Parks in Ecuador, St. Paul Park in the Philippines, Santa Rosa (1992)
Park and Monteverde Cloud Forest, both in Costa Rica, and Oban Park in Nigeria.
Adger et al.
5 Existence value inferred from the revealed value for a sample of trans-actions related to forest conservation in Mexico, such as contributions (1995)
to conservation organizations, a tourism survey, and debt for nature swaps.
Pearce (1991)
18 Author extrapolates Amazon value from US studies, providing a ha/yr existence value range from $10–26.
raw materials, $74. Recreation generates $37 ha/yr. The protection the Amazon provides against soil erosion is, at $238, the most valuable of the calculated indirect benefits. Also significant is cli-mate regulation, at $153. Water regulation con-tributes $19, and flood control a mere $4. Finally, existence benefits contribute $194 ha/yr, and option value only $18. The standard deviation for exis-tence benefits is enormous ($354), however, sug-gesting that the $194 value estimate is of questionable reliability. The TEV per ha/yr is $1175.
3.3. Scarcity adjustment
The $1,175 ha/yr figure is the estimated TEV for the year 1993. It is reasonable to expect the real value per ha/yr to have been lower in 1978, when there existed more forest area — that is, when tropical forest ‘scarcity’ was lower. Adjustments for the latter as well as intervening years are therefore required.
If, as seems probable, the Amazonian ecosystem is subject to non-linearities — i.e. sudden dramatic increases in the magnitude of damage once forest area is reduced below some critical threshold — deforestation potentially results in rapid increases
Fig. 1. Relationship between remaining area and Amazon unit value. (a) Discontinuous relationship (b) Rectangular hyper-bolic relationship.
Table 2
Estimated Amazonian rain forest value
Type of value Value per ha/year Direct use
Timber $307
Food 131
74 Non-food raw materials
37 Recreation
549 Total
Indirect use
$153 Climate regulation
4 Disturbance regulation
Water regulation 19
Erosion control 238
Total 414
Option
Unknown future medicinal benefits 18 $981 Total use benefits
Existence benefits 194
Grand total $1175
in marginal unit conservation value (see Fig. 1a).8 But given both inadequate means of estimating the relevant threshold values — the magnitude ($) of the ‘jump’ as well as at what point it occurs — and the fact that such a critical point, if it exists, does not yet appear to have been reached, we need more conservative assumptions. Lacking a more reliable method of assessment, I assume a rectangular hyperbolic demand function for the forest resource (Fig. 1b). In addition to ensuring that the forest unit values are not overestimated (no threshold effects), the advantage to such an approach is in its simplicity. Annual unit TEV varies depending on remaining forest stock, with product of unit TEV and total area remaining constant. Adjusted in this
way, real TEV ha/yr (in 1993 $) does not vary substantially, rising from $1088 ha/yr in 1978 to $1175 in 1993.9
3.4. Discounting
Finally, proper assessment of deforestation loss requires calculation of net present values (NPVs). A lost hectare of forest signifies not only dissipation of the annual per-hectare flow of benefits, but of all future flows, discounted in perpetuity. One might, at first glance, contend that discount rates do not apply to conservation benefits. After all, if a hectare of standing forest is protected, the value of its benefits cannot, generally speaking, be ‘cashed in’ and invested in physical capital. The fallacy in such thinking is that the discount rate can be seen as representative not only of the opportunity cost of capital, but also of the social rate of time prefer-ence. Since future benefit flows provide value to society, they should be aggregated in the valuation of the Amazon’s conservation benefits. Discount-ing is necessary insofar as the social value of future benefits is less than that of present benefits.
Since the Amazonian ecosystem is both unique and irreplaceable, there are grounds for favoring a relatively low discount rate. While suitable for evaluating resource extraction projects, a discount rate on the order of 10% is arguably too high for our purposes. A rate in the 1 – 2% range, on the other hand, while perhaps appropriate for some critical or rare resources, arguably represents un-due prudence in the present context. An intermedi-ate discount rintermedi-ate of 5% is generally considered to be a reasonable approximation of the social rate of time preference, particularly with issues relating to natural resource depletion (see, e.g. Pearce et al., 1990). It is therefore the rate of choice in the present study.
4. Total economic loss from Amazonian deforestation
The deforestation estimates in this study are based on data from Brazil’s National Institute for
Table 3
Annual Amazonian deforestation (areas in ‘000 ha) Year Area deforested Area remaining
1978 1302 393 542
392 414
1988 2198 372 304
1564 369 948
1989
1990 1393 368 383
366 991
1991 1360
1418 365 631
1992
1993 1555 364 212
Spatial Research (INPE, 1995, 1997), Seroˆa da Motta and May (1992), and Moran et al. (1994). As seen in Table 3, annual Amazonian deforestation accelerated from the late 1970s to the mid 1980s, more than doubling from 1978 to 1986. Starting in 1987, however, the annual amount deforested be-gan to recede, and by 1991 almost returned to the 1978 level. The annual area deforested picked up anew after 1991, although in 1993 it was still significantly less than it had been in the mid-1980s. By 1993, the total Amazonian expanse had been reduced by 7.5% from the 1978 level.
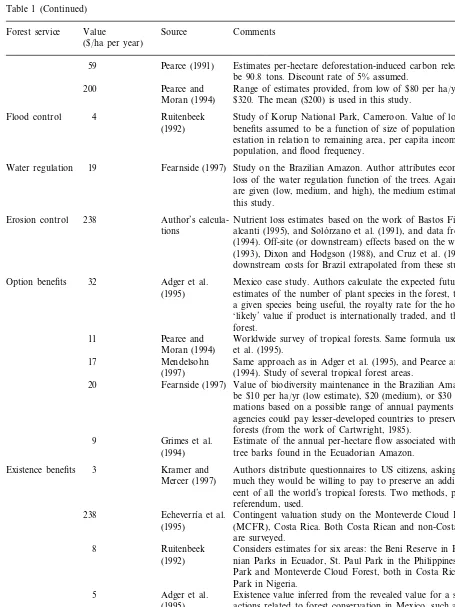
The percentage reduction varies considerably by state (Table 4).10
Not surprisingly, the most remote
Table 4
Area deforested, 1978–1993, % change from base year
State Area deforested (%)
Acre 6.2
9Although, as is shown, the 1993 figure varies according to
Amazonian state. Details on calculations for the intervening years are found in Appendices A – C.
10See Appendices A and B for the data on which these
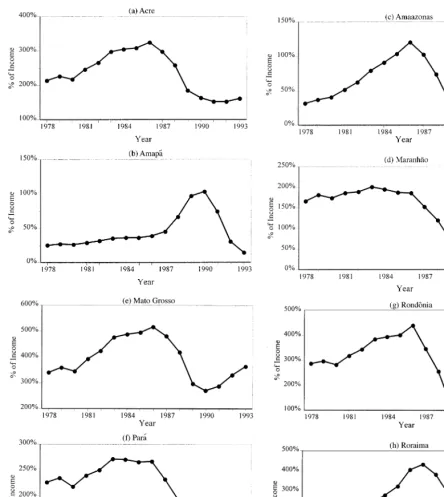
states (Acre, Amapa´, Amazonas, Para´, and Ro-raima) have suffered the least deforestation in relation to remaining forest area. States to the east (Maranha˜o) and south (Rondoˆnia, Mato Grosso, and Tocatins) have been more adversely affected, no doubt due to their easier accessibility from the more densely populated and developed states along the Atlantic coast.
The scarcity adjustment discussed in the previ-ous section is applied to the individual states, rather than to Brazilian Amazonia in its entirety. Doing so permits us to reflect the widely disparate deforestation rates. As we would expect, there is moderate variation in the unit values of forest for each state. For example, the 1993 value of a ha/yr of forest in Maranha˜o, where deforestation has been massive in relation to remaining area, is significantly greater than for, say, Amapa´, which still retains the great majority of its original forest cover.11
Fig. 2 presents the ratio, for each state, of NPV loss from deforestation to income. The latter figures are obtained from the IBGE (1978, 1986, 1994). Notice that, although many exhibit trends consistent with the trend for deforestation in Amazonia as a whole — that is, rising until a peak in the mid-1980s, and declining abruptly thereafter — the economic losses relative to in-come vary considerably. In states such as Mato Grosso and Tocatins, lost NPV from deforesta-tion dwarfs income in each of the years studied. In states like Amapa´ and Amazonas, in contrast, income exceeds lost NPV, at least in most years.
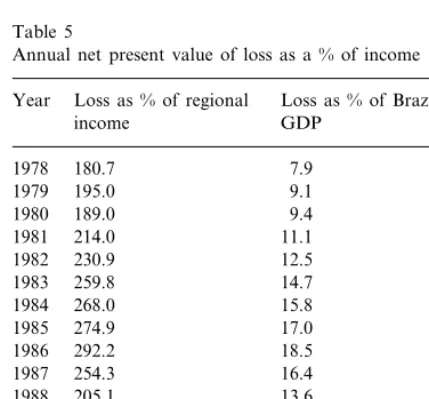
Not surprisingly, NPV loss for Amazonia ex-ceeds joint income for the nine states in every year of the study (Table 5). This result reflects the relatively meager share of Brazilian GDP gar-nered by the Amazonian states — even at its highest, in 1993, only 7.4% — as well as the magnitude of deforestation. The NPV loss in relation to Brazilian GDP is reported in the second column; the losses range from 7.9 to 18.5% on conventionally measured national in-come.
Finally, while per capita GDP grew at a rate of 0.7% per annum from 1978 to 1993, the rate of growth of national income per capita falls to 0.3% if, as in the WRI studies, we incorporate reductions to the Amazonian forest ‘stock’. In-deed, for the sub-period spanning 1978 and 1986, the rate is negative (−0.1%), suggesting that ‘true’ per capita income declined. These re-sults pertain to Brazil as a whole; the story for the individual Amazonian states is doubtless far more dismal. The findings of this study, there-fore, call into question the sustainability of Brazil’s GDP growth, as it is conventionally mea-sured.
5. Conclusion and parting thoughts
While deforestation has, to this point, been largely confined to the more accessible regions of Brazil, in aggregate terms the economic loss it has caused has been enormous. Calculated NPV of the annual loss consistently exceeded income in many Amazonian states, and total loss was substantial even when compared to overall Brazilian GDP. Although the country’s annual per capita GDP growth from 1978 to 1993, at 0.7%, is not awe-inspiring, its performance is even worse (0.3%) if we adjust the income accounts to reflect the KN stock reduction. If we isolate the sub-period from 1978 to 1986 (the peak year in physical magnitude of deforestation), the per capita ‘revised’ income growth rate is
−0.1%.
As expected, taking total economic value into consideration results in estimated natural capital losses considerably greater than those reported in most previous case studies. One such study (Repetto et al., 1989) did report a very high ratio of KNloss to GDP for Indonesia (exceeding 20% for some of the years it surveyed), but this ratio factored in the entire country’s losses. The present study, in contrast, only accounts for losses in the nine Amazonian states. These findings support the claim that growth which entails continued deple-tion of a country’s natural resource base may be unsustainable. In other words, unless modes of economic activity that are less intensive on
Fig. 2. Annual net present value of loss as a percent of income, by state. Brazil’s natural resources become more
wide-spread, continued KN depletion may, because the Amazon’s expanse is finite, eventually act as a brake on conventionally measured income
dis-Fig. 2. (Continued)
Table 5
Annual net present value of loss as a % of income Year Loss as % of regional Loss as % of Brazilian
GDP income
7.9 1978 180.7
9.1 195.0
1979 189.0
1980 9.4
11.1 214.0
1981
12.5 1982 230.9
14.7 259.8
1983
15.8 1984 268.0
17.0 274.9
1985
18.5 1986 292.2
16.4 254.3
1987
13.6 1988 205.1
8.7 128.3
1989 118.0
1990 8.2
8.0 1991 113.2
8.5 117.3
1992 121.0
1993 9.0
Granted, this would make the analysis consider-ably more complex. Not only do other types of terrain require new estimates, we can expect non-Amazonian states, in general, to have far more diverse environments than Amapa´ or Roraima, which are still mostly virgin forest.
Second, the method employed in this study to account for scarcity remains crude. A more accu-rate accounting would reflect potential discontinuities in the demand function for forest amenities. Finally, it was impossible to account for the likely consequences of deforestation stemming from interdependence among distinct indirect environmental services and functions (indeed, even ecologists have yet to under-stand these fully). Exclusion of these potential problems most likely results in an understatement of TEV.
Acknowledgements
Many thanks to James Boyce, Mohan Rao, Tom Stevens and two anonymous referees for comments on an earlier version of this paper. Thanks also to participants in the October 1998 International Atlantic Economic Society meetings in Boston for helpful input. Remaining errors are mine.
place — or reduce the impact of — ranching and farming.
Appendix A. Annual Amazonian deforestation, by state (area in ‘000 ha)
Amapa´ Amazonas Maranha˜o Mato Grosso
Acre Para´
Year Rondoˆnia Roraima Tocatins
2.7 45.6 200.4 248.6
31.0 447.1
1978 86.2 3.9 63.4
38.0
1979 3.4 60.7 231.6 305.1 533.4 110.9 5.6 81.3
3.9 77.4
1980 43.0 239.7 346.0 579.7 134.7 7.7 98.2
4.5 98.7 248.1 392.3
48.8 630.0
1981 163.7 10.7 118.6
55.3
1982 5.1 125.8 256.8 444.8 684.7 198.8 14.9 143.3
62.7
1983 5.9 160.3 265.8 504.3 744.2 241.5 20.6 173.0
6.8 204.4 275.1 571.8
71.0 808.8
1984 293.3 28.6 209.0
1985 80.5 7.8 260.5 284.7 648.4 879.0 356.3 39.7 252.5
8.9 332.1 294.7 735.1
91.2 955.3
1986 432.8 55.0 304.9
86.8
1987 10.7 298.3 245.3 717.2 865.7 366.6 62.5 246.0
75.3
1988 15.7 219.2 187.0 630.3 725.9 278.8 56.4 167.1
23.7 112.7 114.8 472.7
56.4 526.1
1989 149.1 44.6 64.2
1990 48.1 24.2 89.9 104.1 417.8 456.7 161.6 35.0 55.4
17.4 76.5 81.6 453.6
45.0 419.5
1991 188.3 31.9 46.0
7.2 60.6 69.6 527.4 414.7
1992 45.3 226.3 27.8 39.6
3.6 51.3 55.9 617.0 450.5
50.0 260.5
1993 27.5 38.7
Appendix B. Remaining forest area, by state (area in ‘000 ha)
Amapa´ Amazonas
Year Acre Maranha˜o Mato Grosso Para´ Rondoˆnia Roraima Tocatins
12 423
1978 15 015 153 932 9209 49 550 111 176 19 862 16 872 5505
12 420 153 886 9009 49 301
14 984 110 729
1979 19 775 16 868 5441
12 417 153 825 8777 48 996 110 195 19 664 16 863
1980 14 946 5360
12 413 153 748 8537 48 650
14 ,903 109 616
1981 19 530 16 855 5262
1982 14 854 12 409 153 649 8289 48 258 108 986 19 366 16 844 5143
1983 14 799 12 404 153 523 8032 47 813 108 301 19 167 16 829 5000
12 398 153 363 7767 47 308
14 736 107 557
1984 18 926 16 809 4827
12 391 153 159 7492 46 737 106 748
1985 14 665 18 633 16 780 4618
12 383 152 898 7207 46 088
14 585 105 869
1986 18 276 16 741 4366
14 494
1987 12 374 152 566 6912 45 353 104 914 17 844 16 686 4061
14 407
1988 12 363 152 268 6667 44 636 104 048 17 477 16 623 3815
12 348 152 049 6480 44 006
14 331 103 322
1989 17 198 16 567 3648
12 324 151 936 6365
1990 14 275 43 533 102 796 17 049 16 522 3583
12 300 151 846 6261 43 115
14 227 102 339
1991 16 887 16 487 3528
12 282 151 770 6179 42 662 101 920 16 699 16 455 3482
1992 14 182
12 275 151 709 6110 42 134 101 505 16 473 16 427 3442
Appendix C. Per-hectare value for each Amazonian state (1993 US$)a
Year Acre Amapa´ Amazonas Maranha˜o Mato Grosso Para´ Rondoˆnia Roraima Tocatins
1088 1088 1088
1978 1088 1088 1088 1088 1088 1088
1088 1088 1112 1093
1090 1092
1979 1093 1088 1101
1093
1980 1089 1089 1142 1100 1098 1099 1089 1117
1089 1089 1174
1981 1096 1108 1103 1106 1089 1138
1089 1090 1209 1117
1100 1110
1982 1116 1090 1164
1104
1983 1090 1091 1247 1128 1117 1127 1091 1198
1090 1092 1290 1140
1984 1109 1125 1142 1092 1241
1091 1093 1337 1153
1114 1133
1985 1160 1094 1297
1120
1986 1092 1095 1390 1170 1143 1182 1097 1372
1092
1987 1127 1098 1450 1189 1153 1211 1100 1475
1093 1100 1503 1208
1134 1163
1988 1236 1104 1570
1140
1989 1095 1101 1546 1225 1171 1257 1108 1642
1097 1102 1574 1238
1990 1144 1177 1267 1111 1671
1099 1103 1600 1250
1148 1182
1991 1280 1113 1698
1152
1992 1100 1103 1621 1264 1187 1294 1116 1720
1101 1104 1640
1993 1156 1279 1192 1312 1117 1740
aCalculation: to simplify, I assume the $1175 per ha/yr figure is for 1993. The corresponding figure for 1978 is $1088. I obtain
this number by multiplying the area remaining in Amazonia in its entirety in 1993 (36.4 million ha) by $1175, and dividing by the remaining area in 1978 (39.4 million ha). The rationale for this is my assumption of a rectangular hyperbola demand curve for the forest resource. Therefore, unit value times quantity available must always be equal. Thus, with 1978 as the starting point, the above numbers for the states are obtained by multiplying $1088 by the remaining area in 1978 for a given state, and dividing the product by the area remaining in each subsequent year.
References
Adger, W.N., Brown, K., Cervigni, R., Moran, D., 1995. Toward estimating total economic value of forests in Mex-ico. Working Paper 94-21, Centre for Social and Economic Research on the Global Environment, University of East Anglia and University College, London.
Anderson, A.B., May, P.H., Balick, M., 1991. The Subsidy from Nature: Palm Forests, Peasantry, and Development on an Amazon Frontier. Columbia University Press, New York.
Bartelmus, P., Lutz, E., Schweinfest. S., 1992. Integrated Environmental and Economic Accounting: A Case Study for Papua New Guinea. World Bank Environ-ment Working Paper No. 54, World Bank, Washington, DC.
Bastos Filho, G.S., 1995. Contabilizando a Erosa˜o do Solo: Um Ajuste Ambiental Para o Produto Bruto Agropecua´rio Paulista. Dissertac¸a˜o de Mestrado, Universidade de Sa˜o Paulo, Brasil.
Bergstrom, J.C., Reiling, S.D., 1995. Does Existence Value Exist? (unpublished).
Brown, K., Pearce, D.W., 1994. The economic value of non-marketed benefits of tropical forests: carbon storage. In: Weiss, J. (Ed.), The Economics of Project Appraisal and the Environment. Elgar, London, pp. 102 – 123.
Cartwright, J., 1985. The politics of preserving natural areas in Third World states. The Environment 5 (3), 179 – 186. Cavalcanti, J.E., 1995. Valorac¸a˜o Econoˆmica das Perdas de
Solo no Vale do Rio Sa˜o Francisco. Codevasf/FAO, Rela-to´rio Final de Consultoria, Vic¸osa, Minas Gerais. Chopra, K., 1993. The value of non-timber forest products: an
estimation for tropical deciduous forests in India. Econ. Bot. 47 (3), 251 – 257.
Costanza, R., d’Arge, R., de Groot, R., Farber, S., Grasso, M., Hannon, B., Limburg, K., Naeem, S., O’Neill, R.V., Paruelo, J., Raskin, R.G., Sutton, P., van den Belt. M., 1997. The value of the world’s ecosystem services and natural capital. Nature, 15 May, 253 – 260.
Stabilization and Structural Adjustment Programs: The Philippines Case. World Resources Institute, Washington, DC.
Cruz, W., Francisco, H.A., Conway, Z.T., 1988. The on-site and downstream costs of soil erosion in the Magat and Pantabangan watersheds. J. Phil. Dev. 15 (26), 85 – 111. Dixon, J.A., Hodgson, G., 1988. Economic Evaluation of
Coastal Resources: The El Nin˜o Study. Tropical Coastal Area Management (August): 5 – 7.
Echeverrı´a, J., Hanrahan, M., Solo´rzano, R., 1995. Valuation of non-priced amenities provided by the biological re-sources within the Monteverde Cloud Forest Preserve, Costa Rica. Ecol. Econ. 13, 43 – 52Y.
Edwards, S.F., 1991. The demand for Galapagos vacations: estimation and application to wilderness preservation. Coast. Manage. 19, 155 – 169.
Fearnside, P., 1997. Environmental services as a strategy for sustainable development in rural Amazonia. Ecol. Econ. 20 (1), 53 – 70.
Godoy, R., Lubowski, R., Markandya, A., 1993. A method for the economic valuation of non-timber tropical forest products. Econ. Bot. 47 (3), 220 – 233.
Grimes, A., Loomis, S., Jahnige, P., Burnham, M., Onthank, K., Alarco´n, R., Cuenca, W.P., Martinez, C.C., Neill, D., Balick, M., Bennett, B., Mendelsohn, R., 1994. Valuing the rain forest: the economic value of non-timber forest prod-ucts in Ecuador. Ambio 23 (7), 405 – 410.
Groombridge, B., 1992. Global Diversity: Status of the Earth’s Living Resources. Chapman and Hall, London.
Hicks, J.R., 1946. Value and Capital: An Inquiry into Some Fundamental Principles of Economic Theory. Oxford Uni-versity Press, Oxford.
IBGE, 1978. Anua´rio Estatı´stico do Brasil. Ministe´rio do Planejamento e Orc¸amento, Rio de Janeiro.
IBGE, 1986. Anua´rio Estatı´stico do Brasil. Ministe´rio do Planejamento e Orc¸amento, Rio de Janeiro.
IBGE, 1994. Anua´rio Estatı´stico do Brasil. Ministe´rio do Planejamento e Orc¸amento, Rio de Janeiro.
INPE, 1995. Extensa˜o do Desflorestamento na Amazoˆnia Legal. http://www.dpi.inpe.br/amazonia/desflora.html. INPE, 1997. Extensa˜o do Desflorestamento na Amazoˆnia
Legal. http://www.dpi.inpe.br/amazonia/desflora.html. Kramer, R.A., Mercer, D.E., 1997. Valuing a global
environ-mental good: US residents’ willingness to pay to protect tropical rain forests. Land Econ. 73 (2), 196 – 210U. Kramer, R.A., Healy, R., Mendelsohn, R., 1992. Forest
valua-tion. In: Sharma, N.P. (Ed.), Managing the World’s Forests: Looking for Balance between Conservation and Development. Kendall/Hunt Publishing, Iowa, US.
Krutilla, J.V., 1991. Environmental Resource Services of Malaysian Moist Tropical Forest. For Resources for the Future. Johns Hopkins University Press, Baltimore. Kumari, K., 1995. An Environmental and Economic
Assess-ment of Forest ManageAssess-ment Options: A Case Study in Malaysia. Environmental Economics Series 026, The World Bank, Washington, DC.
Madariaga, B., McConnell, K.E., 1987. Exploring existence value. Water Resources Res. 23 (5), 936 – 942.
Margulis, S., 1992. Back-of-the-Envelope Estimates of Envi-ronmental Damage Costs in Mexico. Working Paper Se-ries, c824, World Bank, Washington DC.
Mendelsohn, R., 1997. Notes on economic plants. Econ. Botany 51 (3), 328.
Moran, E., Brondizio, E., Mausel, P., Wu, Y., 1994. Integrat-ing Amazonian vegetation, land-use, and satellite data. Bioscience 44 (5), 329 – 338.
Pearce, D.W., 1991. An economic approach to saving the tropical forests. In: Helm, D. (Ed.), Economic Policy To-wards the Environment. Blackwell, Oxford, pp. 239 – 262. Pearce, D.W., Moran, E., 1994. The Economic Value of
Biodiversity. Earthscan Publications, London.
Pearce, D.W., Barbier, E., Markandya, A., 1990. Sustainable Development: Economics and Environment in the Third World. Elgar, London.
Peters, C.M., Gentry, A.H., Mendelsohn, R.O., 1989. Valua-tion of an Amazonian Rainforest. Nature, 339, 29 June, 655 – 656.
Pinedo-Vasques, M., Zarin, D., Jipp, P., 1992. Economic returns from forest conversion in the Peruvian Amazon. Ecol. Econ. 6, 76 – 78.
Repetto, R., Magrath, W., Wells, M., Beer, C., Rossini, F., 1989. Wasting Assets: Natural Resources in the National Income Accounts. World Resources Institute, Washington, DC.
Ruitenbeek, H.J., 1992. The rainforest supply price: a tool for evaluating rainforest conservation expenditures. Ecol. Econ. 6, 57 – 78.
Seroˆa da Motta, R., May, P., 1992. Loss in Forest Resource Values Due to Agricultural Land Conversion in Brazil. Texto para discussa˜o no 248, Instituto de Pesquisa Eco-noˆmica Aplicada, Rio de Janeiro.
Solo´rzano, R., De Camino, R., Woodward, R., Tosi, J., Watson, V., Va´squez, A., Villalobos, C., Jime´nez, J., 1991. Accounts Overdue: Natural Resource Depreciation in Costa Rica. World Resources Institute, Washington, DC. Tobias, D., Mendelsohn, R., 1991. Valuing ecotourism in a
tropical rain-forest reserve. Ambio 20 (2), 91 – 93.