www.elsevier.nlrlocaterjappgeo
Two-dimensional radiomagnetotelluric investigation of industrial
and domestic waste sites in Germany
B. Tezkan
a,), A. Hordt
¨
a, M. Gobashy
ba
Institut fur Geophysik und Meteorologie, Uni¨ Õersitat zu Koln, Albertus-Magnus-Platz, 50923 Cologne, Germany¨ ¨ b
Cairo UniÕersity, Faculty of Sciences, Department of Geophysics, Cairo, Egypt
Received 25 March 1998; accepted 10 March 1999
Abstract
Radiomagnetotelluric surveys were carried out on two different waste sites in order to map them and to detect the surrounding hosts. One was filled with industrial waste and the other with household refuse. Both had been recultivated.
Ž .
Powerful military and civilian radiostations 10–300 kHz located parallel and perpendicular to the strike direction of both waste sites served as transmitters. Hence, apparent resistivity and phase data were observed for several selected frequencies. Using this field setup, the data were associated to the E- and B-polarisation directions of the magnetotelluric field. The lateral borders of both waste sites are located accurately in the field. They are characterized by strongly decreasing apparent resistivities observed at nearly all frequencies at the border between the waste site and the undisturbed geology. The data were quantitatively interpreted by conductivity models using a 2D inversion algorithm. The derived 2D conductivity models give information about the vertical extent of the studied waste sites and about the structure of the surrounding hosts.q2000
Elsevier Science B.V. All rights reserved.
Keywords: Waste sites; Radiomagnetotellurics; 2D inversion; Conductivity models
1. Introduction
In Europe, especially in Germany, the appli-cation of geophysical methods to waste site exploration becomes increasingly important since their contribution to the pollution risk estimation has been recognized. In Germany, for example, the number of registered waste
)Corresponding author. E-mail:
sites amounted to 93,723 in December 1993
ŽFranzius, 1994 ; among them 350 in the city of.
Cologne. These numerous waste sites are
tradi-Ž
tionally explored by geotechnical methods e.g.,
.
drillings . Applied geophysics can offer many non-invasive techniques for mapping and should be considered as a main source of information for selecting borehole locations. In general, waste sites are characterized by their low resis-tivities compared to the surrounding hosts, be-cause industrial waste and household refuse cause an increase of electrical conductivity due
0926-9851r00r$ - see front matterq2000 Elsevier Science B.V. All rights reserved. Ž .
Ž .
totelluric method RMT is extensively used in
Ž
connection with waste site exploration Dautel, 1996; Tezkan et al., 1996; Zacher et al., 1996a;
.
Tezkan et al., 1997 . The RMT method allows both sounding and mapping by using several frequencies. The data collection is relatively fast and is interpreted quantitatively by using well-known magnetotelluric modeling programs. Several RMT surveys have also been conducted successfully for hydrogeological investigations, for engineering and for archeological
explo-Ž
rations Turberg, 1991; Hollier-Larousse et al., 1994; Dupis and Choquier, 1996; Zacher et al.,
.
1996b .
Two selected RMT field surveys are pre-sented in this paper to demonstrate the effi-ciency and suitability of the method for waste site exploration of different types. The 2D in-version of the RMT data will be discussed in detail.
The waste site of Volkswagen in Mellendorf was chosen as a representative example for an industrial deposit for the RMT evaluation. A small number of boreholes give information about the vertical extent of this waste site. No geophysical techniques were applied for the ex-ploration of this site previous to the detailed RMT measurements. For comparison, the waste deposit Hermsdorf filled with household refuse was studied exclusively by geophysical methods without any boreholes. Magnetic, DC, EM 31 measurements were carried out to map the de-posit. The RMT measurements should enable a detailed conductivity depth information of this area by applying 2D inversion algorithm to the observed data.
No geographic and topographic maps of both waste sites will be shown for confidential
rea-of waste sites and the resolutions rea-of the 2D inversion models are emphasized.
2. Basic concepts of the RMT technique
The RMT technique uses as transmitters mili-tary and civilian radiostations broadcasting in a frequency range between 10 kHz and 1 MHz. In Fig. 1a, the principle of this method is demon-strated schematically. The electromagnetic waves radiated from these transmitters diffuse into the conductive earth and induce electrical current systems which are connected with elec-trical and magnetic alternating fields. The mag-netic field can be measured for selected fre-quencies by a coil and the electric field by two grounded electrodes. Fig. 1b shows the RMT-instrument, a prototype developed in
Switzer-Ž .
land Muller, 1983 . The magnetic coil has a
¨
diameter of 0.4 m and the distance between the electrodes can be chosen to be 1 or 5 m. The frequency range of this instrument is limited to 10–300 kHz but can be extended to 1 MHz after hardware modifications in the future. No transmitters are available below 10 kHz. De-pending on the conductivity of the subsurface this limitation might cause the near surface and the deep layers to be unresolved by this method. This will be discussed in Section 4 by the 2D modeling results of the observed data.
The measuring device only weighs 7 kg and about 3 min are required for measuring four frequencies at one station. Thus, large areas can be mapped quickly.
For the selected frequencies apparent resistiv-ity and phase data are derived from the
mea-Ž .
Fig. 1. a Schematic diagram for illustrating a RMT field set up over a hazardous waste site. A sounding information can be
Ž .
obtained by using transmitters with different frequencies from the same direction. b RMT instrument used in the field: a
Ž .
ŽCagniard, 1953.
where E and H denote the electric and mag-x y
netic field, m0the permeability of the free space and f the selected frequency.
Displacement currents can be neglected for the RMT frequencies under normal conditions in Europe. The plane wave assumption is valid when receiver locations are located at least seven skin depths away from the radio transmitters
ŽSchroder, 1994 . In this case, the well devel-
¨
.oped and tested magnetotelluric interpretation software can be directly applied to the RMT data. The main difference between the RMT and the VLF-R technique lies in the extension
Ž .
of VLF frequencies 10–30 kHz to higher
fre-Ž .
quencies Tezkan et al., 1996 . Due to the very limited frequency range, VLF-R is only used for profiling and the interpretation of this data is
Ž .
carried out visually Berktold et al., 1992 . In some cases, however, VLF data can be inter-preted in terms of 1D and 2D conductivity
Ž .
models Beamish, 1998 . The RMT technique enables a sounding which can be interpreted quantitatively. One important aspect is the se-lection of transmitters by considering the strike direction of the waste site. Radio transmitters located parallel and perpendicular to the general strike direction given by geological or anthropo-logical structures can be selected for the given frequency range. Assuming a two-dimensional conductivity structure, this data is associated to
Ž
the E- and B-polarisation directions e.g., Zx y
Ž
ing 2D inversion techniques Smith and Booker,
.
1991; Mackie et al., 1997 . Scalar measure-ments can only be carried out by the RMT system used in this study. The apparent resistiv-ity and phase values associated to Zx x and Zy y
elements of the magnetotelluric impedance ten-sor are not measured in the field. If no informa-tion about the strike direcinforma-tion is available the same field procedure is used by choosing trans-mitters with similar frequencies from NS and EW directions and the obtained data is also interpreted by 2D inversion procedures whereas 3D effects are not considered.
3. Selected RMT surveys for the exploration of different waste site types
In the following, two selected RMT surveys for waste site exploration in Germany will be discussed. An industrial waste site and a very
Ž
common type of a waste site embedded with
.
household refuse and building debris are cho-sen as an example.
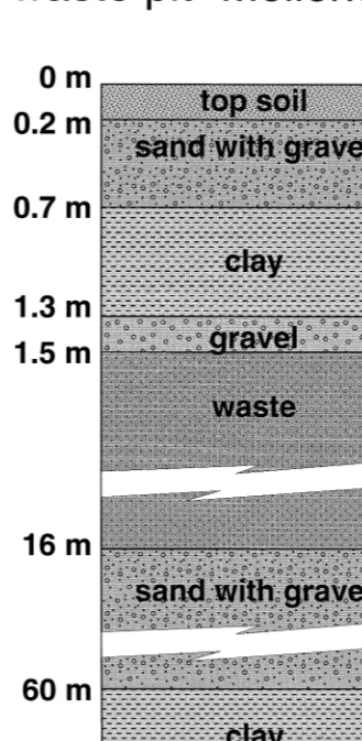
3.1. The Mellendorf industrial waste site
Fig. 2. The structure at the industrial waste site in Mellen-dorf derived from borehole results.
Ž .
site Renno and Christofzik, 1987 . The top and the bottom of the waste site is expected at 1.6 and 16 m depth, respectively. During the recul-tivation the waste site was covered by a layer containing soil, sand with gravel, clay and
grav-Ž .
els Fig. 2 .
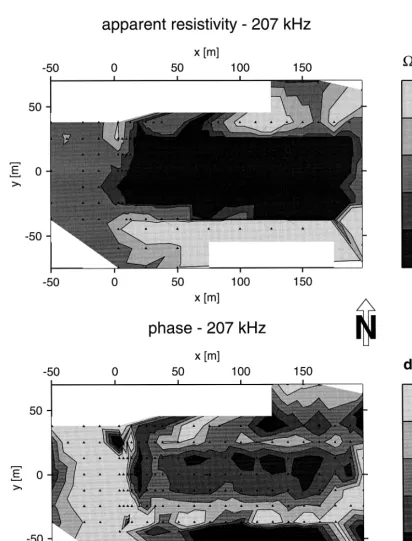
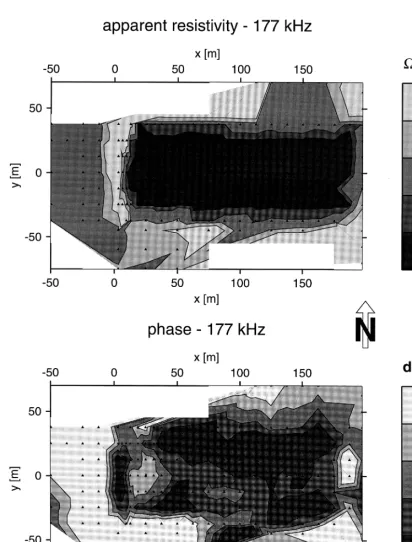
For the RMT survey four frequency pairs between 16 and 200 kHz from radiostations in North–South and East–West directions were chosen. The profile direction was East–West which was perpendicular to the assumed strike direction of the waste site. The distances
be-tween the profiles and the RMT stations were 12.5 m, except at the border between the waste site and the undisturbed geology, where the distance was 5 m.
Figs. 3 and 4 give an overview of the lateral distribution of the apparent resistivities and phases for 207 and 177 kHz. The triangles on the figures denote the locations of the RMT stations. The 207 kHz data belong to the trans-mitter located in North–South direction. In this case, the measured electric field associated with the E-polarization is oriented in NS direction. The electric field of the 177 kHz data is ori-ented in the direction of the profile and repre-sents the B-polarization. The waste site as a well conducting anomaly in comparison to the surrounding host is characterized by apparent resistivity values -30 Vm for both
polariza-Ž
tion directions e.g., 207 and 177 kHz apparent
.
resistivity data and all lateral boundaries of the waste site are clearly detected. A clear phase
Ž . Ž
difference outside Ff508 and inside Ff
.
358 the waste site is also observed.
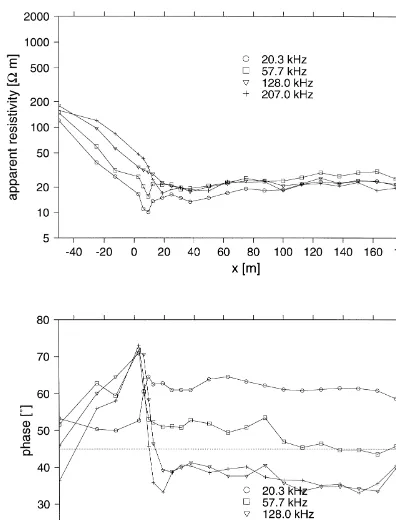
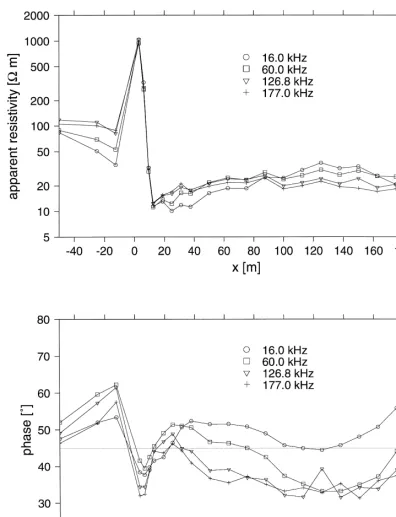
Figs. 5 and 6 show the apparent resistivity and phase data for all observed frequencies from NS and EW transmitters for the profile
Ž .
ys0 Figs. 3 and 4 as a representative exam-ple. The boundaries of the waste site are charac-terized for both transmitter locations by strongly decreasing apparent resistivity values at profile position 5 m and by increasing apparent resistiv-ity at profile position 190 m for all frequencies.
Ž
The difference between E-polarization
NS-. Ž
transmitters and B-polarization
EW-trans-.
Ž .
Fig. 5. Observed apparent resistivities and phases in Mellendorf on the profile ys0 NS transmitters for four frequencies.
frequency to 358 for the highest observed
fre-Ž .
quency Fig. 5 . Information about the structure
Ž .
Fig. 6. Observed apparent resistivities and phases in Mellendorf on the profile ys0 EW transmitters for four frequencies.
has also been studied and confirmed by Ziebell
Ž1997. in his 2D model calculations for the
EW direction by means of 2D model calcula-tions will be shown in Section 4.
A sand pit of approximately 10 m depth was
Ž
used as a waste site in Hermsdorf Thuringen
¨
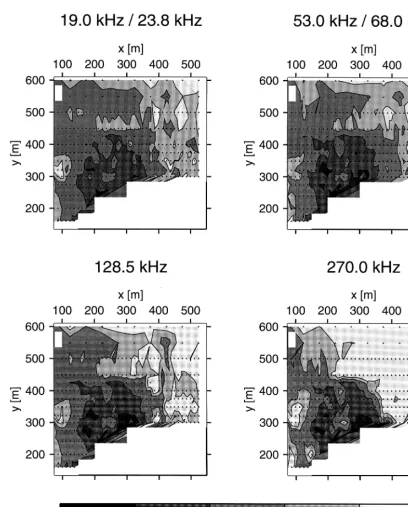
rFig. 7. Spatial distribution of apparent resistivities in Hermsdorf as derived from the transmitters in NWrSE direction
.
Germany until 1979. Household refuse and in-dustrial wastes from a ceramic factory were deposited in this waste site. It was recultivated
and approximately a 1 m thick soil layer was placed above the waste. The surrounding host consists of bunter sandstone. No boreholes exist
Ž .
waste disposal site at Hermsdorf which included total and vertical magnetic gradient
measure-Ž
ments, geoelectric mapping and soundings
Lin-. Ž
dner et al., 1993 , self potential Pretzschner et
. Ž
al., 1993 and refraction seismics Dresen and
.
Schneider, 1994 identified the waste location with an approximate thickness of about 8–12 m. Another aim of these measurements was the detection of possible contamination plumes from the waste site.
The objective of the RMT measurements on this area was to test their applicability and efficiency with regard to the exploration of a geophysically well studied waste. Especially a very detailed information about the lateral boundaries and vertical extension of a waste site is expected from the RMT measurements.
Four pairs of frequencies from radio transmit-ters perpendicular to each other 23.8, 68, 128.5 and 270 kHz for NWrSE direction and 18.3, 75, 153 and 261 kHz for NErSW direction have been used. Previous geophysical measure-ments indicate that the strike of the waste site is in the NWrSE direction, which is associated with the E-polarization case. Apparent resistiv-ity and phase data were collected on 14 profiles using a station interval varying between 12.5 and 50 m. The distance between the profiles varies from 20 m in the waste to 50 m outside of it. The expected boundaries of the waste site are densely sampled.
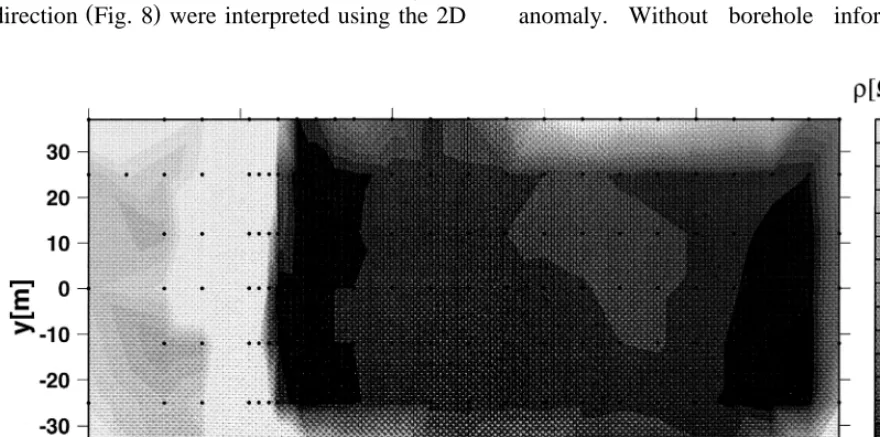
The observed apparent resistivity and phase data are shown in Figs. 7 and 8 as derived from transmitters located in NWrSE direction. They clearly show the approximate location of the waste site, which is bounded by the profiles 250
Ž .
and 450 y-direction and the stations 150 and
Ž .
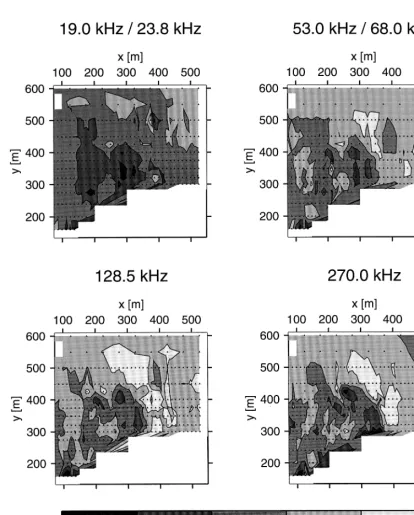
360 x-direction . The apparent resistivity val-ues in Fig. 7 show a relatively heterogeneous composition of the waste site with minimum resistivities of 10 Vm in some locations. The corresponding phase values in Fig. 8 generally reflect the same variability over the waste dis-posal. The average value of the phase is about
tive unit below the well-conducting waste mate-rial. The apparent resistivities and phases observed by using transmitters from NErSW direction show the same qualitative results.
The observed data of the 19 profiles are interpreted by means of 2D inversion algorithms and will be shown together with the inversion results of the industrial waste site Mellendorf in the following.
4. Two-dimensional interpretation of the RMT data
In general, more than 300 RMT stations are used for a waste site exploration. More than 30 stations on a profile are very common. The number of RMT stations to be interpreted by a conductivity model is much larger than in the case of a classic magnetotelluric survey. Trial and error fitting using 2D forward modeling proves to be very time consuming for such a large number of stations. A 2D inversion algo-rithm is used for the interpretation of RMT data.
Ž
The field setup described in Section 2 e.g., transmitters with similar frequencies parallel and perpendicular to the assumed strike direction of
.
a waste site enables the application of 2D inversion algorithms on the data. Compared to classic MT measurements only information about Zx y and Zy x elements of the impedance tensor is available. The Zx x and Zy y elements are not estimated and assumed to be zero as they should be in ideal case of a 2D conductiv-ity anomaly. However, Zx y and Zy x may devi-ate from the estimdevi-ated ones if 3D effects are present.
Ž .
Ziebell 1997 carried out model calculations with different types of modeling algorithms us-ing synthetic and field data. He shows that the
Ž .
An inversion of the complete 2D Helmholtz-equation is carried out in the algorithm of
Ž .
Mackie et al. 1997 . First, the subsurface struc-ture is parameterized by using the finite differ-ence technique. The components of the
sensitiv-Ž
ity matrix e.g., the partial derivative of the field
.
values with respect to the model parameters are calculated by using the technique of adjugate Green’s functions. For N stations and F fre-quencies per E- and B-polarization mode, N=F forward modeling calculations should be carried out to calculate the elements of the sensitivity matrix. The inversion procedure can be started after the calculation of the sensitivity matrix. In a two-dimensional case, the problem is ill-posed and a regularization procedure must be
imple-Ž .
mented. Mackie et al. 1997 use Tikhonov’s method which defines a regularized solution of the inverse problem as a model m that mini-mizes the objective function.
T y1
S m
Ž .
sŽ
dyF mŽ .
RddŽ
dyF mŽ .
.
5 52
qt L m
Ž
ym0.
Ž .
3Ž
where dsobserved data vector e.g., apparent
.
resistivities and phases , Fsforward modeling
Ž
operator e.g., the differential equations for the different field components of the E- and
B-.
polarization case , msunknown model vector, Rddserror covariance matrix, m0sa priori model, tsregularization parameter and L is a linear operator for the regularization procedure.
Ž .
Mackie et al. 1997 use a Laplacian operator
ŽLsD., yielding
A very important parameter which influences the result of the inversion is the regularisation
Ž .
parametert. According to Mackie et al. 1997 , the value of t should be chosen in such a way that a RMS error for the inversion is between 1.0 and 1.5%. Typical values for t vary be-tween 3 and 300. Large t values cause a
Ž .
smoother model. Ziebell 1997 examined with
Ž
synthetic data typical waste site locations e.g., good conductive anomaly beneath a 1–3 m top
.
layer embedded in a poorly conductive host using the 2D inversion algorithm of Mackie et
Ž .
al. 1997 . He found that the top layer and the waste are well resolved by using the RMT
Ž .
frequencies 10–300 kHz if t is chosen to be 100. In the following, this value was chosen during the inversion of the RMT field data. A Gauss–Newton algorithm with matrix inversion was used for numerical minimization of the objective function S. Then a minimum differ-ence in the structure between start model and final model was looked for. The resulting final 2D conductivity model minimizes also the dif-ference between observed and calculated data.
4.1. Two-dimensional conductiÕity models for
the industrial waste site Mellendorf
The RMT data of nine profiles in EW direc-tion associated with the E- and B-polarizadirec-tion of the magnetotelluric field have been interpreted by the 2D inversion technique of Madden and
Ž .
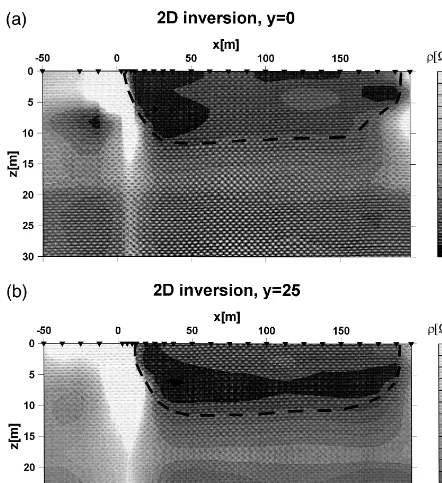
Mackie 1989 . Fig. 9 shows the result of the 2D inversion as a resistivity cross-section for the profiles ys0 m and ys25 m. The waste site is clearly emphasized by low resistivities
Ž-35 Vm . Its lateral borders at profile loca-.
tions 10 and 180 m are clearly detected by the model. The local good conductive zone outside of the waste site at 3 m can be interpreted as a small clay body in the sandy layer. The same anomaly was detected in the same area by TEM measurements which were carried out just
be-Ž .
fore the RMT survey Schaumann, 1997 . The bottom of the waste site can be estimated to be
Ž
15 m. However, the lowest frequency e.g., 16
.
kHz is not sufficiently low for clearly detecting it. The central depth of the in-phase induced
UŽ .
currents z Schmucker, 1987 which is defined as
ra
U
z s
(
sinfŽ .
5Fig. 9. Two-dimensional inversion results for the profiles ys0 and ys25 in Mellendorf. The dashed lines indicate the lateral and vertical boundaries derived from the 2D conductivity models.
has been used as a guide for the maximum depth from which information about the conduc-tivity structure can be obtained. The 1D and 2D
Ž .
model calculations of Ziebell 1997 have shown that 2 zU can be used for RMT frequencies for
maximum interpretation depth in the case of
Ž
waste site surveys e.g., a well-conductive body
.
embedded in a poorly conductive host . VLF frequencies have been used for the
determina-Ž U
.
waste site which is about 20 m for 16 kHz
ŽE-polarization and for 20.3 kHz B-polariza-. Ž .
tion . Similar inversion results have been ob-tained for the other profiles on the waste site in Mellendorf. A quasi-3D resistivity distribution at 3 m depth derived from the 2D modeling of all RMT profiles is shown in Fig. 10 as an example. The lateral borders of the waste de-posit have been determined accurately. There is a clear difference between undisturbed geology
Žr)100 Vm and the waste site. Žr-35Vm.
at this depth. The calculated 2D inversion re-sults also enable resistivity slices to be derived from the modeled data set down to the
maxi-Ž U.
mum interpretation depth e.g., 2 z . Such rep-resentations can be seen as a final interpretation
Ž .
step for a RMT survey see also Section 4.2 .
4.2. Two-dimensional conductiÕity models for
the Hermsdorf waste site
As in the case of the waste site in Mellen-dorf, the RMT data from 19 profiles in NErSW
Ž .
direction Fig. 8 were interpreted using the 2D
Ž .
inversion algorithm of Mackie et al. 1997 . Apparent resistivities and phases for four
fre-Ž .
quencies in NWrSE E-polarization and
Ž .
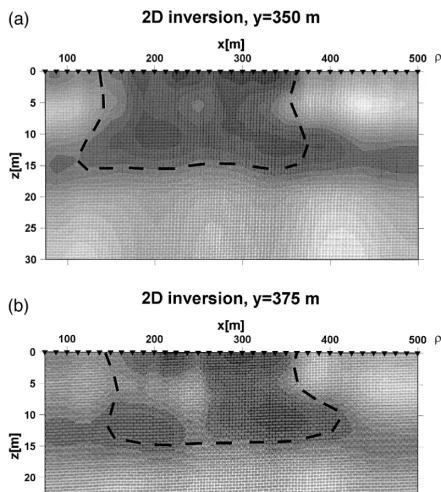
NErSW B-polarization direction were used as input data. Fig. 11 shows the inversion results of profiles ys350 m and ys375 m crossing the waste site. Again, the waste site can clearly be seen as a good conductive body with resistiv-ities less than 35 Vm. The lateral borders are also well defined. The vertical extension of the waste site cannot be resolved accurately. It can quantitatively be estimated to be at 15 m from the 2D inversion models. The 2 zU values on the waste site vary for the VLF frequencies between 14 and 16 m. A well-conducting struc-ture outside of the waste site at a depth of 10–17 m can also be seen on the 2D models and could be interpreted as a contamination plume. The previous geophysical measurements
Že.g., DC soundings also confirm these anoma-.
Ž .
lies Lindner et al., 1993 . The other possible interpretation for this good conductive anomaly is the increase of loose packed materials in the bunter sandstone which can produce the same anomaly. Without borehole information no
Fig. 11. Two-dimensional inversion results for the profiles ys350 and ys375 in Hermsdorf. The dashed lines indicate the lateral and vertical boundaries derived from the 2D conductivity models.
definitive interpretation about this anomaly is possible from surface measurements. The 2D conductivity models in Figs. 9 and 11 are the
Fig. 12. Observed and calculated apparent resistivity and phases for the highest frequency 270 kHz on profile ys350 in Hermsdorf. The 2D model in Fig. 11 was used for calculating theoretical apparent resistivity and phase data.
calculated data for the highest frequency of 270 kHz on the profile ys300 m. This comparison
Fig. 13. Resistivity distribution beneath the waste site Hermsdorf in 3 m depth, derived from the 2D inversion results.
the fit is good for such an inhomogeneous area. The main features of the data could be ex-plained by the 2D conductivity models. How-ever, there are some large misfits between ob-served and modeled data. Especially the steep abrupt change of data from station to station cannot be explained by this type of model due to smoothing criteria in the inversion algorithm. The observed data can be influenced by local inhomogeneities. The complete impedance ten-sor cannot be measured by the RMT instrument used for these surveys. There are also no stable 3D inversion algorithm available. These are the main reason why the interpretation of the RMT data were carried out by 2D inversion algorithm assuming a 2D conductivity structure. Similar to the case in Mellendorf, the 2D inverted profiles can be presented as slices through certain depths in order to obtain a quasi-3D resistivity distribu-tion of the survey area. Fig. 13 shows the resistivity distribution at 3 m depth derived from all 2D inversion results. About 20 min. CPU time is needed for each inversion. The
lateral borders of the waste site can again be defined accurately. There is a significant resis-tivity difference between the waste site -35 Vm and the surrounding host.
5. Conclusions
The radiomagnetotelluric technique is a pow-erful tool for waste site exploration. The case histories shown in this paper and the previous RMT surveys proved the efficiency of this method.
The great advantage of RMT lies in the fact that it combines both profiling and sounding. A
Ž
specially designed field setup e.g., the use of radio transmitters parallel and perpendicular to
.
the assumed strike direction of a waste site enables the interpretation of the data by 2D conductivity models giving depth information of the survey area.
hence just a rough information about their lat-eral borders could be deduced. On the other hand, the 2D inversion algorithm of Mackie et
Ž .
al. 1997 has been used to interpret the RMT data and enabled an excellent resolution of the lateral borders of the waste sites in Hermsdorf and Mellendorf which are also confirmed by historical records about the waste deposits. The bottom of these waste sites could also be esti-mated.
References
Beamish, D., 1998. Three-dimensional modelling of VLF
Ž .
data. Journal of Applied Geophysics 39 2 , 63–76. Berktold, A., Schleicher, F., Strobl, F., Mathies, P.,
Durch-lasser, H.P., 1992. Moglichkeiten und Grenzen des¨
VLF-R Verfahrens im IngenieurrUmweltbereich. Munchner Geophysikalische Mitteilungen 6, 65–88.¨
Cagniard, L., 1953. Basic theory of the magneto-telluric method of geophycial prospecting. Geophysics 18, 605–645.
Dautel, S., 1996. Untersuchung einer ehemaligen Mulldeponie in Koln–Poll mit Radiomagnetotellurik.¨ ¨
Diplom-thesis, Institut fur Geophysik und Meteorolo-¨
gie, Universitat zu Koln.¨ ¨
Dresen, L., Schneider, C., 1994. Erkundung des oberflachennahen Untergrundes von Deponien, Altlas-¨
ten und Standorten neuanzulegender Deponien mit dis-persiven seismischen Wellen, Forschungsbericht zum BMFT-Verbundvorhaben ‘Deponieuntergrund’, Institut fur Geophysik der Ruhr-Universitat Bochum.¨ ¨
Dupis, A., Choquier, A., 1996. How electrostatics was introduced in subsurface geophysics. Extended abstract, proceedings, 2nd meeting, Environmental and Engi-neering Geophysical Society, Nantes, pp. 125–128. Franzius, V., 1994. Aktuelle Entwicklungen zur
Altlasten-problematik in der Bundesrepublik Deutschland.
Ž .
Umwelt Technologie Aktuell UTA , pp. 443–448. Hollier-Larousse, A., Lagabrielle, R., Levinian, J.P., 1994.
Utilisation de la radiomagnetotellurique pour la recon-´ ´
naissance en site aquatique. Journal of Applied Geo-physics 31, 72–84.
Lindner, H., Lorenz, K., Seidemann, O., Steiner, G., 1993. Erkundung von Altstandorten, HermsdorfrThuringen,¨
Ž .
Ergebnisbericht, Geophysik GGD Leipzig im Auftrag der Bundesanstalt fur Geowissenschaften und Rohstoffe,¨
Hannover.
Mackie, R., Rieven, S., Rodi, W., 1997. Users manual and
software documentation for two dimensional inversion of magnetotelluric data. Department of Geological Sci-ences, Indiana University.
Madden, T.R., Mackie, R.L., 1989. Three dimensional magnetotelluric modeling and inversion. Proceedings of
Ž .
the IEEE 77 2 , 318–333.
Muller, I., 1983. Anisotropic properties of rocks detected¨
Ž .
with electromagnetic VLF Very Low Frequency . Int. Sym. Field Measurements in Geomechanics. Zurich,¨
Spec. Publ., pp. 273–282.
Pretzschner, C., Boerner, R.U., Gbodogbe, J.C., Kappler,¨
R., Lindner, H., Vogt, R., Wagenbreth, B., 1993. Erkundungsarbeiten am Teststandort Hermsdorfr Thuringen, Me¨ bverfahren: mise a la masse, Eigenpo-`
tential, Ergebnisbericht, Bergakademie Freiberg im Auftrag der Bundesanstalt fur Geowissenschaften und¨
Rohstoffe.
Renno, T., Christofzik, H., 1987. Geologische und hydro-geologische Untersuchungen im Umfeld einer still-gelegten Sonderabfalldeponie der Volkswagen bei Mel-lendorf, Geo-data.
Schaumann, G., 1997. Anwendung der Transienten Elek-tromagnetik auf eine Industriealtlast in Mellendorf bei Hannover, 4.DGG Seminar ‘Umweltgeophysik’, NeustadtrWeinstraße, pp. 80–90.
Schmucker, U., 1987. Substitute conductors for electro-magnetic response estimates. PAGEOPH 125, 341–367. Schroder, R., 1994. Gultigkeitsbereich der ‘Ebenen Wellen¨ ¨
Theorie’ unter Berucksichtigung der Verschiebungs-¨
strome bezogen auf die geoelektrischen Me¨ bmethoden
Ž .
VLF-R LF-R , CSAMT und Short-Wave Loop–Loop. Diplom-thesis, Institut fur Geophysik und Meteorolo-¨
gie, Universitat zu Koln.¨ ¨
Smith, J.T., Booker, J.R., 1991. Rapid inversion of two and three dimensional magnetotelluric data. Journal of Geophysical Research 96, 3905–3922.
Tezkan, B., Goldman, M., Greinwald, S., Hordt, A., Muller,¨ ¨
I., Neubauer, F.M., Zacher, G., 1996. A joint applica-tion of radiomagnetotellurics and transient electromag-netics to the investigation of a waste deposit in Cologne, Germany. Journal of Applied Geophysics 34, 199–212. Tezkan, B., Zacher, G., Dautel, S., 1997. On the applica-tion of radiomagnetotellurics to waste site exploraapplica-tion in Germany. Extended abstract, SAGEEP, Reno, NV, pp. 825–833.
Turberg, P., 1991. Quelques observation sur la prospection geophysique du milieu karstique parelectromagnetique´ ´ ´
Ž
‘ very low frequency–resistivity’ VLFrR 12 a 240`
.
kHz . Bulletin du Centre d’hydrogeologie de l’Uni-´
versite de Neuchatel, no. 10.´ ˆ
Zacher, G., Tezkan, B., Neubauer, F.M., Hordt, A., Muller,¨ ¨
roda, Thuringia. Extended Abstract, proceeding, 2nd Meeting, Environmental and Engineering Geophysical Society, Nantes, pp. 212–215.
stitut fur Geophysik und Meteorologie, Universitat zu¨ ¨