Subglobal climate-change actions and
carbon leakage: the implication of
international capital flows
Mustafa H. Babiker
UMIT Joint Program on the Science and Policy of Global Change, Cambridge, MA 02139-4307, USA
Abstract
The climate-change agreement negotiated in Kyoto obliges the OECD countries to initiate the international effort of abating the anthropogenic greenhouse gas emissions. In the event that such an initiative is taken, the associated competitive pressures may induce
Ž
significant offsetting increases in non-OECD emissions a process generally known as .
leakage . The current models used to study these competitive effects have adopted an empirically inconsistent view of the world that international capital markets are perfectly integrated. To the extent that restrictions on the international mobility of capital affect regional investment decisions, it might be expected that the competitive impacts drawn from these models could significantly be altered. This paper addresses this issue. The paper suggests that these competitive effects are not really contingent on capital flows. With a regionally disaggregated dynamic model of the world economy, we show a quite robust result that carbon leakage is virtually unaffected by the presence of restrictions on the mobility of international capital.䊚2001 Elsevier Science B.V. All rights reserved.
JEL classifications:F21; Q40
Keywords:Kyoto; Leakage; Capital flows; Competitive effects
1. Introduction
If OECD countries are to engage unilaterally in an effort to abate anthropogenic
Ž .
CO -emissions along the lines suggested by the Berlin Mandate 1995, 1996 and2
U
Ž .
E-mail address:[email protected] M.H. Babiker .
0140-9883r01r$ - see front matter䊚2001 Elsevier Science B.V. All rights reserved.
Ž .
Ž .
the Kyoto Agreement 1997 , it is possible that significant offsetting increases in global emissions may take place in non-OECD countries. The scope for such a leakage effect as well as its manifestations on international trade flows, the location of energy-intensive production, and the competitiveness of OECD economies have been a subject of considerable interest among climate-change policies analysts in the US and Europe. Nevertheless, almost all of the existing
Ž .
Computable General Equilibrium CGE models used in studying these competi-tive impacts have adopted an orthodox view of the world that international capital markets are perfectly integrated.1 Unfortunately, the accumulated empirical evidence over the last two decades seem to refute strongly such a view.
Ž . Ž .
The findings in Feldstein and Horioka 1980 , and Gordon and Bovenberg 1996 that the regional investment-savings patterns are largely independent of the rate of return differentials are suggestive indicators that there have been some restrictions on the international mobility of capital. The presence of such restrictions may be
Ž .
due to risk aversion and capital market segmentation Feldstein, 1994 , to
deliber-Ž .
ate government policies Summers, 1988 , or due to imperfect information trans-fers. To the extent that restrictions on the international mobility of capital affect regional investment decisions, it might be expected that the competitive impacts drawn from these models could significantly be altered. This paper addresses this issue.
Specifically, we ask the question whether the impacts of a unilateral OECD abatement action on the non-OECD emissions trajectories are affected by the extent of capital flows. To put it more precisely: Do restrictions on international capital mobility significantly affect the regional and the global leakage profiles?
We use a dynamic multi-regional disaggregated general equilibrium model of the world economy to address the linkage between capital flows and carbon leakage. Given the complexity of the interactions among regional economies, energy mar-kets, international trade, capital accumulations, and capital flows, such a detailed computable general equilibrium framework is clearly warranted. Within this frame-work we show an invariant result that carbon leakage is virtually unaffected by the extent of capital flows.
For the current climate-change-policies regime, such a result has two crucial implications. First, the policy recommendations to be drawn from the existing Impact Assessment models are largely independent of the capital-flows assump-tion. Second, in the event of a subglobal abatement action, policies that aim at curtailing leakage through restricting the international mobility of capital are virtually ineffective. Given the economic and political leverage of OECD it is feasible that some forms of restrictions on capital flows, via the international lending institutions, may be effected with the objective to curtail carbon leakage. Our result suggests that exercising such a power does not yield any significant
1 Ž . Ž .
Examples of such impact assessment models are GREEN OECD , CRTM Rutherford , G-cubed
ŽMcKibbin and Wilcoxen , IIAM Montgomery, Rutherford, and Bernstein , and WorldScan CPB. Ž . Ž .
Netherlands Bureau of Economic Policy Analysis . For a description and comparisons among the
Ž .
reduction in leakage. The rest of the paper is organized as follows. Section 2 outlines the key features of our dynamic general equilibrium model. Section 3 presents the numerical results, and Section 4 concludes.
2. The model
The modeling framework adopted in this analysis is the conventional Ramsey type growth model, in which along the baseline all real variables grow at a uniform growth rate and the present values of all nominal variables decrease at a uniform discount rate. The first year in the model is year 2000 and the horizon extends
Ž .
through 2040 in time-intervals or periods each of 5 years length. The model is built on a comprehensive energy᎐economy dataset that accommodates a consistent representation of energy markets in physical units as well as detailed accounts of
Ž
regional production and bilateral trade flows for 1992 for details on the dataset,
.
see Rutherford and Babiker, 1997 .
Ž .
There are seven regions in the model: OECD as defined in 1990 OEC ; oil
Ž . Ž . Ž .
exporting countries OEX ; former Soviet Union FSU ; China and India CHI ;
Ž .
the dynamic Asian economies DAS ; the dynamic economies of South America
ŽDSM ; and the rest of the world ROW . There are seven commodities in the. Ž .
model: five energy goods and two non-energy goods. The energy goods identified in
Ž . Ž . Ž .
the model include coal COL , natural gas GAS , crude oil CRU , refined oil
Ž . Ž .
products OIL , and electricity ELE . This disaggregation is essential to distin-guish energy goods by carbon intensity and by the degree of substitutability. The
Ž .
two energy goods are an energy intensive tradable good EIS , and a
non-Ž .
energy intensive good Y . The primary factors in the model include labor, physical capital, and fossil-fuel resources. Fossil-fuel resources are sector-specific, but labor and physical capital are treated as perfectly mobile across sectors. The key features and equations in the model formulation are outlined in the following.
2.1. Consumer beha¨ior
In each region, r, the intertemporal utility function of the infinitely lived representative consumer is the discounted sum of the utility of consumption over the horizon:
In this equation,is the discount rate, is the coefficient-of-relative-risk-aversion
ŽCRRA that controls the intertemporal elasticity of substitution, and. Cr t is a
Ž .
E
E E 1r
i t i t t Ž .
Cr ts ␣r
@
Ci r t qr@
Ci r t 2igE ifE
Where the elasticity of substitution between the energy and the non-energy
E Ž E.
composites is given by t s1r1yt , i indexes all goods, E indexes energy goods, is are the value shares, and where ␣r and r are the requirement coefficients in the CES function.2
In the standard manner, the representative consumer maximizes the utility
Ž .
function in Eq. 1 subject to a life-time budget constraint that the present value of consumption equals the present value of income:
Ž . household consumption, capital, labor, rents on fossil-fuel resources, government consumption, and a numeraire index, respectively. K0 is the initial capital stock,
L0 is the initial labor supply, R is the fossil-fuel resource supply, TR is the total revenue from taxes, BOPD are the baseline exogenous capital flows, G0 is the exogenous growth rate in the labor-augmented technical change, and Gr t is the
Ž .
government consumption bundle and has the same form as Cr t in Eq. 2 .
In this representation the household consumption is financed from labor income, the value of the initial capital stock, the rents realized from the ownership of the fossil-fuel resources, the tax revenues, and some exogenous capital flows. Taxes apply to energy as well as non-energy demand, to production and incomes, and to international trade. The exogenous capital flows represent the initial balance of payment deficits in the dataset and we project them to grow along the baseline at the GNP growth rate. The government consumption is financed through lump sum levies and does not enter the representative consumer utility function, hence the level of the government activity is fixed exogenously in our model.
2.2. Production acti¨ities
The model includes two types of production functions: those of fossil fuels
ŽCRU, COL, OIL, and GAS and those of non-fossil fuels ELE, EIS, and Y . An. Ž .
indexYi r t denotes the level of production of good iin region r in period t. Except for crude oil, which is modeled as a perfectly homogenous good, goodiis produced
2
as differentiated products for sale in the domestic and international markets. The shares of sales at home and abroad are determined by relative prices. A
constant-Ž .
elasticity-of-transformation CET function characterizes the allocation of output between domestic and export sales. Producers of the final good maximize profits subject to the constraint:
w x1r Ž .
Yi r ts ␣i rDi r tqi rXi r t 4
t r Ž .
In this equation the transformation elasticity is given by s1r1q.
The production of the non-fossil fuel good, N, is associated with a nested CES function based on non-energy intermediate inputs, Z, an energy component, E, and a primary factor composite, V. Given the prices of these components, the producer of good N operates to minimize the production cost for a given level of output subject to the technology constraint:
E
In this function the non-energy intermediate inputs enter at the top nest in fixed proportions among themselves as well as in relation to the energy-primary-factor aggregate. In the second nest, we account for the substitution between energy and
E Ž E.
primary factors through t s1r 1yt . In the third nest we characterize sepa-rately the substitution possibilities among the components of the primary factor composite and among the components of the energy composite. The primary factor composite is represented by a Cobb᎐Douglas aggregate of labor and capital services:
␣N r 1y␣N r Ž .
VN r tsLN r tKN r t 6
In this equation labor is expressed in efficiency units and ␣ is the labor value share.
The aggregate energy good,E, is produced by the linear technology:
f b Ž .
EN r tsEN r tqEN r t 7
According to this equation there are two sources for the aggregate energy good that are perfectly substitutable. There is a current low-cost fossil fuel source, f, and there is a high-cost ‘backstop’ carbon free source that may be introduced in the future.3 The fossil-fuel energy source is in turn associated with a nested CES
3
Different from the conventional treatment, here we differentiate the backstoptechnology by sector. This seems more appropriate than assuming a uniform technology, since it is more conceivable that the
Ž .
function based on refined oil, gas, coal, and fossil-fuel based electricity:
o o o
f N rr 1yN r Ž .
EN r ts
½
␣N rOyGN r tqN rCOLN r t )ELEN r t5
8In this expression electricity enters in a Cobb᎐Douglas form with oil, gas, and coal
Ž .
at the top nest, with a value share defined by 1y. At the second level the
o Ž o.
oil᎐gas composite substitutes with coal according s1r1y . The oil᎐gas composite, on the other hand, is assumed to have a simple Cobb᎐Douglas repre-sentation. Hence, in our model, carbon abatement may be achieved in three ways: changing the fossil fuels mix, reducing the amount of energy per unit of output, and by investing in the carbon free source.
In contrast, the production of fossil fuel F is associated with a nested CES function based on a fuel-specific resource, labor, and intermediate inputs. Given the prices of these inputs, mine managers minimize production costs subject to the technology constraint:
In this equation production is characterized by the presence of a resource in fixed-supply that substitutes with the rest of inputs at the top level nest according
R
Ž R.
to the elasticity F rs1r1yF r . This substitution elasticity is controlled by the
Ž .
supply price elasticity for the particular fuel according to the formula F r
1y␥F r R
s F r, with ␥F r being the resource value share. At the second nest, the
␥F r
rest of the inputs enter in fixed proportions. On the other hand, since the refinery activity does not require a sector-specific resource, the production technology for
Ž .
refined oil collapses to the fixed proportion part of Eq. 9 .
2.3. Supplies of final goods and foreign trade
Except for crude oil, intermediate and final consumption goods are differenti-ated following the standard Armington convention. Accordingly, for each type, the total supply of the good is a CES composite of a domestic variety and an imported one. Given the domestic and the import prices, firms in the distribution sector maximize profits subject to the constraints:
In these expressions the Armington elasticity between the domestic and the imported varieties is controlled by D.
All goods are traded in world markets subject to export taxes, tariffs, and transport costs. Crude oil is exported and imported as a perfectly homogenous good, whereas all other goods are characterized by product differentiation with explicit representation of bilateral trade flows. Given the regional export prices, tariffs, and transport costs, firms operating in the import sector minimize costs by allocating their import orders across the different trading partners subject to the constraint:
M M
1r Ž .
Mi r ts
Ý
␣i srXi sr t 11s
In this equation Xi sr t is the amount imported by region r from region s, and M
controls the extent of the product differentiability among the trading partners.
2.4. Capital accumulation
The region aggregate investment is the sum of the sectoral investments in the region. Part of the investment in periodt is assumed to mature in the same period and the rest in period tq1. The capital stock evolves according to the standard rule:
Ž . Ž .
Kr,tq1s 1y␦ Kr tq 1y Ir tqIr,tq1 ,
Ž .
Kr,1sK0r 12
In this expression,␦is the capital depreciation rate,is the investment own-period maturation rate, and K0 is the initial capital stock.
2.5. Market clearance conditions
Output for the domestic market in period t is either consumed or invested:
Ž .
Di r tsZDi r tqCDi r tqGDi r tqInvesti r t 13
The output for the export market in period t has to meet the regional demands:
Ž .
Xi r ts
Ý
Xi r st 14s
The import supply in periodt has to satisfy the domestic demands for the imported good:
Ž .
Finally, international markets have to clear for each good and in each period:
CO emissions are generated in fixed proportions via the consumption of fossil2 fuels by the industry and the final demand sectors. Accordingly, the carbon emissions in region r in period t are given by:
Ž . Ž .
Emissionsr ts
Ý
CO Coeff2 F ZF r tqCF r tqGF r t 17 FŽ
In which, CO Coeff is the carbon content expressed in the heat units b ton2 r
.
exajoule . Under a subglobal abatement action, the carbon leakage rates in the non-abating regions are defined as the deviations in their emissions from their baseline trajectories divided by the corresponding amount of abatement in the colluding regions. The global leakage rate is then simply the sum of the regional leakage rates.
2.7. Balance of payments and capital flows
The net balance of payment deficit in region r in period t is given by the expression: In this expression PM is the cif present-value price of imports, PX is the fob
present-value price of exports, Oilm is crude oil imports, Oilx is crude oil exports, and Pcrude is the international present-value price of crude oil. As before, Pnum is a present-value numeraire price and BOPD is the baseline balance of payment
Ž .
deficit. Along the baseline the last term in Eq. 18 represents the net capital inflows. It is critical, however, which price to use as a numeraire for denominating the baseline balance of payment deficits. In principle the price of any homogenous commodity traded in the international market can serve the role of a numeraire.
Ž .
Unfortunately, the only homogenous good in our model crude oil has its price directly affected by the carbon abatement action. Hence we can’t use crude oil as a numeraire and instead we decide to use the OECD labor price index.
Numerically, the model is formulated and solved as Mixed Complementarity
Ž . Ž
Problem MCP using GAMSrMPSGE system described in Rutherford 1995,
.
3. Results
3.1. Parameters and policy scenarios
The essential parameters and elasticities used in the model are summarized in Table 1. The carbon emissions limit in OECD is set according to the Kyoto Agreement, and is assumed to take effect starting from year 2005 on.4 To assess the impact of capital controls on carbon leakage in the presence of an OECD abatement policy, we implement a scenario in which all regions, except OECD, are constrained in the international capital market. According to this scenario each non-OECD region is subject to global capital restrictions that its BOP deficit must
Ž
not exceed its baseline trajectory throughout the model horizon. The baseline or
.
the Business as Usual, BaU is in turn defined as the situation where there is no carbon abatement anywhere.
A natural way of modeling capital controls and financial repression is by treating
Ž
them as implicit taxes Giovannini and de Melo, 1993; Alm and Buckley, 1997;
.
Manne and Stephan, 1997 . Provided the absence of financial instruments and government deficits in our model, BOP controls are equivalent to current account
Ž
controls. Therefore, the capital controls are modeled as endogenous taxes or
.
equivalently, foreign exchange premiums on international merchandise trade subject to the constraint that the net current account deficits should not exceed their target levels in the scenario.
3.2. Numerical results ᎏ central case
Ž D M.
In the central case the Armington elasticities and are, respectively, 8
Ž . Ž .
and 16, the utility discount rate is 5%, and the crude oil supply elasticity is 1.
Fig. 1 shows the implications of carbon Policies on regional BOP deficits with and without capital flow constraints. Fig. 1a displays the magnitudes of the BAU projected exogenous capital flows in present-value dollars. It is clear that the oil
Ž .
exporting countries OEX are the major suppliers of international capital and that
Ž .
OECD and the dynamic Asian economies DAS are the major demanders. It is
Ž .
also evident that all other regions, except the rest of the world ROW and the
Ž .
dynamic South American economies DSM , are net borrowers in the international capital market. In disposable income terms, these flows amount to 0.7% in OECD, 1.3% in FSU, 1.9% in CHN, 15% in OEX, 0.5% in DSM, 5.5% in DAS, and 1% in ROW for the year 2000. Fig. 1b shows how the regional BOP deficits might evolve over time in the absence of capital controls if OECD were to adopt the carbon abatement policy. Fig. 1b suggests significant capital outflows from OECD to the other regions during the first 15 years of the horizon. In particular OECD appears to move from a major importer of international capital to a major exporter,
4
Table 1
A summary of the model’s parameters
Parameter Description Value Comments
Low Medium High t r
The transformation elasticity 1 2 ᎐ 1 for fossil fuels
2 for non-fossil fuels E
t Substitution between energy and 0.25 0.35 0.5 Increases gradually
non-energy in intermediate and from the short run to
final demand sectors the long run
O
Substitution between the oil᎐gas ᎐ 0.5 ᎐ Non-fossil fuel
composite and coal in production production only
D
Armington substitution between ᎐ 2 ᎐ Energy goods
domestic and imports 4 8 16 Non-energy goods
M
Armington substitution across ᎐ 4 ᎐ Energy goods
imports 8 16 32 Non-energy goods
F r Fossil fuels supply elasticities 0 1 5 Crude oil
᎐ 0.5 ᎐ Coal
᎐ 1 ᎐ Natural gas
G0 Labor supply growth rate ᎐ 2.5% ᎐ Uniform growth case
᎐ 2.5% 3.5% Different growth case: 2.5 for OECD and 3.5 for non-OECD ␦ The depreciation rate of capital ᎐ 7% ᎐ Uniform across regions
stock
Investment own-period ᎐ 0.4 ᎐ Uniform across regions
maturation rate
The utility discount rate 0.03 0.05 0.07 Uniform across
regions
The coefficient of relative risk ᎐ 2 ᎐ Uniform across
Ž .
aversion CRRA regions
whereas both DSM and ROW are now net importers of capital. In contrast, Fig. 1c shows how the regional BOP deficits might evolve in the presence of global restrictions on capital mobility. It is clear from Fig. 1c that international capital flights are virtually sterilized in the first two decades during which the BOP constraints are binding.
Ž . Ž .
Fig. 1. Carbon tax, BOP deficits and capital flows: a baseline BOP deficits BAUᎏno carbon tax ;
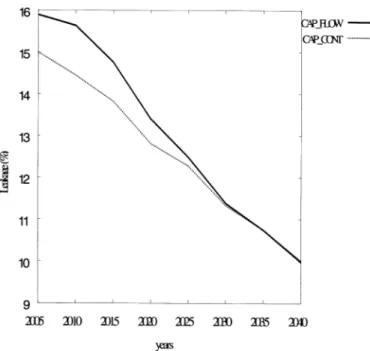
Fig. 2. Capital flows and global carbon leakage.
Fig. 2 depicts the global carbon leakage profiles under these two regimes. In both regimes the leakage rate is high at the beginning of the horizon, but declines gradually to reach a level of 10% by the end of the horizon. Such a time profile of leakage may be explained by the fact that the unilateral emissions cut in OECD puts a downward pressure on the international crude-oil price in the early periods and thereby induces non-OECD regions to become more energy intensive. How-ever, the strength of this pressure declines as the backstop technologies start to kick in gradually after year 2020. Compared to other studies, our average leakage rate of 14% for the capital flows case is 2% higher than that reported in Babiker
Ž .
and Rutherford 1998 for the static version of the model, and 3% higher than that
Ž .
reported in OECD 1992 for a similar parameterization of an EU unilateral abatement initiative. With the capital controls in effect, in spite of the tightness of
Ž .
the restrictions, Fig. 2 indicates that in absolute terms the global leakage rate is at most only 1% lower than that in the case of capital flows. Furthermore, the figure shows a virtually complete convergence to the no-controls leakage profile by year 2025. Hence, the upshot of Fig. 2 is the result that the global leakage profile is largely unaffected by the restrictions on capital flows.
Ž . Ž .
profiles from their unrestricted levels during the first two decades. Indeed, without a careful look, it may be even hard to discern the differences between the two plots. Therefore, not only the global leakage profile but also the regional leakage profiles are largely unaffected by the presence of capital controls.
Next we ask whether our result of the ineffectiveness of capital controls on carbon leakage is in fact dictated by the parameter values used in the central case. The following subsection addresses this question. We shall see that this result holds regardless of the particular assumptions on the trade structure, the oil supply elasticity, the utility discount rate, and the pattern of regional growth rates.
3.3. Sensiti¨ity analysis
In assessing the sensitivity of the relationship between leakage and capital flows to the alternative model parameters, we limit our focus to the global leakage rate. To ensure comparability across the different cases and the different parameter values, we turn off the backstop technologies in all the sensitivity simulations. In relation to carbon leakage, the three crucial parameters in the model are the utility discount rate, the two Armington elasticities, and the crude-oil supply elasticity. The utility discount rate affects the consumption profiles and the rates of return to capital accumulation. By moving resources from consumption to investment, a low discount rate is likely to reduce the global leakage rate whereas a high discount rate is likely to increase it. The Armington elasticities determine the scope for trade-induced carbon leakage: the higher the elasticities the more homogenous are the traded goods and the greater the scope for leakage. The crude-oil supply elasticity determines the extent to which the international crude oil price falls in response to the OECD carbon abatement policy. The lower the supply elasticity the greater the downward pressure on the international crude oil price and the greater the scope for carbon leakage. Three experiments, one on each of these parameters, are included in the sensitivity exercise. In each experiment the global leakage rate is computed for a low value and a high value of the particular parameter in both capital-flows regimes. For the Armington elasticities the low values are 4 and 8 and the high values are 16 and 32, for the utility discount rate the low value is 3% and the high value is 7%, and for the crude-oil supply elasticity the low value is 0 and the high value is 5. In addition a fourth experiment is included to test the sensitivity of the result on leakage to the differences in regional growth rates. In this experiment, we relax our baseline assumption that both OECD and non-OECD regions grow at the same rate. Since differences in growth rates may affect leakage rates through altering the regional fossil fuel consumption profiles, it is possible that our result on the effect of capital restric-tions on leakage may no longer hold. To test this conjecture, we calibrate the model on a new baseline with 2.5% growth rate in OECD and 3.5% growth rate in all other regions.
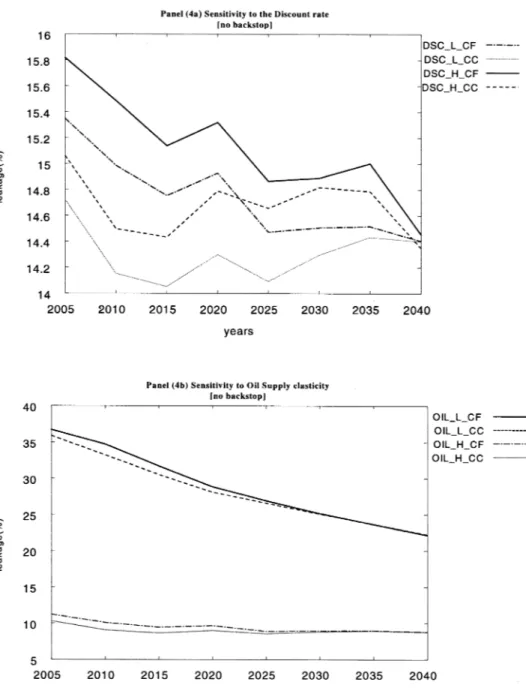
Fig. 4 reports the sensitivity results of the four experiments. Fig. 4a shows the sensitivity of global leakage to the value of the utility discount rate in the case of
Ž . Ž .
terms, the maximum difference between the CF and the CC leakage profiles is only approximately 0.8% for either value of the discount rate. Hence, our basic result is invariant to the value of the utility discount rate.
Fig. 4b depicts the CF and the CC global leakage profiles for the low and the high oil-supply elasticities. As is apparent from the graphs, the maximum discrep-ancy between the FC and the CC leakage trajectories is approximately 1.5% for the low elasticity and approximately 1% for the high elasticity value. In addition, for both elasticity values, the two leakage profiles appear to converge to the same trajectory by year 2030. This suggests that the crude-oil supply elasticity has no leverage on the relationship between carbon leakage and capital flows and there-fore does not alter our basic result.
Fig. 4c reports the sensitivity story for the Armington elasticities. The maximum discrepancy between the CF and the CC leakage profiles is approximately 1 percentage point for the high elasticity values, and approximately 0.5 percentage points for the low elasticity ones. Furthermore, for both elasticity values the global leakage rates converge to the same trajectory by year 2035. Hence, we may conclude that the relationship between leakage and capital flows is largely invari-ant to the degree of homogeneity among the traded goods.
Finally, Fig. 4d shows, for the CF and the CC regimes, the global leakage profiles under the baseline assumption that non-OECD regions grow at a higher rate than OECD. Not surprisingly, Fig. 4d indicates that the magnitude of the maximum divergence between the CF and the CC leakage profiles is only approximately 1%. Hence the result that carbon leakage is largely unaffected by the presence of restrictions on capital flows seems to be quite robust.
3.4. Some intuition
At first this result may appear to be counter intuitive. The general intuition would have it that carbon restrictions increase the costs of production and lower the rate of return to capital accumulation in OECD. This would cause capital to outflow into non-OECD regions where investment rates would boom and as a result fossil fuel consumption profiles and hence leakage rates would also boom. This intuition would mean that constraints in the international capital markets would stop these investment flows and cause leakage rates to fall drastically from their otherwise unconstrained levels.
Ž .
Fig. 4. Global leakage and capital flows: sensitivity to model parameters: a sensitivity to the discount
Ž . Ž . Ž .
capital inflows do not represent any direct real increase in national purchasing power and accordingly the regional consumption profiles and hence the regional emissions profiles should not be much affected by their presence. Third, to the extent that the non-OECD consumption profiles were actually constrained by the presence of restrictions on international capital mobility, it is the non-fossil rather than the fossil fuel profiles that would mostly likely to bear the effect. This is simply because the presence of carbon constraint in OECD lowers the relative prices of fossil fuels in non-OECD. In effect, these arguments suggest that leakage is a self-financed process and does not really require any capital flows.
The irrelevance of capital flows to the issue of climate-change policies was also
Ž .
found by Manne and Stephan 1997 in a somewhat different context. They have looked at the determination of the optimal greenhouse gas abatement in a North᎐South Integrated Assessment model. With a ‘descriptive’ view of the world, they have shown an invariant result that the Pareto-optimal amount of greenhouse abatement is virtually independent of the restrictions on capital flows. Though their result mainly relates to the optimal spilt of investment between physical and environmental capital rather than to the consumption-saving decision, it has the same implication to the current climate-change integrated-assessment models as ours to the current climate-change impact-assessment models. Both results imply that the presence of restrictions on capital flows does not significantly alter the results obtained from these models.
4. Conclusion
The current climate-change-policies regime obliges the OECD countries to initiate the international effort of abating the anthropogenic greenhouse gas emissions. If such an effort were to be taken, many observers have argued that the competitive effects could vitiate any reduction of emissions to be achieved through the carbon leakage. Nevertheless, almost all of the models that are used to study these competitive impacts have adopted an empirically inconsistent view of the world that international capital markets are perfectly functioning. To the extent that the presence of restrictions on international capital mobility affects the regional investment decisions, it might be expected that the results from these models would be significantly altered. This paper has suggested that the competi-tive effects of such an abatement action are not really contingent on the internatio-nal mobility of capital. With a regiointernatio-nally disaggregated dynamic model of the world economy, we have shown a robust result that carbon leakage is largely unaffected by the extent of capital flows.
Acknowledgements
References
Alm, J., Buckley, R., 1997. Are government revenues from financial repression worth the costs? Public
Ž .
Finance Rev. forthcoming .
Babiker, M., Rutherford, T., 1998. A unilateral OECD climate-change-policy: carbon leakage, competi-tiveness, and the optimal border adjustments. Working Paper, University of Colorado, Boulder.
Ž .
Feldstein, M., 1994. Tax Policy and International Capital Flows. Wetwirtschaftliches Arch. 130 4 , 675᎐697.
Feldstein, M., Horioka, C., 1980. Domestic saving and international capital flows. Econ. J. 90, 314᎐329. Gaskins, D., Weyant, J., 1993. Tentative conclusions from energy modeling forum study number 12 on
Ž .
controlling greenhouse gas emissions. In: Kaya, Y., Nakicenovic, N., Nordhaus, W., Toth, F. Eds. , Costs, Impacts, and Benefits of CO Mitigation. IIASA CP-93-2, Austria, pp. 2352 ᎐246.
Giovannini, A., de Melo, M., 1993. Government revenue from financial repression. Am. Econ. Rev. 83
Ž .4 , 953᎐963.
Gordon, R., Bovenberg, A.L., 1996. Why capital is so immobile internationally? Possible explanations
Ž .
and implications for capital income taxation. Am. Econ. Rev. 86 5 , 1057᎐1075.
Manne, A.S., Stephan, G., 1997. Climate-change policies and international rate-of-return differentials. Working Paper, Stanford University.
OECD, 1992. The costs of reducing CO emissions: evidence from GREEN. Economics Department2 Working Paper, No. 115, Paris.
Rutherford, T., 1995. Extensions of GAMS for Complementarity Problems Arising in Applied
Ž .
Economics. J. Econ. Dynamics Control 19 8 , 1299᎐1324.
Rutherford, T., 1997. Applied general equilibrium modeling with MPSGE as a GAMS subsystem: an
Ž .
overview of modeling framework and syntax. Comput. Econ. forthcoming .
Rutherford, T., Babiker, M., 1997. Input᎐output and general equilibrium estimates of embodied carbon: a dataset and static framework for assessment. Working Paper 97-2, University of Colorado, Boulder.
Ž .