The returns to individual and college characteristics
Evidence from the National Longitudinal Survey of Youth
James Monks
*Consortium on Financing Higher Education, Cambridge, MA 02142, USA
Received 9 May 1997; accepted 3 March 1999
Abstract
There is growing interest in the heterogeneity of earnings among college graduates. This study examines earnings differentials across both individual and institutional characteristics. Using data from the National Longitudinal Survey of Youth, it can be seen that graduates from highly or most selective colleges and universities earn significantly more than graduates from less selective institutions. Additionally, graduates from graduate degree granting and research universities, and private universities earn more than their counterparts from liberal arts colleges and public institutions. There is, however, variation across racial and gender groups in the returns to individual and college characteristics. These findings are important in an educational environment where the (market) value of a liberal arts education is under scrutiny, and where the higher costs of private versus public colleges and universities are being questioned. 2000 Elsevier Science Ltd. All rights reserved.
Keywords:Return to education
1. Introduction
The vast majority of the economics literature on the returns to a college degree has emphasized the level of education in enhancing earnings ability. The first gener-ation of the literature focused on quantifying the returns to an additional year of school or on the diploma effects of receiving one’s degree. More recently, researchers have begun to address the full breadth of college experi-ences and to explore heterogeneity in the returns to edu-cation. In particular, there has been a growing interest in the returns to both individual and institutional charac-teristics.
The existing literature tends to only control for a lim-ited number of college quality or selectivity measures (Bok & Bowen, 1998; Dowd, 1998; Davies & Guppy, 1997; Behrman, Constantine, Kletzer, McPherson & Schapiro, 1996a; Behrman, Rosenzweig & Taubman,
* Corresponding author. Tel.:11-617-253-5031; fax:1 1-617-258-8280; e-mail: [email protected]
0272-7757/00/$ - see front matter2000 Elsevier Science Ltd. All rights reserved. PII: S 0 2 7 2 - 7 7 5 7 ( 9 9 ) 0 0 0 2 3 - 0
1996b; Brewer & Ehrenberg, 1996; Brewer, Eide & Ehrenberg, 1996; Daniel, Black & Smith, 1995; Loury & Garman, 1995; Fox, 1993; James & Alsalam, 1993; Litten & Smith, 1993; Rumberger & Thomas, 1993; James, Alsalam, Conaty & To, 1989). To my knowledge no study examines the earnings of liberal arts college graduates relative to graduates from larger research-ori-ented institutions, conditional on individual and insti-tutional quality and control. This study examines the impact of selectivity, control, and college type on earn-ings. I limit the analysis to these institutional character-istics because these are the institutional qualities that are most visible to prospective students and employers.
individ-uals and institutions I am able to estimate the impact of college quality on the log of hourly wages, within institutional type and conditional upon individual charac-teristics. Conversely, I am able to estimate the returns to other institutional characteristics conditional upon qual-ity. This is especially important in an educational environment where the (market) value of a liberal arts education is under scrutiny, and where the higher costs of private versus public colleges and universities are being questioned (McPherson & Schapiro, 1991).
I find strong evidence of higher earnings among the graduates of more selective institutions. There is also evidence of a premium for attending a larger graduate degree granting university, rather than a liberal arts col-lege, and weak evidence that graduates of private insti-tutions earn more than graduates of public instiinsti-tutions. While this pattern of returns to institutional character-istics holds for most groups, there is heterogeneity in the magnitude of the returns to institutional attributes based on race and gender. For example, it appears that males receive a higher return to attending a graduate degree granting university and a private institution than females; in contrast, there does not appear to be a significant dif-ference in the earnings of non-white college graduates from public versus private institutions, while whites are penalized by the market for attending a public college or university. Additionally, non-whites from a highly or most selective institution earn a much higher premium than their white counterparts.
The remainder of the article is divided into four main topics. The next section outlines the sample chosen and constructed for this study. This is followed by a descrip-tion of the underlying economic model and econometric methodology used to estimate the earnings across college characteristics. The next section presents the results of the regression analyses, and the final section summarizes these results.
2. Data
This study utilizes the National Longitudinal Survey of Youth. The NLSY is a survey of individuals from 1979 to 1996.1 The respondents were aged between 14
and 22 at the beginning of the survey, in 1979, and aged between 28 and 36 in 1993. This data set is particularly useful for this study since it tracks college-aged individ-uals through their college years and into their early labor market experiences.
This paper exploits the Federal Interagency Commit-tee on Education (FICE) codes reported by NLSY
1At the initial time of this study, the 1994 and 1996 survey responses were not available. As a result, this study only uses the annual NLSY data from 1979 to 1993.
respondents for each spell of college attendance. Begin-ning in 1984, the NLSY asked each respondent who reported attending a college or university the name of the three most recent colleges attended and the dates they attended each institution. These responses were then recorded using the college or university’s FICE code. Additionally, each respondent was asked their highest degree received and the date they received this degree. By matching the date they received their baccalaureate degree to the college spell information I was able, in most cases, to determine the FICE code of the respon-dent’s baccalaureate degree granting institution.
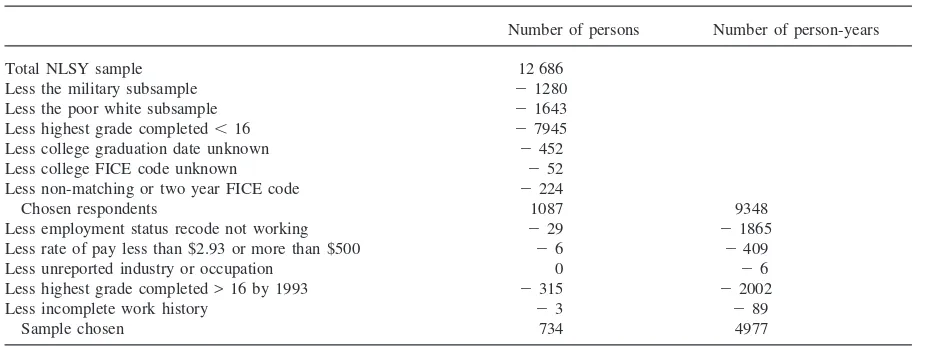
Respondents from the military and disadvantaged white subsample were excluded from the sample used in this study (Table 1). Those respondents who had not completed 16 years of schooling by 1993, the survey’s end at the time of writing, were also excluded from the sample. In some cases (452 respondents) the date that the respondent received his baccalaureate degree could not be determined either because it was simply not reported or because by the 1988 survey, when the NLSY first asked the respondent’s highest degree ever received, the respondent had earned a masters degree or higher so the date of the baccalaureate degree was never reported. For 52 of the respondents, the NLSY staff could not find a FICE code to coincide with the reported college or university. An additional 224 individuals were excluded from the sample because their reported FICE code could not accurately be matched to the data sets discussed below to extract the institutional characteristics.
pref-Table 1
Sample construction
Number of persons Number of person-years
Total NLSY sample 12 686
Less the military subsample 21280
Less the poor white subsample 21643
Less highest grade completed,16 27945
Less college graduation date unknown 2452
Less college FICE code unknown 252
Less non-matching or two year FICE code 2224
Chosen respondents 1087 9348
Less employment status recode not working 229 21865
Less rate of pay less than $2.93 or more than $500 26 2409
Less unreported industry or occupation 0 26
Less highest grade completed > 16 by 1993 2315 22002
Less incomplete work history 23 289
Sample chosen 734 4977
erable to a linear measure in estimating the returns to education (Kingston & Smart, 1990). In some of the cases, the reported FICE code could not be matched to the CASPAR database or to the Barron’s Profile because the reported college was a single university branch and the NSF or Barron’s reporting unit was the entire univer-sity system, or vice versa. There were also observations where the reported baccalaureate granting institution was a 2-year college. The observations where these discrep-ancies occurred were excluded from the sample.
The sample resulting from the above restrictions con-tained 1087 individuals and 9348 person-year obser-vations. Only those person-year observations following the individual’s graduation from college were included in the sample. This sample was limited further to those observations where the primary activity was working; the hourly rate of pay was greater than or equal to $2.93 or less than $500; valid industry and occupation were reported; and a complete work history of experience and tenure were reported.2The sample was also restricted to
those individuals whose highest grade completed was 16 by 1993. This focuses the investigation on earnings dif-ferentials among working college graduates who do not continue their education (by 1993) and does not address possible returns to college characteristics that may arise due to increases in the probability of achieving a gradu-ate degree or to possible increases in employment prob-abilities. The chosen sample has 734 individuals, 407 colleges and universities, and 4977 person-year obser-vations.
The NLSY has a lower rate of college attendance and
2All dollar values are constant dollar (CPI-U, 1983/84 5 100). $2.93 represents the 1983/84 real dollar value of the 1993 minimum wage of $4.25.
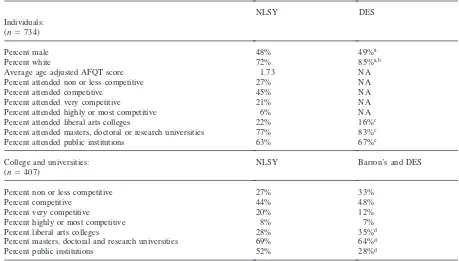
graduation than the population at large because it over-samples blacks and Hispanics who tend to have lower enrollment rates than whites. These over-represented subsamples were included in this study in order to more efficiently estimate the returns to both individual and institutional characteristics across racial groups. Because of the large number of respondents excluded from the sample, a close examination of the remaining respon-dents is warranted. Table 2 compares summary measures of the respondents and colleges from the sample chosen from the NLSY to the Digest of Education Statistics
(DES) (US Department of Education, 1984–1986) and Barron’s Profiles summary measures.
A strict comparison of the respondents from the NLSY sample to the DES is not possible because the NLSY is a sample of college graduates currently working and the DES is a survey of either current college graduates or enrollees. However, comparisons of these two groups would likely reveal any gross misrepresentation of the population of college graduates in the NLSY. The amount of males in the NLSY is 48%, in comparison to 49% in the DES.3The NLSY does have a much lower
percentage of white college graduates, 72%, than the DES, 85%. This is likely to be attributable to the over-sampling discussed above and will be addressed in the following empirical tests. Because of the relatively small number of respondents who attended both non-competi-tive and most competinon-competi-tive institutions these categories were combined with less competitive and highly com-petitive, respectively. This increases the frequency of each cell count and improves the efficiency of the
Table 2
Comparison of NLSY toDigest of Education StatisticsandBarron’s Profiles of American Collegessummary statistics
NLSY DES
Individuals: (n5734)
Percent male 48% 49%a
Percent white 72% 85%a,b
Average age adjusted AFQT score 1.73 NA
Percent attended non or less competitive 27% NA
Percent attended competitive 45% NA
Percent attended very competitive 21% NA
Percent attended highly or most competitive 6% NA
Percent attended liberal arts colleges 22% 16%c
Percent attended masters, doctoral or research universities 77% 83%c
Percent attended public institutions 63% 67%c
College and universities: NLSY Barron’s and DES
(n5407)
Percent non or less competitive 27% 33%
Percent competitive 44% 48%
Percent very competitive 20% 12%
Percent highly or most competitive 8% 7%
Percent liberal arts colleges 28% 35%d
Percent masters, doctoral and research universities 69% 64%d
Percent public institutions 52% 28%d
aPercent of bachelor’s degrees awarded by characteristic in the 1984–1985 academic year. bPercent of bachelor’s degrees awarded to individuals who were white, non-Hispanic. cPercent of individuals enrolled in 1985 by type of institution.
dPercent of institutions by type and control from the DES, for 1985–1986.
mated returns to these categories. There appears to be sufficient variation in the percentage of individuals who attended each category of college selectivity. The sample from the NLSY seems to have a higher percentage of liberal arts college graduates, 22%, than the DES, 16%. This may be because the NLSY is composed of college graduates and the DES measures college attendees. If liberal arts colleges have higher graduation rates then we ought to expect a higher percentage of college graduates attended liberal arts colleges than are currently enrolled. Sixty-three percent of the NLSY sample attended a pub-lic institution and the DES reports a comparable 67% of enrollees at public institutions. In summary, it appears that the sample of individuals from the NLSY is compa-rable to the population of college students, with the noted exception of race.
A word of caution is necessary in comparing the NLSY sample of colleges to Barron’s and the DES. The NLSY is a number of graduates weighted sample of col-leges. The probability of observing a college is directly proportional to the number of graduates from that college relative to the population of college graduates. It is there-fore to be expected that the sample of institutions from the NLSY will favor large, public, graduate degree
grant-ing institutions relative to the cross-section of all col-leges and universities. This comparison is made simply to determine whether there is adequate variation in the number of each type of institution in the sample so that I am not inadvertently estimating returns to individual colleges rather than college characteristics. There appears to be a sufficient number of colleges in each category of selectivity, Carnegie classification and con-trol in order to draw inferences concerning earnings dif-ferentials across these characteristics.
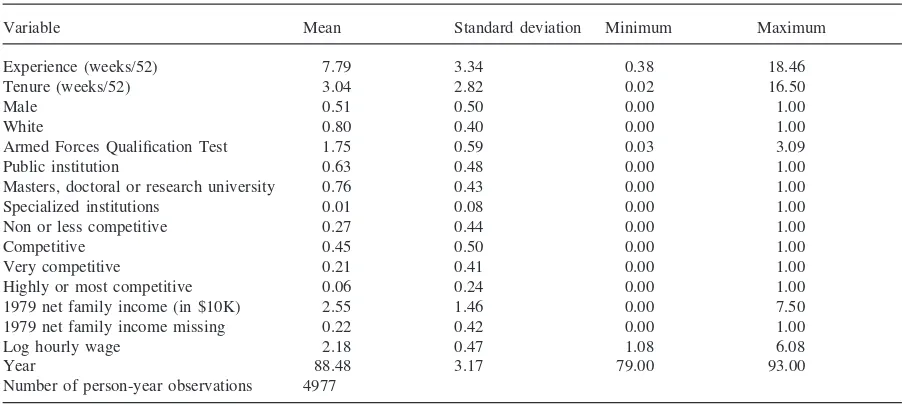
Table 3
Summary measures
Variable Mean Standard deviation Minimum Maximum
Experience (weeks/52) 7.79 3.34 0.38 18.46
Tenure (weeks/52) 3.04 2.82 0.02 16.50
Male 0.51 0.50 0.00 1.00
White 0.80 0.40 0.00 1.00
Armed Forces Qualification Test 1.75 0.59 0.03 3.09
Public institution 0.63 0.48 0.00 1.00
Masters, doctoral or research university 0.76 0.43 0.00 1.00
Specialized institutions 0.01 0.08 0.00 1.00
Non or less competitive 0.27 0.44 0.00 1.00
Competitive 0.45 0.50 0.00 1.00
Very competitive 0.21 0.41 0.00 1.00
Highly or most competitive 0.06 0.24 0.00 1.00
1979 net family income (in $10K) 2.55 1.46 0.00 7.50
1979 net family income missing 0.22 0.42 0.00 1.00
Log hourly wage 2.18 0.47 1.08 6.08
Year 88.48 3.17 79.00 93.00
Number of person-year observations 4977
because of differences in academic ability. This problem is minimized by calculating the ratio of each person’s test score to the average test score for his or her age. Finally, the 1979 net family income is used as a control for an individual’s ability to pay.4 Table 3 provides
means, standard deviations, minimums and maximums for all of the variables for the entire sample.
3. Model
This section focuses on the underlying economic model and methodology used to estimate the earnings differentials across institutional characteristics con-ditional upon individual traits and labor market experi-ences. Properly controlling for relevant individual attri-butes and a number of college characteristics enhances the understanding of variation in earnings across specific college characteristics. The process underlying the human capital investment decision to enroll in a parti-cular college is one which relates wages to human capital such as experience, tenure, and individual and insti-tutional characteristics.
Institutional characteristics may influence earnings conditional on individual characteristics for a number of reasons. First, institutions may facilitate the
accumu-4For those individuals who either did not take the ASVAB battery of tests used in the construction of the AFQT score or had missing 1979 net family income, a dummy variable indicat-ing that the variable was not reported was included among the regressors and the individual was assigned the average value for that variable from the sample used in this study.
lation of human capital at different rates. For example, if there are peer effects, then attending a selective insti-tution where one is surrounded by bright students may increase human capital accumulation. Similarly, if the instructional quality is better at private institutions, then graduates of private colleges and universities may have greater human capital. Classroom dynamics and overall curricular design may also be important in the production function of human capital. If this is true, then graduates of different types of institutions may have accumulated different levels of human capital. A second reason why institutional characteristics may influence earnings separ-ately from individual characteristics is that employers may identify institutional attributes as a signal of ability. This may especially be the case if institutional character-istics are more visible than individual ability measures. The human capital and signaling explanations for the potential importance of institutional characteristics in determining earnings are not mutually exclusive. It may be that graduates of certain types of institutions earn more because of both human capital and signaling. In either case, individuals attempting to maximize the net present value of lifetime wealth would attempt to enroll in those institutions whose graduates earn a premium.
A reduced-form equation relating the log of wages at time t, for individual i, who attended institutionj, as a function of individual and institutional characteristics is:
lnWijt5X0itb11X1ib21Qjb31di1eijt (1)
where lnWijtis the log of hourly wages;X0itare individ-ual time varying labor market experiences;Xi1are
non-time-varying individual characteristics which influence earnings;Qjare college characteristics;diis a normally distributed individual specific error component; and eijt is a normally distributed random error. Estimation of Eq. (1) will result in biased estimates of the returns to insti-tutional characteristics because it does not account for the selection process by individuals and institutions in the enrollment process.
Individuals are clearly not randomly allocated to dif-ferent institutions and institutional types. They are both chosen by the institution and choose the institution them-selves. Accounting for this selection process is at best difficult and problematic. Attempting to correct for selec-tion using various estimaselec-tion techniques relies on assumptions which may act to exacerbate the problem. For example, Brewer et al. use multinomial logit to esti-mate the institutional type chosen. This approach becomes complicated as the number of institutional characteristics are increased, and it also assumes the independence of irrelevant alternatives, which is not likely to be the case in choosing which college to attend. Additionally, the instrumental variable estimation approach followed by Behrman et al. (1996a) works well when there are few variables to instrument, but when the number of college characteristics increases this approach too becomes problematic.
Because I include a number of institutional character-istics among the regressors, I am unable to use either a multinomial logit correction or instrumental variables. As a result, I attempt to control for the college selection process in the least restrictive means possible by includ-ing among the regressors individual attributes which influence the enrollment process. Because academic ability and ability to pay are primary determinants in the college selection process, I include among the regressors of Eq. (1) one’s AFQT score and 1979 net family income. In as much as AFQT score and family income are controls which may not fully capture the endogeneity of the institutional characteristics, the resulting estimates of the coefficients on the institutional characteristics may be biased. One should not interpret the coefficients on the institutional characteristics as a true return to these characteristics in the sense of what an individual ran-domly assigned to this institution could expect to receive. Instead these coefficients reflect the average earnings of graduates from institutions of certain types, conditional upon their observable individual character-istics.
The log of hourly wages is first regressed against
experience, experience squared, tenure, tenure squared, a male dummy variable and a white dummy variable as a benchmark for the incorporation of individual academic ability measures and college characteristics. This speci-fication is then expanded to include the additional col-lege selectivity, control, classification dummies and AFQT score, and then the respondent’s 1979 net family income. All specifications are estimated using gen-eralized least squares to control for heteroskedasticity introduced to the disturbance structure from the individ-ual specific error component.
Additionally, a number of previous analyses have found significant differences across demographic groups in the returns to education (Bok & Bowen, 1998; Cohn & Addison, 1998; Cooper & Cohn, 1997; Behrman et al., 1996a; Loury & Garman, 1995; Card & Krueger, 1992). I allow for varying coefficients across demographic groups by performing separate regression analyses by race and gender. Most other studies of the returns to institutional attributes ignore possible differences across demographic groups in the impact of college character-istics on labor market outcomes. Because labor market and higher education opportunities may differ across these groups, the returns to these opportunities may dif-fer as well. If the accumulation of human capital varies across certain groups within an institution, perhaps due to peer effects or the classroom dynamics of race and gender, then the earnings of graduates of certain insti-tutional types may vary across these groups. Bok and Bowen (1998) found that black students at selective institutions “under-performed” relative to what would be predicted based on their standardized test scores.5
There-fore standardized test scores may not accurately control for systematic differences across groups of students in academic performance while in college, and the returns to institutional characteristics may vary across demo-graphic groups as a result. It may also be the case that race and gender may interact with institutional character-istics in forming a signal to employers of ability. Additionally, Kolpin and Singell (1997) show that in the presence of affirmative action, individuals from a pre-ferred group may receive different rates of return to their individual and institutional characteristics.
While a complete test of these hypotheses is beyond the scope of this study, I allow for possible variation in the returns to individual and institutional characteristics by estimating separate regressions for males and females, and whites and non-whites. Chow tests are performed to test for the existence of significant variation in the coefficients across gender and racial groups.
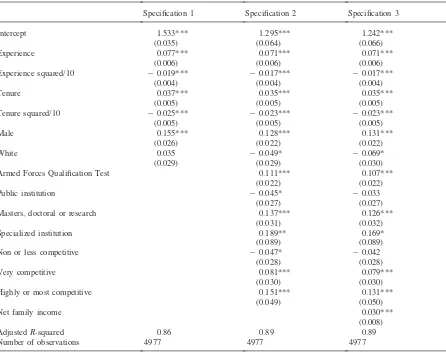
Table 4
Returns to college characteristics. Dependent variable: log hourly wages
Specification 1 Specification 2 Specification 3
Intercept 1.533*** 1.295*** 1.242***
(0.035) (0.064) (0.066)
Experience 0.077*** 0.071*** 0.071***
(0.006) (0.006) (0.006)
Experience squared/10 20.019*** 20.017*** 20.017***
(0.004) (0.004) (0.004)
Tenure 0.037*** 0.035*** 0.035***
(0.005) (0.005) (0.005)
Tenure squared/10 20.025*** 20.023*** 20.023***
(0.005) (0.005) (0.005)
Male 0.155*** 0.128*** 0.131***
(0.026) (0.022) (0.022)
White 0.035 20.049* 20.069*
(0.029) (0.029) (0.030)
Armed Forces Qualification Test 0.111*** 0.107***
(0.022) (0.022)
Public institution 20.045* 20.033
(0.027) (0.027)
Masters, doctoral or research 0.137*** 0.126***
(0.031) (0.032)
Specialized institution 0.189** 0.169*
(0.089) (0.089)
Non or less competitive 20.047* 20.042
(0.028) (0.028)
Very competitive 0.081*** 0.079***
(0.030) (0.030)
Highly or most competitive 0.151*** 0.131***
(0.049) (0.050)
Net family income 0.030***
(0.008)
AdjustedR-squared 0.86 0.89 0.89
Number of observations 4977 4977 4977
Notes: (1) Standard errors are in parentheses. (2) Specifications 2 and 3 include dummy variables for industry and occupation, and missing AFQT and net family income, not shown. (3) Significant: *** at the 1% level; ** at the 5% level; * at the 10% level.
4. Results
I begin by regressing the log of hourly wages against experience, experience squared, tenure, tenure squared, a dummy if the individual is male and a dummy if the individual is white.6 There are the usual concave
increases in log wages over experience and tenure. Males earn significantly higher earnings than females, and there appears to be no significant difference in earnings among white and non-white college graduates. These results are presented in specification 1 of Table 4.
Including AFQT scores, institutional characteristics, and industry and occupation dummies (results not shown
6White is defined here as those respondents identified as non-black, non-Hispanic; non-white is defined as those respondents identified as black or Hispanic.
for industry and occupation) among the regressors, speci-fication 2 of Table 4 does not significantly change the quadratic returns to experience and tenure, nor the male premium. The sign of the coefficient on the white dummy variable is now negative, and significantly differ-ent from zero. The omitted variable in this specification is non-white, female, competitive, private, liberal arts college graduate. There is a positive and significant return to academic ability, as measured by the age-adjusted AFQT score. Additionally, graduates from pub-licly controlled institutions earned 4.5% less than gradu-ates from privately controlled institutions.7On the other
hand, graduates from graduate degree granting research institutions earned approximately 14% more than gradu-ates from liberal arts colleges.8This result is consistent
with the findings of Dowd (1998) and Pascarella and Terenzini (1991), both of whom found significant differ-ences across college versus university graduates. Gradu-ates from specialized institutions earned approximately 19% more than liberal arts college graduates.
There is strong evidence of a positive and significant relationship between wages and college quality, as meas-ured by Barron’s selectivity measure. Even after con-ditioning on AFQT score, gender, race, experience, ten-ure, control of institution, classification of institution, and industry and occupation, graduates from more selec-tive colleges and universities earn more than graduates from less selective institutions. In particular, graduates from non or less competitive institutions earned approxi-mately 5% less than graduates from competitive insti-tutions; graduates from very competitive institutions earned 8% more; graduates from highly or most competi-tive colleges and universities earned 15% more than competitive college graduates.
Specification 3 of Table 4 includes the respondent’s 1979 net family income in order to control for differ-ences in familial resources which may influence the col-lege selection process (Loury & Garman, 1995). While net family income appears to have a positive and sig-nificant impact on log wages, its inclusion among the regressors does not significantly alter the coefficients on the other individual or institutional characteristics. Indi-viduals from more competitive institutions and larger research institutions earn significantly more than their counterparts from less selective institutions and liberal arts colleges.
A number of alternative specifications were also tested. The college selectivity dummies were interacted with experience to test for differences in the profile of earnings over time by college quality. No significant pat-tern emerged. Additionally, the AFQT score and college selectivity were interacted to see if individual academic ability and institutional quality were complements. Again, no significant pattern emerged. Finally, both the public control dummy and Carnegie classification dummies were interacted with quality, but neither proved significant.
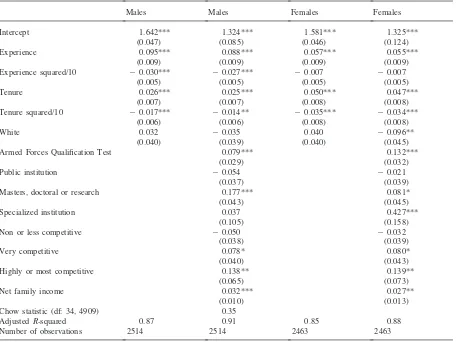
Table 5 presents the results of separate regression analyses by gender. A Chow test that the relationship between log hourly wages and the regressors is the same for males and females fails to reject the null at even the 10% significant level. While the overall returns to
insti-8Separate dummy variables for masters, doctoral and research universities were initially included, but an F-test that their coefficients were equal could not be rejected at the 5% level.
tutional characteristics are qualitatively the same for both males and females, there are some noteworthy differ-ences in the magnitude of the individual effects. Specifi-cally, female graduates of specialized institutions earn significantly more than their male counterparts. On the other hand, while both men and women graduates from graduate degree granting institutions earn more than lib-eral arts college graduates, males receive a larger pre-mium for attending graduate degree granting and research institutions than females. Females also have a higher return to AFQT score and a larger non-white pre-mium, although these differences are not significantly different from zero.
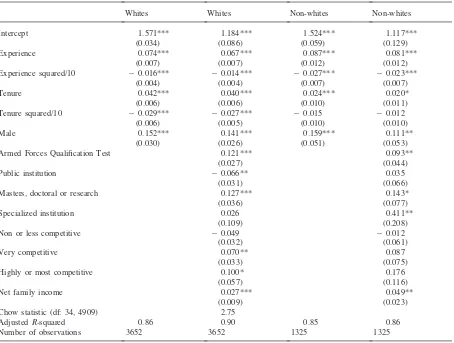
The final analysis (Table 6) examines differences in the returns to individual and institutional characteristics by race. In this case the Chow test rejects the null, at the 1% significance level, that the relationship between log hourly wages and the regressors is the same for whites and non-whites. While the coefficients on insti-tutional quality are not significantly different from zero for non-whites, the magnitude of these effects is larger. In particular, non-white graduates of highly or most com-petitive institutions earn a larger premium than whites. This result is consistent with earlier studies that explicitly examine returns to institutional quality across racial groups. For example, Behrman et al. (1996a) find greater returns to college quality among non-whites than whites, and Loury and Garman find a larger return to college selectivity among blacks than whites.
The returns to graduating from a masters, doctoral or research university are not substantially different for whites and non-whites. The returns to public institutions are different across racial groups. White graduates of publicly controlled institutions earn significantly less than white graduates of privately controlled institutions, while the earnings of non-white graduates of publicly controlled institutions are not significantly different from the earnings of non-white graduates of private insti-tutions. Additionally, non-white graduates of specialized institutions earn a premium that is not realized by white students.
Studies that fail to adequately address the sometimes substantial differences in the returns to both individual and institutional characteristics across gender and racial groups are obfuscating the true relationship between these interactions. It may be further interesting to per-form separate regression analyses within both racial and gender groups, however there were too few observations for non-white females and non-white males.
indi-Table 5
Returns to college characteristics. Dependent variable: log hourly wages
Males Males Females Females
Intercept 1.642*** 1.324*** 1.581*** 1.325***
(0.047) (0.085) (0.046) (0.124)
Experience 0.095*** 0.088*** 0.057*** 0.055***
(0.009) (0.009) (0.009) (0.009)
Experience squared/10 20.030*** 20.027*** 20.007 20.007
(0.005) (0.005) (0.005) (0.005)
Tenure 0.026*** 0.025*** 0.050*** 0.047***
(0.007) (0.007) (0.008) (0.008)
Tenure squared/10 20.017*** 20.014** 20.035*** 20.034***
(0.006) (0.006) (0.008) (0.008)
White 0.032 20.035 0.040 20.096**
(0.040) (0.039) (0.040) (0.045)
Armed Forces Qualification Test 0.079*** 0.132***
(0.029) (0.032)
Public institution 20.054 20.021
(0.037) (0.039)
Masters, doctoral or research 0.177*** 0.081*
(0.043) (0.045)
Specialized institution 0.037 0.427***
(0.105) (0.158)
Non or less competitive 20.050 20.032
(0.038) (0.039)
Very competitive 0.078* 0.080*
(0.040) (0.043)
Highly or most competitive 0.138** 0.139**
(0.065) (0.073)
Net family income 0.032*** 0.027**
(0.010) (0.013)
Chow statistic (df: 34, 4909) 0.35
AdjustedR-squared 0.87 0.91 0.85 0.88
Number of observations 2514 2514 2463 2463
Notes: (1) Standard errors are in parentheses. (2) The second specifications for both males and females include dummy variables for industry and occupation, and missing AFQT and net family income, not shown. (3) Significant: *** at the 1% level; ** at the 5% level; * at the 10% level.
vidual and institutional characteristics in signaling ability.
The higher returns to quality realized by non-white graduates found in this study appear consistent with a model of affirmative action in hiring developed by Kol-pin and Singell (1997), where individuals from a pre-ferred group earn a premium not realized by other indi-viduals with comparable institutional affiliations. If this is indeed the case, then minorities have an added incen-tive to gain admission to highly selecincen-tive institutions. Furthermore, recent judicial and policy decisions restricting consideration of an applicant’s race in admis-sions are likely to reduce the number of minority gradu-ates from top institutions, and may further raise the earn-ings premium for minority graduates from highly selective institutions. Clearly, additional analyses designed to explicitly explore the underlying causes of the differences across demographic groups in the returns
to institutional quality found in this and other studies is warranted.
5. Conclusion
Table 6
Returns to college characteristics. Dependent variable: log hourly wages
Whites Whites Non-whites Non-whites
Intercept 1.571*** 1.184*** 1.524*** 1.117***
(0.034) (0.086) (0.059) (0.129)
Experience 0.074*** 0.067*** 0.087*** 0.081***
(0.007) (0.007) (0.012) (0.012)
Experience squared/10 20.016*** 20.014*** 20.027*** 20.023***
(0.004) (0.004) (0.007) (0.007)
Tenure 0.042*** 0.040*** 0.024*** 0.020*
(0.006) (0.006) (0.010) (0.011)
Tenure squared/10 20.029*** 20.027*** 20.015 20.012
(0.006) (0.005) (0.010) (0.010)
Male 0.152*** 0.141*** 0.159*** 0.111**
(0.030) (0.026) (0.051) (0.053)
Armed Forces Qualification Test 0.121*** 0.093**
(0.027) (0.044)
Public institution 20.066** 0.035
(0.031) (0.066)
Masters, doctoral or research 0.127*** 0.143*
(0.036) (0.077)
Specialized institution 0.026 0.411**
(0.109) (0.208)
Non or less competitive 20.049 20.012
(0.032) (0.061)
Very competitive 0.070** 0.087
(0.033) (0.075)
Highly or most competitive 0.100* 0.176
(0.057) (0.116)
Net family income 0.027*** 0.049**
(0.009) (0.023)
Chow statistic (df: 34, 4909) 2.75
AdjustedR-squared 0.86 0.90 0.85 0.86
Number of observations 3652 3652 1325 1325
Notes: (1) Standard errors are in parentheses. (2) The second specifications for both whites and non-whites include dummy variables for industry and occupation, and missing AFQT and net family income, not shown. (3) *** significant at the 1% level; ** at the 5% level; * at the 10% level.
I find significant returns to college quality. Addition-ally, there appears to be a premium for graduating from a graduate degree granting or research institution relative to graduating from a liberal arts college. There is weak evidence that alumni/ae from private institutions earn more than graduates from publicly controlled insti-tutions. These results, however, vary across race and gender.
These results reveal the importance of controlling for a broader range of institutional attributes in estimating the impact of college characteristics on earnings and in more closely examining heterogeneity in the returns to college experiences across racial and gender groups. The underlying causes of these differences across demo-graphic groups are still unknown. Similarly, there remains much work to be done in uncovering the reasons for the college characteristic premiums discussed above. For example, it is still unknown whether the wage
pre-miums earned by more selective, private, university stu-dents are due to greater human capital accumulation, sig-naling of higher ability, or both.
References
Anon (1987).Barron’s profiles of American colleges. Wood-bury, NY: Barron’s Educational Series, Inc.
Behrman, J. R., Constantine, J., Kletzer, L., McPherson, M., & Schapiro, M. O. (1996a). Impact of college quality choices on wages: are there differences among demographic groups? Mimeo, Williams Project on the Economics of Higher Edu-cation.
Behrman, J. R., Rosenzweig, M. R., & Taubman, P. (1996). College choice and wages: estimates using data on female twins.Review of Economics and Statistics,78(4), 672–685. Bok, D., & Bowen, W. (1998).The shape of the river.
Brewer, D. J., & Ehrenberg, R. G. (1996). Does it pay to attend an elite private college? Evidence from the senior high school class of 1980. Research in Labor Economics, 15, 239–271.
Brewer, D. J., Eide, E., & Ehrenberg, R. G. (1996). Does it pay to attend an elite private college? Cross cohort evidence on the effects of college quality on earnings. Working Paper No. 5613, Cambridge, MA: National Bureau of Economic Research.
Card, D., & Krueger, A. B. (1992). School quality and black– white relative earnings: a direct assessment.Quarterly Jour-nal of Economics,107, 151–200.
Cohn, E., & Addison, J. T. (1998). The economic returns to lifelong learning in OECD countries.Education Economics,
6(3), 253–307.
Cooper, S. T., & Cohn, E. (1997). Internal rates of return to college education in the United States by sex and race. Jour-nal of Education Finance Summer,23, 101–133.
Daniel, K., Black, D., & Smith, J. (1995). College quality and the wages of young men. University of Pennsylvania, mimeo.
Davies, S., & Guppy, N. (1997). Fields of study, college selec-tivity, and student inequalities in higher education. Social Forces,75(4), 1417–1438.
Dowd, A. C. (1998). Returns to field of study and institutional type among elite college graduates. Cornell University, mimeo.
Fox, M. (1993). Is it a good investment to attend an elite private college?Economics of Education Review,12(2), 137–151. James, E., & Alsalam, N. (1993). College choice, academic
achievement and future earnings. In E. P. Hoffman,Essays on the economics of education. Kalamazoo, MI: W. E. Upjohn Institute for Employment Research.
James, E., Alsalam, N., Conaty, J. C., & To, D. (1989). College quality and future earnings: where should you send your child to college? American Economic Association Papers and Proceedings, May 1989, 247–252.
Kingston, P., & Smart, J. (1990). The economic payoff to pres-tigious colleges. In P. Kingston, & L. S. Lewis,The high-status track: studies of elite private schools and stratifi-cation. Albany, NY: State University of New York Press. Kolpin, V., & Singell, L. D. (1997). Asymmetric information,
strategic behavior and discrimination in the labor market.
Economic Theory,12, 175–184.
Litten, L. H., & Smith, C. E. (1993). Variations in short-term incomes among graduates of selective colleges and univer-sities. Consortium on Financing Higher Education, mimeo. Loury, L. D., & Garman, D. (1995). College selectivity and
earnings.Journal of Labor Economics,13(2), 289–308. McPherson, M. S., & Schapiro, M. O. (1991).Keeping college
affordable. Washington, DC: Brookings Institution. Pascarella, E. T., & Terenzini, P. T. (1991).How college affects
students: findings and insights from twenty years of research. San Francisco: Jossey-Bass Publishers.
Rumberger, R. W., & Thomas, S. L. (1993). The economic returns to college major, quality, and performance: a multi-level analysis of recent graduates.Economics of Education Review,12(1), 1–19.