MULTIVARIATE ANALYSIS ON PHENOTYPIC TRAITS
OF BODY MEASUREMENT IN SWAMP BUFFALO (
Bubalus bubalis
)
S. Johari, E. Kurnianto, Sutopo dan W.A. Hamayanti Faculty of Animal Agriculture, Diponegoro University Tembalang Campus, Semarang 50275, Central Java – Indonesia
Corresponding E-mail: [email protected]
Received October 19, 2009; Accepted November 24, 2009
ABSTRACT
The objective of this research was to study the relationship between body measurement and body weight and closeness among swamp buffalo at three populations in Central Java. The 110 heads of swamp buffalo measured were from 29 heads of Pati district, 56 heads of Kudus district, and 25 heads of Semarang city. Age of buffaloes used was 1-5 years old. The quantitative traits measured were body weight ( BW), body length (BL), shoulder height (SH), pelvic height (PH), chest depth (CD), chest circumference (CC), chest width (CW), Pelvic width (PW), and waist width (WW). The data was analyzed by using multivariate procedure of SAS ver 6. The results showed that best equation to estimate BW for male buffalo was Y= - 601,8 + 2,3 BL + 3,4 CD + 2,4 CC, while that for female was Y = - 644,5 + 2,8 BL + 1,6 CD + 2,9 CC. Swamp buffalo in Semarang-Pati showed the closer relationships compared to the Pati-Kudus Districts and to Kudus District-Semarang City.
Keywords: quantitative traits, genetic distance, swamp buffalo
INTRODUCTION
Buffaloes are classified into the phylum of Chordata, class of mammals, the order of Ungulata, family of Bovidae, Subfamily of bovine, genus of Bubalus, and species of bubalis. Buffaloes (Bubalus bubalis) allegedly evolved from Bubalus Arnee, a wild buffalo of India existing in Assam district. Buffalo is classified into river buffalo and swamp buffalo (Wiryosuhanto et al., 1980, Hedges, 1996). There are established feral populations in northern Australia, and wild populations in much of Southeast Asia. All its domestic varieties and breeds descend from one common ancestor, the wild Asian water buffalo, which is now an endangered species. It was stated by Siregar and Talib (1991) that 42% of the world's buffalo population are swamp buffalo, while others are river buffalo originating from India and Pakistan. According to Murti and Ciptadi (1986), the buffalo is native of hot-humid region. Buffalo has a considerable variation in body weight and skin color, so that the buffalo is known by various local names such as Java, Aceh, Toraja, Kalang and Moa bufalloes. It was estimated that the buffalo population is not increase because of high inbreeding coefficient and lack of government attention to improve the buffalo production.
It was stated by Bhattacharya (1993) that swamp buffalo of South Asia is easier met in the State of Vietnam, Laos, Cambodia, Thailand, Malaysia and Indonesia. Characteristics of swamp buffalo is as follows: short and stout body, large chest circumference, rounded performance, short and straight legs, the mature weight is 500 kg and 400 kg at male and female respectively, males withers high is 135 cm and 130 cm at male and female respectively, wide and semi-circular horn, bluish skin color to dark gray color.
Soeroso (2004) conducted an analysis on relationship between a body measurement and body weight in Java cattle. The high correlation between body measurements and body weight indicated that any body measurement could be used as an estimator of body weight.
The objective of the research was to study
City (25 heads) Central Java were used as materials. Method used to determine the location and the number of animal was the purposive random sampling. Buffalo measured was 1-5 years old, in which determined by tooth condition. Parameter determined in this study was body weight and body measurements. Body weight of all animals was weighted in the morning before the cattle were fed (kg). Body measurements were measured in cm scale according to Hardjosubroto and Astuti (1993), as follows: body length (BL), shoulder height (SH), pelvic height (PH), chest depth (CD), chest circumference (CC), chest width (CW), Pelvic width (PW), and waist width (WW). determine the effect of location, sex and age on quantitative trait measurements (SAS, 1990).
3. The "proc. stepwise" was used to determine the relationship between body measurement and body weight (SAS, 1990).
4. Principal Component Analysis (PCA) was used to examine a quantitative trait having large affect for variation of population (SAS, 1990). 5. Canonical Discriminant Analysis was used to
determine genetic distance among three measurement and body weight, and among body measurements both in male and female is presented in Table 1. It can be seen that there was tendency of close relationships between body determined by cell enlargement and growth rate of different body components.
The body size and shape is depending on the body's bone structure and some tissue changes. The slightest increasing of body size will lead to a proportional increasing in body weight, because body weight is the function of volume as stated by Williams and Ricketts (1982) that growth was size changes of an animal which can be long, volume or mass.
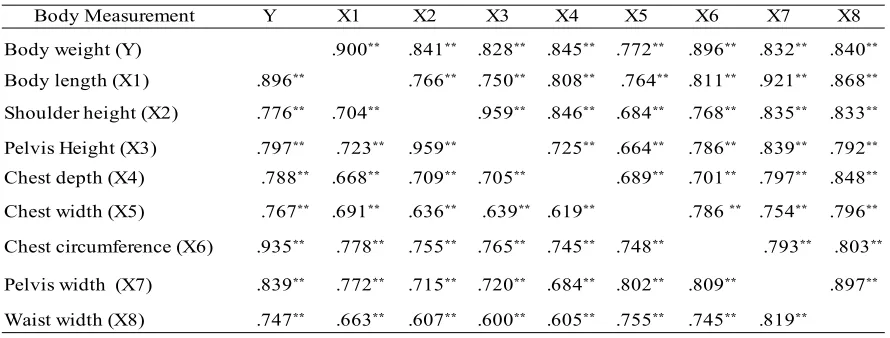
Based on the results of correlation analysis (Table 1), body size had the high correlation to body weight. In female, the highest correlation was shown by the chest circumference (r = 0, 935), while the male is the body length (r = 0,900) and by the chest circumference (r = 0, 896). It
Table 1. Coefficient of Correlation among Body Measurements
Body Measurement Y X1 X2 X3 X4 X5 X6 X7 X8
Females (n = 80) below the diagonal and males (n = 30) upper the diagonal.
.900** .841** .828** .845** .772** .896** .832** .840**
was stated by Kavazis and Ott (2003) that body sizes having highest correlation with body weight was the chest circumference and the body length. This result indicated that there was difference in correlation between male and female.
Body measurements in this study indicated a high correlation to body weight (r> 0.6). This suggested that body measurement can be used to predict body weight. As stated by Soeroso (2004) that a high correlation between body weight with each body measurement gave an indication that body size can be used as a predictor of body weight. Using body weight will be easier to predict weight loss without using weights, so it is more practical.
To make the best regression model can be
used as a predictor of body weight in swamp buffalo, the body measurements were analyzed using the proc. stepwise. In this method, the entire body size included in the equation. Body measurements were used as predictor variables, whereas body weight as the response variable. The result of the analysis is presented in Table 2 and Table 3 for male and female, respectively. Based on the result shown in Table 2 and Table 3, the best regression model both for male and female were equation 3. For male, the best regression model was Y = -601.8 + 2.3 BL + 3.4 CD+ 2.4 CC, meanwhile for females was Y = -644.5 + 2.8 BL + 1.6 CD + 2.9 CC. It was stated by Kavazis and Ott (2003) and Atta and Khidir (2004) that the use of length, height and
Table 2. Regression Equation between Body Measurement and Body Weight of Male Buffalo
Equation Regression Equation MSE
1 0,81 1481,6
2 0,89 879,7
3 0,91 685,6
4 0,92 643,6
5 0,94 493,1
6 0,95 454,4
7 0,95 470,3
8 0,95 475,2
R2
Y=-472,8 + 6,7X1
Y=-585,5 + 3,8X1 + 2,7X6
Y=-601,8 + 2,3X1 + 3,4X4 + 2,4X6*)
Y=-681,1 + 3,6X1 + 3,8X4 + 2,6X6 – 3,2X7
Y=-920,8 + 4,5X1 + 3,2X3 + 3,3X4 + 2X6 – 6,5X7
Y=-929,2 + 4,3X1 – 5,1X2 + 7,6X3 + 5,6X4 + 1,9X6 – 6,9X7
Y=-936,7 + 4,5X1 – 5,1X2 + 7,6X3 + 5,5X4 + 1,7X6 – 7,3X7 + 2,1X8
Y=-977,4 + 4,7X1 – 4,8X2 + 7,3X3 + 5,8X4 + 1,7X6 – 6,8X8 – 2X8 + 4,9X9
Y = BW (Body weight), X1 = BL (Body length) , X2 = SH (Shoulder Height), X3 = HP (Pelvis Height); X4 = CD (Chest Depth), X5 = CW (Chest Width), X6 = CC (Chest Circumference), , X7 = PW (Pelvis width);
X8= WW (Waist width), MSE= Mean Square Error, and R2= Coefficient of Determination
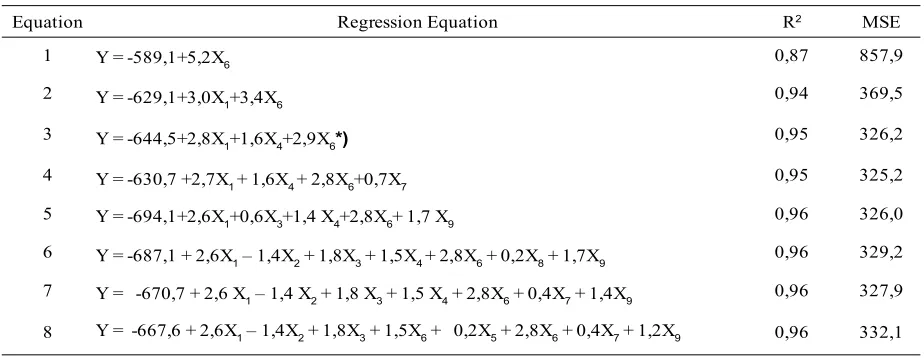
Table 3. Regression Equation between Body Measurement and Body Weight of Female Buffalo
Equation Regression Equation MSE
1 0,87 857,9
2 0,94 369,5
3 0,95 326,2
4 0,95 325,2
5 0,96 326,0
6 0,96 329,2
7 0,96 327,9
8 0,96 332,1
R2
Y = -589,1+5,2X6
Y = -629,1+3,0X1+3,4X6
Y = -644,5+2,8X1+1,6X4+2,9X6*)
Y = -630,7 +2,7X1 + 1,6X4 + 2,8X6+0,7X7
Y = -694,1+2,6X1+0,6X3+1,4 X4+2,8X6+ 1,7 X9
Y = -687,1 + 2,6X1 – 1,4X2 + 1,8X3 + 1,5X4 + 2,8X6 + 0,2X8 + 1,7X9
Y = -670,7 + 2,6 X1 – 1,4 X2 + 1,8 X3 + 1,5 X4 + 2,8X6 + 0,4X7 + 1,4X9
circumference to predict body weight would be more accurate compared to use of single measurement.
Principal Component Analysis
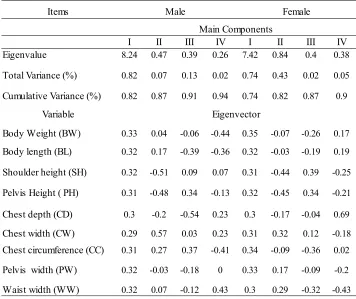
According to Soeroso (2004), in order to obtain the information on variation of quantitative trait and to know a certain trait having strong effect on variation, all body measurements were analysis by Principle Component Analysis (PCA). The result of analysis for buffalo at three populations is presented in Table 4.
The main component is a linear combination
of variables observed that used to simplify original variable to become a new variable. The new variable can still explain most of the original data information. The results of the analysis consist of eigenvalue and eigenvector. The eigenvalue is variance of linear combination describing the variance of original variable. Meanwhile, eigenvector is the coefficient to construct a weighting score of main component. Of all components is chosen a few of which have a high variation (Gaspersz, 1991).
It can be seen in Table 4, the body measurement that the highest weighting score in male was BW, followed by BL, SH, PW, WW, PC, CC, CD, and CW. Meanwhile, in females, the highest score was BW, subsequently followed by CC, and PW, BL, PH, CW. SH, CD, WW and CW.
Both in male and female, body weight had the highest weighting score. In breeding program, the main component is used for selection indicator (Soeroso, 2004). Moreover, coefficient of the first principal component is positive and similar in value, in which it is the average of all variable.
Grouping Analysis
Grouping among swamp buffalo populations was aimed to study the relationships between groups, in which it was based on the discriminant function analysis and canonical correlation analysis of body measurements. Table 5 presents average of canonical variable among three locations. It can be seen in Table 5 that canonical 1 in Semarang City was higher compared to others. This was possible because of genetic
Items Male Female
Main Components
I II III IV I II III IV
Eigenvalue 8.24 0.47 0.39 0.26 7.42 0.84 0.4 0.38
Total Variance (%) 0.82 0.07 0.13 0.02 0.74 0.43 0.02 0.05
Cumulative Variance (%) 0.82 0.87 0.91 0.94 0.74 0.82 0.87 0.9
Variable
Body Weight (BW) 0.33 0.04 -0.06 -0.44 0.35 -0.07 -0.26 0.17
Body length (BL) 0.32 0.17 -0.39 -0.36 0.32 -0.03 -0.19 0.19
Shoulder height (SH) 0.32 -0.51 0.09 0.07 0.31 -0.44 0.39 -0.25
Pelvis Height ( PH) 0.31 -0.48 0.34 -0.13 0.32 -0.45 0.34 -0.21
Chest depth (CD) 0.3 -0.2 -0.54 0.23 0.3 -0.17 -0.04 0.69
Chest width (CW) 0.29 0.57 0.03 0.23 0.31 0.32 0.12 -0.18
Chest circumference (CC) 0.31 0.27 0.37 -0.41 0.34 -0.09 -0.36 0.02
Pelvis width (PW) 0.32 -0.03 -0.18 0 0.33 0.17 -0.09 -0.2
Waist width (WW) 0.32 0.07 -0.12 0.43 0.3 0.29 -0.32 -0.43
Table 4. Eigenvalue and Eigenvector Body Weight and Body Measurements
factor. Furthermore, it was important to analysis the significance of the genetic closeness among populations.
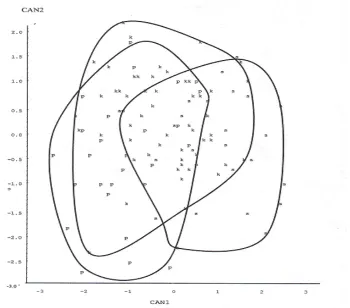
Canonical structural differences between
locations can be seen through the plot of canonical 1 and 2 that is presented in Figure 1. Most of buffaloes in three locations showed similar position according to canonical structure. This was due to the genetic relationship among buffaloes originating from the breeding process for a long time ago. Besides, in fact there is free migration from a area to other one, in which this causes random mating among animals. It was stated by Mukherjee et al. (1991) that genetic
relationship of buffalo in Southeast Asia showed no significant difference.
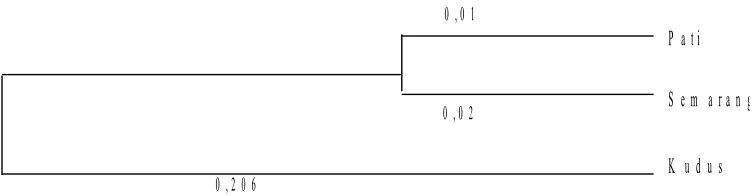
Genetic Distance
Genetic distance is analyzed based on discriminant analysis with Mahalanobis statistical value. This value describes the of Mahalanobis squared distances between groups of buffalo. Result of analysis is presented Figure 2. It can be seen that the genetic distance between swamp buffalo of Semarang-Pati was closer than the Pati-Kudus (0.206) and Pati-Kudus-Semarang (0.02)
CONCLUSION
Both in male and female buffaloes, body weight could be estimated by body length, chest depth and chest circumference measurements. The genetic distance between swamp-buffalo of Pati District-Semarang City was closer compared to Pati-Kudus Districts (0.206) and Kudus District-Semarang City (0.02).
Table 5. Average of Canonical Variable
Location Canonical 1 Canonical 2
-879 -414
-117 331
Semarang 1282 -261
Pati
Kudus
REFERENCE
Atta, M. and O.A.E. El Khidir. 2004. Use of heart girth, wither height and scapuloishial length for prediction of live weight of Nilotic sheep. Small Ruminant Research. 55: 233-237. Bhattacharya, R. 1993. Kerbau. In: Pengantar
Peternakan di Daerah Tropis (Williamson, W.G.A dan W.J.A Payne). Gadjah Mada University Press. Yogyakarta.
Gaspersz, V. 1991. Teknik Analisis dalam Penelitian Percobaan. Tarsito. Bandung. Hedges, S. 1996. Bubalus bubalis. In: IUCN
2007. IUCN Red List of Threatened Species. Gland, Switzerland
Kamalzadeh. A, W.J. Koops and J. van Bruchem. 1998. Feed quality restriction and compensatory growth in growing sheep: Modeling changes in body dimensions. Livestock Prod. Sci.. 53:57-67.
Kavazis, A.N and E.A. Ott. 2003. Growth rates in thoroughbred horses raised in Florida. J. Equine Vet. Sci. 23(8): 353-357.
Murti, T.W. dan G. Ciptadi. 1986. Kerbau Perah dan Kerbau Kerja: Tatalaksana dan Pengetahuan Dasar Pasca Panen. Ed.1, Cetakan 1. Mediyatama Sarana Perkasa.
Yogyakarta
SAS Institute Inc. 1990. SAS/STAT User’s Guide Version 6. Fourth edition. Volume 2. SAS Campus Drive. Cary. North Carolina 27513. Siregar, A. R. dan C. Talib. 1991. Menggali
Potensi dan Pengembangan Kerbau di Indonesia. Prosiding Seminar Nasional Usaha Peningkatan Produktivitas Peternakan dan Perikanan. Fakultas Peternakan Universitas Diponegoro. Semarang. Hal.77-83.
Soeroso. 2004. Performans Sapi Jawa Berdasarkan Sifat Kuantitatif dan Kualitatif. Thesis. Magister Ilmu Ternak. Universitas Diponegoro. Semarang.
Suparyanto, A., T Purwadaria dan Subandriyo. 1999. Pendugaan jarak genetik dan faktor peubah pembeda bangsa dan kelompok domba di Indonesia melalui pendekatan analisis morfologi. J.Ilmu Ternak dan Veteriner. 4 (2) : 80-87.
Wiryosuhanto, S. D., Purwandariyanto dan W. Ediyati. 1980. Peternakan Kerbau di Indonesia. Deptan. Jakarta.
Hardjosubroto, W. dan J.M. Astuti. 1993. Buku Pintar Peternakan. Grasindo (Gramedia Widiasarana Indonesia), Jakarta.
Figure 2. Swamp Buffalo Phylogeny Based on the Quantitative Traits P a t i
S e m a r a n g
K u d u s
0 , 2 0 6
0 , 0 1