Genetic diversity analysis of the thyroglobulin gene promoter
in buffalo and other bovines
P.K. Dubey
a,b, S. Goyal
a, A.K. Yadav
a, B.R. Sahoo
c, N. Kumari
a, S.K. Mishra
a,
S.K. Niranjan
a, R. Arora
a, M. Mukesh
a, R.S. Kataria
a,n aNational Bureau of Animal Genetic Resources, GT Road By-Pass, Karnal-132001, Haryana, India bImmune Regulation, WPI-IFREC, Osaka University, Osaka, JapancLaboratory of Molecular Biophysics, Institute of Protein Research, Osaka University, Osaka Prefecture 5650871, Japan
a r t i c l e
i n f o
Article history: Received 22 June 2013 Received in revised form 4 June 2014
Accepted 6 June 2014
Keywords: Bovines Thyroglobulin Polymorphism Promoter PsuI genotypes
Transcription factors binding sites
a b s t r a c t
In total 937 bp of the thyroglobulin (TG) gene, including promoter, exon1 and partial intron1 were characterized and compared across four livestock species, cattle, buffalo, yak and mithun. Identity was more than 98% and transcription factor binding sites analysis revealed the presence of variable numbers of potential binding sites in cattle, riverine buffalo, swamp buffalo, yak and mithun. The putative TTF-1 binding sites appeared to be conserved across all the investigated species except for a single C4T variation observed in TGpromoter of Indicus cattle. A total of 15 polymorphic sites were observed in cattle and 8 in buffalo, out of which 2 were already reported in cattle and 4 polymorphic sites were common among cattle and buffaloes. The Principal component analysis results based on identified SNPs, revealed a close relationship between Crossbred and Indian Tharparkar breed of cattle as well as between Murrah and Banni breeds of buffalo. Analysis of the previously reported SNP,PsuI (g.422C4T) marker (378C4T in our studies), associated
with low marbling trait of meat in cattle, revealed an average frequency of 95% for the favourable C allele in Indian cattle, while it was fixed in the Indian swamp and riverine buffalo breeds. The study indicates, identification of genetic variation in the promoter region that could potentially affect theTG expression however, the association of the T allele with the fat deposition in Indian cattle and buffalo breeds needs to be verified.
&2014 Elsevier B.V. All rights reserved.
1. Introduction
Buffalo and cattle are important livestock species which play an important role in milk and meat production in India. The Indian buffaloes comprise 56.7% of the world buffalo population, whereas the cattle population is 199.1
million, ranking second (15%) in the world (http://www. buffalopedia.cirb.res.in/). Combined cattle and buffalo con-tribute 90% percent to the total milk production in India and 60% to the meat production (http://www.fao.org/ docrep/ARTICLE/AGRIPPA/665_en-01.htm). India ranks fourth in the world in the export of buffalo meat, which is about 2.15 million tons annually (http://en.mercopress. com/2012). The share of Indian meat exports in the world market is less than 2%. However, there is potential for augmentation, as this sector is largely unexploited.
Fat percentage is an important parameter for assessing the quality of milk and meat and it varies across species as Contents lists available atScienceDirect
journal homepage:www.elsevier.com/locate/livsci
Livestock Science
http://dx.doi.org/10.1016/j.livsci.2014.06.007 1871-1413/&2014 Elsevier B.V. All rights reserved.
n
Correspondence to: Division of Animal Biotechnology, National Bureau of Animal Genetic Resources, PO Box 129, GT Road By-Pass, Karnal-132001, Haryana, India. Tel.:þ91 184 2267918;
fax:þ91 184 2267654.
well as across breeds within a species (Smet, 2012). Marbling and tenderness are two important traits of beef industry, which increase the carcass value by increasing its intramuscular fat, juiciness and flavor (Killinger et al., 2004). This diversity in fat percentage across species and breeds may be due to variations in the nucleotide sequence of the genes associated with fat metabolism. A QTL has been identified in the centromeric region of bovine chromosome 14 (BTA14), associated with the fat deposition in several cattle breeds (Casas et al., 2000; Moore et al., 2003). Genes lying in this region include Diacylglycerol-O-acyltransferase (DGAT1), thyroglobulin (TG) and adipose fatty acid binding protein (FABP4), that have been associated with fat percentage in both beef and dairy cattle (Barendse, 1999;Michal et al., 2006).
Thyroglobulin, is a glycoprotein hormone stored in the thyroid gland, that is synthesized in thyroid follicular cells and is a precursor of triiodothyronine (T3) and thyroxine (T4), playing an important role in regulating the metabo-lism and can affect adipocyte growth, differentiation and homeostasis of fat depots (Darimont et al., 1993). Poly-morphism inTGhas been associated with back fat thick-ness and marbling in beef cattle as well as milk traits in dairy cattle (Eenennaam et al., 2007; Hou et al., 2011). Subcutaneous fat thickness and fat percentage of tissues in general, including milk, are probably influenced by TG
polymorphism as thyroid hormone levels influence milk fat percentage (Folley and Malpress, 1948). Diagnostic kits for testing TG polymorphisms associated with marbling and fat deposition are commercially available in cattle (GeneSTAR;Barendse, 1999;Barendse et al., 2004;Rincker et al., 2006).
The TG promoter region has been sequenced and characterized in several species including human
(Christophe et al., 1985), bovine (Martynoff et al., 1987), canine (Donda et al., 1991), feline (Blackwood et al., 2001) and rat (Musti et al., 1987). Further, there are three thyroid transcription factor (TTF-1) binding regions A–C close to CAP site in the promoter region and any mutation in these sites might affect the expression of theTGgene (Javaux et al., 1992). The polymorphism g.-422C4T-(PsuI-RFLP) inTG promoter region has been associated with higher marbling scores in cattle with the homozygous T allele being favorable (Barendse, 1999; Thaller et al., 2003). This genetic variation occurring in the promoter region of the
TGgene has been widely used in marker assisted selection programs to improve the predictability of marbling level and juiciness in beef cattle through a commercial DNA test. Information regarding the existence of similar/novel poly-morphism in TG promoter region of Indian cattle and buffalo is completely lacking. Although milk fat percentage varies greatly between cattle and buffalo, significant var-iations have also been reported within species. Contrast-ingly, buffalo meat is reported to have less intra muscular fat with 1–2% marbling as compared to 3–4% in beef (Kandeepan et al., 2009) and is considered healthier. Hence, identification and validation of genetic variation for marbling in cattle and buffalo will assist in selective breeding to meet consumer demands of meat quality. The present study therefore was taken up to explore the diversity among the buffalo and other bovine species, known to be associated with marbling and tenderness, in the promoter region of theTGgene.
2. Material and methods
Three DNA samples each from riverine buffalo (Bubalus bubalis), swamp buffalo (Bubalus bubalis carabanesis), cattle
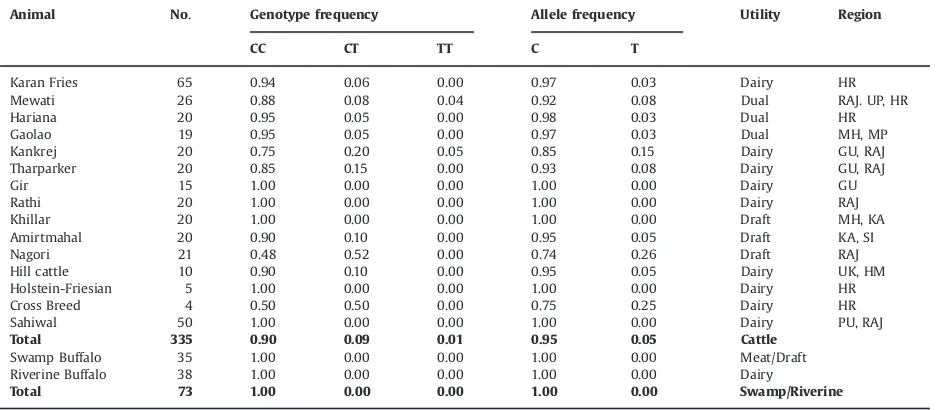
Table 1
Genotype and allelic frequencies of PsuI genotype of thyroglobulin gene across different Indian cattle (Bos taurusandBos indicus) and buffalo (riverine and swamp) populations.
Animal No. Genotype frequency Allele frequency Utility Region
CC CT TT C T
Karan Fries 65 0.94 0.06 0.00 0.97 0.03 Dairy HR
Mewati 26 0.88 0.08 0.04 0.92 0.08 Dual RAJ. UP, HR
Hariana 20 0.95 0.05 0.00 0.98 0.03 Dual HR
Gaolao 19 0.95 0.05 0.00 0.97 0.03 Dual MH, MP
Kankrej 20 0.75 0.20 0.05 0.85 0.15 Dairy GU, RAJ
Tharparker 20 0.85 0.15 0.00 0.93 0.08 Dairy GU, RAJ
Gir 15 1.00 0.00 0.00 1.00 0.00 Dairy GU
Rathi 20 1.00 0.00 0.00 1.00 0.00 Dairy RAJ
Khillar 20 1.00 0.00 0.00 1.00 0.00 Draft MH, KA
Amirtmahal 20 0.90 0.10 0.00 0.95 0.05 Draft KA, SI
Nagori 21 0.48 0.52 0.00 0.74 0.26 Draft RAJ
Hill cattle 10 0.90 0.10 0.00 0.95 0.05 Dairy UK, HM
Holstein-Friesian 5 1.00 0.00 0.00 1.00 0.00 Dairy HR
Cross Breed 4 0.50 0.50 0.00 0.75 0.25 Dairy HR
Sahiwal 50 1.00 0.00 0.00 1.00 0.00 Dairy PU, RAJ
Total 335 0.90 0.09 0.01 0.95 0.05 Cattle
Swamp Buffalo 35 1.00 0.00 0.00 1.00 0.00 Meat/Draft
Riverine Buffalo 38 1.00 0.00 0.00 1.00 0.00 Dairy
Total 73 1.00 0.00 0.00 1.00 0.00 Swamp/Riverine
(Bos indicus), mithun (Bos frontalis) and yak (Bos grunniens) were used for the amplification and sequencing of promoter, exon1 and partial intron1 region covering 937 bp of the
TGgene.
For the detection of polymorphism in 548 bp of TG
promoter region a panel of 42 unrelated animals belonging to five breeds of Indian buffalo and four breeds of Indian cattle were utilized. The buffalo breeds included were Murrah (3), Toda (3), Chilika (5), Banni (5) and Bhadawari (5), whereas the cattle breeds included crossbred Karan-Fries (Holstein friesian x Tharparkar, 6), Red Kandhari (4), Tharparkar (6) and Holstein-Friesian (5).
The PsuI-RFLP genotyping was carried out for the 378g.-C4T polymorphic site in our study (same as g.422C4T SNP, reported), across 335 samples belonging to 15 cattle and 73 buffaloes (Table 1), belonging to various Indian riverine and swamp buffalo breeds/population.
2.1. PCR amplification
Total 937 nucleotides ofTG gene including 667 nucleo-tides promoter and 270 nucleonucleo-tides exon1 as well as part of intron1 was amplified in overlapping fragments using two sets of primers, P1 (Forward 50 -GGGGATGACTACGAGTAT-GACTG-30 and Reverse 50 -GTGAAAATCTTGTGGAGGCTGTA-30) reported byBarendse et al. (2004)and P2 (Forward 50-T TAATGGATCTGCCTGTTTTGTTC-30 and Reverse 50-TCTAGTT TCCCATCTCCTGTCCAC-30) designed by using PrimerSelect program of Lasergene software (DNASTAR Inc., Madison, WI, USA).
Primers set P1 (548 bp) was also used to amplify and screen polymorphism across the panel of 21 samples of each Indian cattle and buffalo breed, housing the reported
Psu1-RFLP site (g.-378C4T), as well as for the genotyping of cattle and buffalo breeds (Table 1). Amplification was performed using programmable thermal cycler (PTC-200, MJ Research, USA) with an initial denaturation at 951C for 2.5 min followed by 35 cycles of 941C for 30 s, annealing temperature 581C for 30 s and 721C for 1 min, with a final extension of 5 min at 721C. The PCR products were visualized on 2% ethidium bromide stained agarose gel.
2.2. Sequencing
The amplicons were purified by enzymatic method using ExonucleaseI and Antarctic Phosphatase (New England Biolabs, USA). Purified PCR products were sequenced bi-directionally using BigDye terminator cycle sequencing kit (Applied Biosystems, USA) on ABI 3100 Genetic Analyzer and the raw sequence data was edited manually using Chromas Ver. 1.45 (http://www.technely sium.com.au/chromas.html).
2.3. PsuI-RFLP (g.-378C4T) genotyping
The PCR amplified products from primers P1 (548 bp) were digested withPsuI restriction enzyme (New England BioLabs) in a 20ml reaction volume at 371C for 8 h. The RE digested products were electrophoresed in 3% agarose gel and the genotypic patterns were visualized by ethidium bromide staining and recorded for further analysis.
2.4. Data analysis
Two different fragments of Bubalus bubalis (riverine buffalo),Bubalus bubalis carabanesis(swamp buffalo),Bos indicus(cattle), Bos frontalis (mithun) and Bos grunniens
(yak) ofTGgene were assemble into 937 bp using seqMan program of Lasegene software, analysed and submitted to GenBank (Acc. no. JX09179-JX09183). These sequences
were compared with published bovine sequence
(ENSBTAT00000010295). Transcription factor binding site analysis was performed using Alibaba and P-Match gene regulation online programme (http://www.gene-regula tion.com/pub/programs.html).
For detection of polymorphism the edited sequences were further subjected to multiple alignments to identify nucleotide variations, using Mega4 program. Allele fre-quency for each breed andFSTvalue (Weir and Cockerham, 1984) were calculated using GenAlex6.2 program (Peakall and Smouse 2006). A principal component analysis (PCA) was carried out to determine breed relationships among buffalo and cattle directly based on Fst values (Manly, 1986), using GenAlEx6.2 program.
3. Results
3.1. Diversity across species
Promoter and adjoining exon 1 and part of intron 1 sequence data amplified as 937 bp product, when ana-lyzed, there was 99% homology between Zebu and Taurus
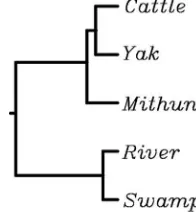
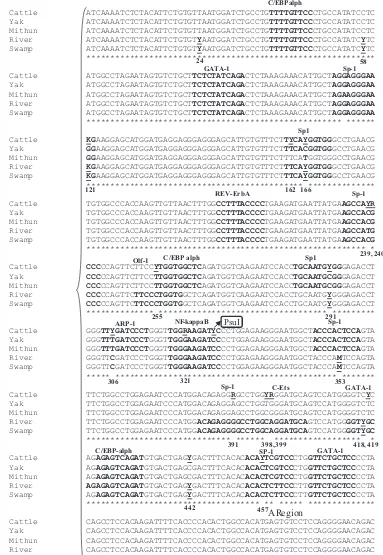
TG promoter sequence. Among the species/subspecies investigated, maximum homology (99.8%) was between riverine and swamp buffaloes. Overall 98% homology was observed across the four species. Phylogenetic analysis showed grouping of two buffalo subspecies into separate cluster whereas, all the threeBosspecies, cattle, yak and mithun clustering together in another group (Fig. 1). Transcription factors binding sites analysis revealed the presence of 59 potential sites in cattle, mithun and riverine buffalo, 58 in swamp buffalo and 60 in yak. Most of the transcription factor binding sites were conserved across species, while some sites exhibited variation between species (Fig. 2). The three putative thyroid transcription factor (TTF-1) binding sites A, B and C reported in other species (Donda et al., 1991) were largely conserved across the species investigated. However in the C region, a C4T
Cattle ATCAAAATCTCTACATTCTGTGTTAATGGATCTGCCTGTTTTGTTCCCTGCCATATCCTC
Yak ATCAAAATCTCTACATTCTGTGTTAATGGATCTGCCTGTTTTGTTCCCTGCCATATCCTC
Mithun ATCAAAATCTCTACATTCTGTGTTAATGGATCTGCCTGTTTTGTTCCCTGCCATATCCTC
River ATCAAAATCTCTACATTCTGTGTYAATGGATCTGCCTGTTTTGTTCCCTGCCATATCYTC
Swamp ATCAAAATCTCTACATTCTGTGTYAATGGATCTGCCTGTTTTGTTCCCTGCCATATCYTC
************************************************************
Cattle ATGGCCTAGAATAGTGTCTGCTTCTCTATCAGACTCTAAAGAAACATTGCTAGGAGGGAA
Yak ATGGCCTAGAATAGTGTCTGCTTCTCTATCAGACTCTAAAGAAACATTGCTAGGAGGGAA
Mithun ATGGCCTAGAATAGTGTCTGCTTCTCTATCAGACTCTAAAGAAACATTGCTAGAAGGGAA
River ATGGCCTAGAATAGTGTCTGCTTCTCTATCAGACTCTAAAGAAACATTGCTAGGAGGGAA
Swamp ATGGCCTAGAATAGTGTCTGCTTCTCTATCAGACTCTAAAGAAACATTGCTAGGAGGGAA
***************************************************** ******
Cattle KGAAGGAGCATGGATGAGGAGGGAGGGAGCATTGTGTTTCTTYCAYGGTGGGCCTGAACG
Yak GGAAGGAGCATGGATGAGGAGGGAGGGAGCATTGTGTTTCTTTCACGGTGGGCCTGAACG
Mithun GGAAGGAGCATGGATGAGGAGGGAGGGAGCATTGTGTTTCTTTCATGGTGGGCCTGAACG
River KGAAGGAGCATGGATGAGGAGGGAGGGAGCATTGTGTTTCTTTCAYGGTGGGCCTGAACG
Swamp KGAAGGAGCATGGATGAGGAGGGAGGGAGCATTGTGTTTCTTTCAYGGTGGGCCTGAACG
********************************************* **************
Cattle TGTGGCCCACCAAGTTGTTAACTTTGGCCTTTACCCCTGAAGATGAATTATGAAGCCAYR
Yak TGTGGCCCACCAAGTTGTTAACTTTGGCCTTTACCCCTGAAGATGAATTATGAAGCCACG
Mithun TGTGGCCCACCAAGTTGTTAACTTTGGCCTTTACCCCTGAAGATGAATTATGAAGCCACG
River TGTGGCCCACCAAGTTGTTAACTTTGGCCTTTACCCCTGAAGATGAATTATGAAGCCATG
Swamp TGTGGCCCACCAAGTTGTTAACTTTGGCCTTTACCCCTGAAGATGAATTATGAAGCCACG
********************************************************** *
Cattle CCCCCAGTTCTTCCYTGGTGGCTCAGATGGTCAAGAATCCACCTGCAATGYGGGAGACCT
Yak CCCCCAGTTCTTCCTTGGTGGCTCAGATGGTCAAGAATCCACCTGCAATGCGGGAGACCT
Mithun CCCCCAGTTCTTCCTTGGTGGCTCAGATGGTCAAGAATCCACCTGCAATGCGGGAGACCT
River CCCCCAGTTCTTCCCTGGTGGCTCAGATGGTCAAGAATCCACCTGCAATGYGGGAGACCT
Swamp CCCCCAGTTCTTCCCTGGTGGCTCAGATGGTCAAGAATCCACCTGCAATGYGGGAGACCT
************** *********************************** *********
Cattle GGGTTYGATCCCTGGGTTGGRAAGATYCCCTGGAGAAGGGAATGGCTACCCACTCCAGTA
Yak GGGTTTGATCCCTGGGTTGGGAAGATCCCCTGGAGAAGGGAATGGCTACCCACTCCAGTA
Mithun GGGTTTGATCCCTGGGTTGGGAAGATCCCCTGGAGAAGGGAATGGCTACCCACTCCAGTA
River GGGTTCGATCCCTGGGTTGGGAAGATCCCCTGGAGAAGGGAATGGCTACCCAMTCCAGTA
Swamp GGGTTCGATCCCTGGGTTGGGAAGATCCCCTGGAGAAGGGAATGGCTACCCAMTCCAGTA
***** ********************************************** *******
Cattle TTCTGGCCTGGAGAATCCCATGGACAGAGGRGCCTGGYRGGATGCAGTCCATGGGGTCYC
Yak TTCTGGCCTGGAGAATCCCATGGACAGAGGAGCCTGGTGGGATGCAGTCCATGGGGTCTC Mithun TTCTGGCCTGGAGAATCCCATGGACAGAGGAGCCTGGCGGGATGCAGTCCATGGGGTCTC
River TTCTGGCCTGGAGAATCCCATGGACAGAGGGGCCTGGCAGGATGCAGTCCATGGGGTYGC
Swamp TTCTGGCCTGGAGAATCCCATGGACAGAGGGGCCTGGCAGGATGCAGTCCATGGGGTYGC
****************************** ****** ****************** *
Cattle AGAGAGTCAGATGTGACTGAGYGACTTTCACACACAYTCGTCCCTGGTTCTGCTCCCCTA
Yak AGAGAGTCAGATGTGACTGAGCGACTTTCACACACACTCGTCCCTGGTTCTGCTCCCCTA
Mithun AGAGAGTCAGATGTGACTGAGCGACTTTCACACACACTCGTCCCTGGTTCTGCTCCCCTA
River AGAGAGTCAGATGTGACTGAGYGACTTTCACACACACTCTTCCCTTGTTCTGCTCCCCTA
Swamp AGAGAGTCAGATGTGACTGAGYGACTTTCACACACACTCTTCCCTTGTTCTGCTCCCCTA
************************************ ** ***** **************
Cattle CAGCCTCCACAAGATTTTCACCCCACACTGGCCACATGAGTGTCCTCCAGGGGAACAGAC Yak CAGCCTCCACAAGATTTTCACCCCACACTGGCCACATGAGTGTCCTCCAGGGGAACAGAC Mithun CAGCCTCCACAAGATTTTCACCCCACACTGGCCACATGAGTGTCCTCCAGGGGAACAGAC River CAGCCTCCACAAGATTTTCACCCCACACTGGCCACATGAGTGTCCTCCAGGGGAACAGAC Swamp CAGCCTCCACAAGATTTTCACCCCACACTGGCCACATGAGTGTCCTCCAGGGGAACAGAC ************************************************************
Sp1
Olf-1 C/EBPalph Sp1
ARP-1
GATA-1 SP-1
C/EBP-alph
GATA-1 C-Ets
Sp-1 GATA-1
C/EBPalph
Sp-1
REV-ErbA Sp-1
NF-kappaB
Sp-1
24 58
121 162 166
255
239, 240
291
306 321 353
391 398, 399 418, 419
442 457
PsuI
A Region
transversion was detected at position 596 in Indian cattle (Fig. 2).
3.2. Polymorphism across Indian cattle and buffalo
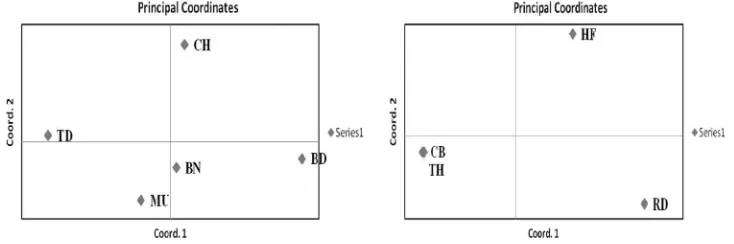
The sequence analysis of the 548 nucleotides region, reported to be harboring polymorphic sites associated with marbling in feedlot cattle (Barendse et al., 2004), revealed a total of 15 polymorphic sites in cattle and 8 in buffalo (Tables 2a and 2b). Of the 15 SNPs identified in Indian cattle two SNPs, 291A4G and 378C4T (g.-422C4T) have been previously described in Korean and other cattle (Shin and Chung, 2007), rests thirteen being novel. Four polymorphic sites were common across cattle and buffalo (121G4T, 166C4T, 291C4T and 442C4T). The allele and genotype frequencies for each of the identified SNPs were estimated across cattle and buffalo breeds as reported by earlier workers in candidate gene polymorphism across breeds/populations (Yoon et al., 2005;Hou et al., 2011;Sodhi et al., 2013). The frequency of C allele at position 378, reported to be associated with marbling, was 95% in cattle and completely fixed in buffalo (Tables 2a and 2b). Based on these SNPs, the relationship between the cattle as well as buffalo breeds was analyzed using principal component analysis of GenAlEx 6.2 pro-gram. The results revealed a close relationship between Tharparkar and crossbred cattle Karan-Fries (Cross of taurine Holstein and indicus Tharparkar breed) as com-pared to Red Kandhari and Holstein Friesian breeds of cattle. In case of buffalo Murrah and Banni breeds showed a greater genetic similarity (Fig. 3).
3.3. Analysis of PsuI (SNP g.378C4T) genotypes in
Indian cattle and buffalo
Allelic distribution of PsuI (378C4T) polymorphism observed in the promoter region of the thyroglobulin gene, associated with meat tenderness in cattle was analyzed
across 335 animals, including 15 documented Indian cattle breeds of different agro- climatic regions and of different utility, as well as 73 samples of Indian riverine (38 animals) and swamp buffaloes (35 animals). The distribu-tion of genotypes and allele frequencies for all the breeds of cattle and buffalo obtained by PCR-RFLP analysis is summarized in Table 1. In indigenous cattle and buffalo thePsuI RFLP revealed a banding pattern similar to that reported previously (Thaller et al., 2003). The C allele yielded three fragments of 295, 178 and 75 bp, while the T allele gave two fragments of 473 and 75 bp sizes, respectively. The average allelic frequency for alleles C and T was 0.95 and 0.05, respectively, across all the cattle breeds investigated (Table 1). However the C allele was fixed in Indian buffaloes. The distribution of both alleles was similar across all the indigenous cattle breeds irre-spective of their geographic distribution and utility. How-ever, among indigenous breeds, frequency of T allele was comparatively higher in Kankarej (0.15) and Nagori (0.26), mostly due to presence of CT heterozygotes. The homo-zygous TT genotype was absent in all the animals except in Mewati and Kankrej cattle breeds. The frequency of the CC genotype was higher than CT in all cattle breeds except Nagori.
4. Discussion
4.1. Diversity in TG promoter region across species
The thyroglobulin promoter alongwith exon1 and par-tial intron1 region, was sequence characterized in four species. Overall homology above 98% was observed across all the species studied. The genetic relationship of yak (B. grunniens) was closer to cattle (Bos taurus) than mithun (B. frontalis) (Fig. 1), which appeared to be similar to previous reports based on microsatellite/mitochondrial diversity studies (Dorji et al., 2010;Qi et al., 2009). Since the expression of genes is largely regulated by binding of
Cattle GCAGGTGGAGGACCTCCTTGTGACCAGCAGAGAAAACAGGGTGGGCACTGCTTCCTTGAG
Yak GCAGGTGGAGGACCTCCTTGTGACCAGCAGAGAAAACAGGGTGGGCACTGCTTCCCTGAG
Mithun GCAGGTGGAGGACCTCCTTGTGACCAGCAGAGAAAACAGGGTGGGCACTGCTTCCCTGAG
River GCAGGTGGAGGACCTCCTTGTGACCAGCAGAGAAAACAGGGCGGGCACTGCTTCCCTGAG
Swamp GCAGGTGGAGGACCTCCTTGTGACCAGCAGAGAAAACAGGGCGGGCACTGCTTCCCTGAG
***************************************** ************* ****
Cattle TGCCTGTGGGTGGGGGCTAAGTACCCACAGCAGTGCTATAAAGGCTCCTTGGCCAGAGCC
Yak TGCCTGTGGGTGGGGGCTAAGTACCCACAGCAGTGCTATAAAGGCTCCTTGGCCAGAGCC
Mithun TGCCTGTGGGTGGGGGCTAAGTACCCACAGCAGTGCTATAAAGGCTCCTTGGCCAGAGCC
River TGCCTGTGGGTGGGGGCTAAGTACCCACAGCAGTGCTATAAAGGCTCCTTGGCCAGAGCC
Swamp TGCCTGTGGGTGGGGGCTAAGTACCCACAGCAGTGCTATAAAGGCTCCTTGGCCAGAGCC
************************************************************
Cattle CTAAGGTGGGCAGCAGCTTCTAACCCTTCTCCCTGGAAGGGCTCCCAAGATGGCCCTG
Yak CTAAGGTGGGCAGCAGCTTCTAACCCTTCTCCCTGGAAGGGCTCCCAAGATGGCCCTG
Mithun CTAAGGTGGGCAGCAGCTTCTAACCCTTCTCCCTGGAAGGGCTCCCAAGATGGCCCTG
River CTAAGGTGGGCAGCAGCTTCTAACCCTTCTCCCTGGAAGGGCTCCCAAGATGGCCCTG
Swamp CTAAGGTGGGCAGCAGCTTCTAACCCTTCTCCCTGGAAGGGCTCCCAAGATGGCCCTG
**********************************************************
TATAbox NF-1
DMotif/Bregion Cregion
M--A--L--5’UTR ORF
Egr-1
Sp-1
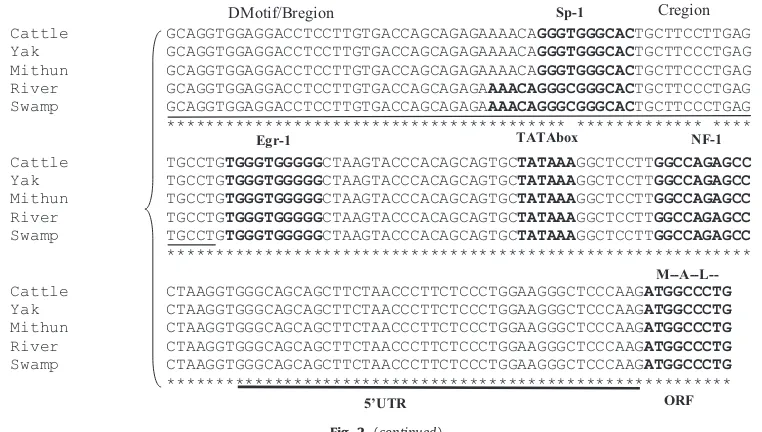
transcription factors in the promoter region, changes in the transcription factors binding sites might affect its expression. In the present study the putative TTF-1 (A–C regions) and TATA binding site were conserved across the investigated species. Although in the rat the three TTF-1 sites are much more conserved in terms of DNA sequences, they display better conservation of function in the cow (Javaux et al., 1992). In human,Fabbro et al. (1994)found that, in anaplastic thyroid carcinomas, the absence of TTF-1 was associated with the absence of TG expression. Mutations in the transcription factor binding sites have been reported to alter/affect the expression of many genes
such as amyloid precursor protein (APP) gene in humans (Theuns et al., 2006), ankyrin gene in bovine (Aslan et al., 2010) andIGF2gene in pigs (Aslan et al., 2012). Therefore, the significance of the 596C4T variation observed in the TTF-1 binding C region of theTGpromoter in Indian cattle needs to be further investigated.
4.2. Polymorphism in cattle and buffalo TG promoter
In this study, 13 novel and 2 previously reported polymorphic nucleotide sites could be detected in 548 bp of theTGgene promoter region of cattle and 7 of the SNPs Table 2a
Genotype and allelic frequencies of SNPs observed in thyroglobulin gene of Indian riverine buffaloes.
Position* No. Genotype frequencies Allele frequencies
B24 C4T 21 0.29 (CC) 0.29 (CT) 0.43 (TT) 0.43 (C) 0.57(T)
B58 C4T 21 0.90 (CC) 0.05 (CT) 0.05 (TT) 0.93 (C) 0.07 (T)
B121G4T 21 0.29 (GG) 0.43 (GT) 0.29 (TT) 0.5 (G) 0.5 (T)
B166 C4T 21 0.33 (CC) 0.38 (CT) 0.29 (TT) 0.52 (C) 0.48 (T)
B291C4T 21 0.43 (CC) 0.33 (CT) 0.24 (TT) 0.6 (C) 0.4 (T)
B353 A4C 21 0.24 (AA) 0.33(AC) 0.43 (CC) 0.4 (A) 0.6 (C)
B418 C4T 21 0.43 (CC) 0.33 (CT) 0.24 (TT) 0.6 (C) 0.4 (T)
B442 C4T 21 0.95 (CC) 0.05 (CT) 0.0(TT) 0.98 (C) 0.02 (T)
*Position with respective buffalo Acc. no. JX090181.
Table 2b
Genotype and allelic frequencies of SNPs observed in thyroglobulin gene of Indian cattle.
Position* No. Genotype frequencies Allele frequencies
C121 G4T 21 0.43(GG) 0.57 (GT) 0.00 (TT) 0.71(G) 0.29 (T)
C162 C4T 21 0.24 (CC) 0.57(CT) 0.19 (TT) 0.52 (C) 0.48 (T)
C166 C4T 21 0.33 (CC) 0.38(CT) 0.29 (TT) 0.52 (C) 0.48 (T)
C239 C4T 21 0.43 (CC) 0.57(CT) 0.00 (TT) 0.71 (C) 0.29 (T)
C240 A4G 21 0.24 (AA) 0.57 (AG) 0.19 (GG) 0.52 (A) 0.48 (G)
C255 C4T 21 0.00 (CC) 0.57(CT) 0.43 (TT) 0.29 (C) 0.71 (T)
aC291 C4T 21 0.90 (CC) 0.05(CT) 0.05 (TT) 0.93 (C) 0.07 (T)
C306 C4T 21 0.00 (CC) 0.57(CT) 0.43 (TT) 0.29 (C) 0.71 (T)
C321 A4G 21 0.05 (AA) 0.05(AG) 0.90 (GG) 0.07 (A) 0.93 (G)
aC378 C4T 335 0.90 (CC) 0.09(CT) 0.01 (TT) 0.95 (C) 0.05 (T)
C391 A4G 21 0.43 (AA) 0.57(AG) 0.00 (GG) 0.71 (A) 0.29 (G)
C398 C4T 21 0.90 (CC) 0.10(CT) 0.00 (TT) 0.95 (C) 0.05 (T)
C399 A4G 21 0.00 (AA) 0.57(AG) 0.43 (GG) 0.29 (A) 0.71 (G)
C419 G4T 21 0.00 (GG) 0.57 (GT) 0.43 (TT) 0.29 (G) 0.71 (T)
C442 C4T 21 0.90 (CC) 0.05(CT) 0.05 (TT) 0.93 (C) 0.07 (T)
C457 C4T 21 0.19 (CC) 0.57(CT) 0.24 (TT) 0.48 (C) 0.52 (T)
aSNPs previously reported were observed in Indian cattle, Position with respective to cattle Acc. no. JX090179.
detected were novel in buffalo. The presence of new polymorphisms at this region reflects a greater genetic diversity available in Indian cattle and buffalo populations at this locus. This genetic polymorphism may account for the between species and within species variation in the milk fat content of cattle and buffalo (Medhammar et al., 2011).
4.3. Analysis of PsuI (SNP g.378C4T) genotypes
Analysis of the g.378C4T (PsuI) SNP revealed that all cattle breeds as well as buffalo, irrespective of their geographic distribution and utility exhibited clear predo-minance of C allele. These results are in agreement with previous reports on B. taurus and B. indicus cattle (Eenennaam et al., 2007;Fortes et al., 2009). The C allele was fixed in Gir, Rathi, Khillar and Sahiwal breeds and except for Khillar these are dairy breeds, having moder-ately higher percentage of fat in milk as compared to taurine cattle. The buffalo samples also showed fixation of the C allele. It is worth emphasizing that the homozygous TT genotypes were largely absent in the Indian cattle and totally absent in buffalo populations. Several studies have associated this polymorphism with marbling, intramuscu-lar fat, backfat thickness, ribeye area and carcass weight (Barendse, 1999; Thaller et al., 2003; Casas et al., 2005; Rincker et al., 2006; Shin and Chung, 2007). The g.378C4T polymorphism, was established as the cau-sative mutation within the marbling QTL (Barendse et al., 2004) and the T allele was considered the favorable allele for intramuscular fat deposition. This polymorphism has since been used in commercial DNA marker kits (TG5 marker, GENESTAR). It is interesting to note that Indian cattle breeds like Kankrej, and Nagori exhibited a slightly higher frequency of the T allele (0.26), comparable to that observed in Angus and Shorthorn breeds (Eenennaam et al., 2007). Higher frequency of T allele in Nagori was due to presence of CT genotypes despite that TT genotypes were missing, which could be due to recent decline in its population being a draft breed and introgression of other breeds. Contradictory reports are also available, where no association was found between theTGpolymorphism and back fat inB. taurus(Moore et al., 2003) or marbling score inB. indicuscattle (Casas et al., 2005).Pannier et al. (2010) also did not find any association with marbling and fat deposition traits in various cattle breeds. A lower fre-quency of the T allele inB. indicusas compared toB. taurus
has also been observed previously (Eenennaam et al., 2007;Fortes et al., 2009;Carvalho et al., 2012).Shin and Chung (2007)have reported the association of CC and CT genotypes with a higher marbling score in Korean cattle. Interestingly, we found this polymorphism within NF-
κ
B transcription factor binding site that governs the cellular reaction to a variety of extracellular signals (Fig. 2) (Diamant and Dikstein, 2013). Since the effects of these genotypes may vary among different populations and with environment, the association of the T allele with fat deposition in Indian cattle and buffalo needs to be verified, however, its absence or low frequency suggests results to be similar to reported in Korean cattle, since milk fat contents of Indian cattle as well as buffalo is higher thantaurine cattle. The diversity available in Indian cattle breeds for g.378C4T SNP, as revealed from this study, also presents the opportunity to exploit the use of either allele/genotype once the association is validated in the Indian bovine and bubaline population. In order to confirm these observations future studies will need to be carried out to see the effect of reported SNPs on the milk and meat quality traits, in the Indian cattle and bubaline populations.
The elucidation of genetic polymorphism in the pro-moter region ofTGgene in five species as well as analysis of the g.378C4T polymorphism in Indian cattle and buffalo has been presented in the study. The low frequency of the T allele in Indian breeds was in conformity to previous reports in B. indicus (Fortes et al., 2009; Carvalho et al., 2012). However, an in depth analysis of the association of the TG marker in Indian cattle and buffalo is required in order to utilize it for improvement of the meat/milk quality.
Conflict of interest statement
None.
Acknowledgements
The authors wish to thank the Director of the National Bureau of Animal Genetic Resources, Karnal, India, for providing the financial support, under buffalo meat project, that allowed carrying out this work. Technical support received from Mr. Naresh Yadav is gratefully acknowledged.
References
Aslan, O., Sweeney, T., Mullen, A.M., Hamill, R.M., 2010. Regulatory polymorphisms in the bovine Ankyrin 1 gene promoter are asso-ciated with tenderness and intramuscular fat content. BMC Genet 11, 111.
Aslan, O., Hamill, R.M., Davey, G., Bryan, J.M., Mullen, A.M., Gispert, M., Sweeney, T., 2012. Variation in the IGF2 gene promoter region is associated with intramuscular fat content in porcine skeletal muscle. Mol. Biol. Rep. 39, 4101–4110.
Barendse, W., 1999. Assessing Lipid Metabolism. International Patent Publication WO 99/23248, World Intellectual Property Organization, Geneva.
Barendse, W.J., Bunch, R., Thomas, M., Armitage, S., Baud, S., Donaldson, N., 2004. TheTG5 thyroglobulin gene test for a marbling quantitative trait loci evaluated in feedlot cattle. Aust. J. Exp. Agric. 44, 669–674.
Blackwood, L., Onions, D.E., Argyle, D.J., 2001. Characterization of the feline thyroglobulin promoter. Domest. Anim. Endocrinol. 20, 185–201.
Carvalho, T.D.D., Siqueira, F., Torres, R.A.A., Medeiros, S.R.D., Feijó, G.L.D., Souza, M.D.D., Blecha, I.M.Z., Soares, C.O., 2012. Association of poly-morphisms in the leptin and thyroglobulin genes with meat quality and carcass traits in beef cattle. Rev. Bras. Zootec 41, 2162–2168.
Casas, E., Shackelford, S.D., Keele, J.W., Stone, R.T., Kappes, S.M., Koohmar-aie, M., 2000. Quantitative trait loci affecting growth and carcass composition of cattle segregating alternate forms of myostatin. J. Anim. Sci. 78, 560–569.
Casas, E., White, S.N., Riley, D.G., Smith, T.P.L., Brenneman, R.A., Olson, T.A., Johnson, D.D., Coleman, S.W., Bennett, G.L., Chase, C.C., 2005. Assess-ment of single nucleotide polymorphisms in genes residing on chromosomes 14 and 29 for association with carcass composition traits inBos indicuscattle. J. Anim. Sci. 83, 13–19.
located upstream from the human thyroglobulin gene. Nucleic Acids Res. 13, 5127–5144.
Darimont, C., Gaillard, D., Aihaud, G., Negrel, R., 1993. Terminal differ-entiation of mouse preadipocyte cells: adipogenisis and antimito-genic role of triiodothyronine. Mol. Cell. Endocrinol. 98, 67–73.
Diamant, G., Dikstein, R., 2013. Transcriptional control by NF-κB: elonga-tion in focus. Biochim. Biophys. Acta 1829, 937–945.
Donda, A., Vassart, G., Christophe, D., 1991. Isolation and characterization of the canine thyroglobulin gene promoter region. Biochim. Biophys. Acta 1090, 235–237.
Dorji, T., Mannen, H., Namikawa, T., Inamura, T., Kawamoto, Y., 2010. Diversity and phylogeny of mitochondrial DNA isolated from mithun Bos frontalislocated in Bhutan. Anim. Genet. 41, 554–556.
Eenennaam, A.L.V., Li, J., Thallaman, R.M., Quaas, R.L., Dikeman, M.E., Gill, C.A., Franke, D.E., Thomas, M.G., 2007. Validation of commercial DNA tests for quantitative beef quality traits. J. Anim. Sci. 85, 891–900.
Fabbro, D., Loreto, C.D., Beltrami, C.A., Belfiore, A., Lauro, R.D., Damante, G., 1994. Expression of thyroid-specific transcription factors TTF-1 and Pax-8 in human thyroid neoplasms. Cancer Res. 54, 4744–4749.
Folley, S.J., Malpress, F.H., 1948. Hormonal control on mammary growth. In: Pincuss, G., Thimamm, K.V. (Eds.), The Hormones. first ed., Academic Press.
Fortes, R.S.M., Rogério, A.C., Chardulo, L.A.L., Silveira, C.A., Assumpcao, E. O.D.M., Visintin, A.J., Oliveira, H.N.D., 2009. Bovine gene polymorph-isms related to fat deposition and meat tenderness. Genet. Mol. Biol. 32, 75–82.
Hou, G.Y., Yuan, Z.R., Zhou, H.L., Zhang, L.P., Li, J.Y., Gao, X., Wang, D.J., Gao, H.J., Xu, S.Z., 2011. Association of thyroglobulin gene variants with carcass and meat quality traits in beef cattle. Mol. Biol. Rep. 38, 4705–4708.
Javaux, F., Bertaux, F., Donda, A., Lang, H.F., Vassart, G., Lauro, R.D., Christophe, D., 1992. Functional role of TTF-1 binding sites in bovine thyroglobulin promoter. FEBS Lett. 300, 222–226.
Kandeepan, G., Biswas, S., Rajkumar, R.S., 2009. Buffalo as a potential food animal. Int. J. Livest. Prod 1, 1–5.
Killinger, K.M., Calkins, C.R., Umberger, W.J., Feuz, D.M., Eskridge, K.M., 2004. Consumer sensory acceptance and value for beef steaks of similar tenderness, but differing in marbling level. J. Anim. Sci. 82, 3294–3301.
Manly, B.F.J., 1986. Multivariate Statistical Methods: A Primer. Chapman and Hall/CRC Press, LLC, New Mexico, 1–15.
Martynoff, G.D., Pohl, V., Mercken, L., Ommen, G.J.V., Vassart, G., 1987. Structural organization of the bovine thyroglobulin gene and of its 59-flanking region. Eur. J. Biochem. 164, 591–599.
Medhammar, E., Bettoni, R.W., Stadlmayr, B., Nilsson, E., Charrondiere, U.R., Burlingame, B., 2011. Composition of milk from minor dairy animals and buffalo breeds: a biodiversity perspective. J. Sci. Food Agric 92, 445–474.
Michal, J.J., Zhang, Z.W., Gaskins, C.T., Jiang, Z., 2006. The bovine fatty acid binding protein 4 gene is significantly associated with marbling and
subcutaneous fat depth in Wagyu x Limousin F2 crosses. Anim. Genet. 37, 400–402.
Sodhi, M., Mukesh, M., Kishore, A., Mishra, B.P., Kataria, R.S., Joshi, B.K., 2013. Novel polymorphisms in UTR and coding region of inducible heat shock protein 70.1 gene in tropically adapted Indian zebu cattle (Bos indicus) and riverine buffalo (Bubalus bubalis). Gene 527, 606–615.
Moore, S.S., Li, C., Basarab, J., Snelling, W.M., Kneeland, J., Murdoch, B., Hansen, C., Benkel, B., 2003. Fine mapping of quantitative trait loci and assessment of positional candidate genes for backfat on bovine chromosome 14 in a commercial line ofBos taurus. J. Anim. Sci. 81, 1919–1925.
Musti, A.M., Ursini, V.M., Avvedimento, E.V., Zimarino, V., Lauro, R.D., 1987. A cell type specific factor recognizes the rat thyroglobulin promoter. Nucleic Acids Res. 15, 8149–8166.
Pannier, L., Mullen, A.M., Hamill, R.M., Stapleton, P.C., Sweeney, T., 2010. Association analysis of single nucleotide polymorphisms in DGAT1, TGand FABP4 genes and intramuscular fat in crossbredBos taurus cattle. Meat Sci. 85, 515–518.
Peakall, R., Smouse, P.E., 2006. GenAlEx 6: genetic analysis in Excel. Population genetic software for teaching and research. Mol. Ecol. Notes. 6, 288–295.
Qi, X.B., Jianlin, H., Wang, G., Rege, J.E.O., Hanotte, O., 2009. Assessment of cattle genetic introgression into domestic yak populations using mitochondrial and microsatellite DNA markers. Anim. Genet. 41, 242–252.
Rincker, C.B., Pyatt, N.A., Berger, L.L., Faulkner, D.B., 2006. Relationship among GeneSTAR marbling marker, intramuscular fat deposition and expected progeny differences in early weaned Simmental steers. J. Anim. Sci. 84, 686–693.
Shin, S.C., Chung, E.R., 2007. Association of SNP marker in the thyroglo-bulin gene with carcass and meat quality traits in Korean cattle. Asian-Aust. J. Anim. Sci. 20, 172–177.
Smet, S.D., 2012. Meat, poultry and fish composition: contribution to human intake of essential nutrients and strategies to optimize. Anim. Front 2, 10–16.
Thaller, G., Kühn, C., Winter, A., Ewald, G., Bellmann, O., Wegner, J., Zühlke, H., Fries, R., 2003. DGAT1, a new positional and functional candidate gene for intramuscular fat deposition in cattle. Anim. Genet. 34, 354–357.
Theuns, Jessie., Brouwers, N., Engelborghs, S., Sleegers, K., Bogaerts, V., Corsmit, E., Pooter, T.De, Duijn, M.V.C., Deyn, P.P.D., Broeckhoven, C.V., 2006. Promoter mutations that increase amyloid precursor-protein expression are associated with Alzheimer disease. Am. J. Hum. Genet. 78, 936–946.
Weir, B.S., Cockerham, C.C., 1984. Estimating F-statistics for the analysis of population structure. Evolution 38, 1358–1370.