Corresponding author: [email protected]
The effect of long-term high-fat diet in
ovariectomized Wistar rat on leptin serum
levels
Dita Fitriani1, Andreanyta Meliala2, Denny Agustiningsih2*
1Graduate Student of Basic Medical Science and Biomedical Sciences, Postgraduate
Program, 2Department of Physiology, Faculty of Medicine, Universitas Gadjah Mada,
Yogyakarta, Indonesia.
DOI: http://dx.doi.org/10.19106/JMedSci004802201601
ABSTRACT
Leptin and estrogen have an important role in energy homeostasis through anorexic effects on the central nervous system. These hormones can decrease food intake, increases energy expenditure and thermogenesis. Long-term high-fat diet can lead to impaired leptin
function. Moreover, estrogen, deiciency is a risk factor of obesity in menopause. The
aim of this study is to investigate the effect of long-term high-fat diet on leptin serum levels in ovariectomized rats. Twenty-eight female Wistar rats (Rattus norvegicus) aged
6-8 weeks with body weight 120-150 g were used in this study. Rats were divided into
4 groups i.e. OVXSC groups: rat were ovariectomized and given a standard diet; OVXH groups: rat were ovariectomized and given a high-fat diet; SHAMSC groups: rat were not ovariectomized and given a standard diet; SHAMHF groups : rat were not ovariectomized and given a high-fat diet. Pre-post test with control group design for measurement of serum leptin levels, food intake, and Lee index. While post-test only control group design
for measurement of abdominal fat mass. Pearson test was used to analyze the correlation between leptin serum levels, food intake, Lee index and abdominal fat mass. Paired t-test was used to analyze the differences between values before and after being treated.
The daily food intake dropped in rat fed a high-fat diet although it was not statistically
signiicant (p>0.05). Ovariectomy signiicantly increase Lee index (p<0.05). Obesity occurs in ovariectomized group, both of high-fat diet and standard diet. Abdominal fat mass was signiicantly higher in high-fat compared to standard diet group (p<0.05). Increase in levels of serum leptin highest in OVX-HF group (16.45 ± 8.75 ng/mL), and the lowest in the SHAM-SC (2.98 ± 1.61 ng/mL). In conclusion, serum leptin levels positively correlated with Lee index and abdominal fat mass, but negatively correlated
with daily food intake.
ABSTRAK
Leptin dan estrogen memiliki peran penting dalam homeostasis energi melalui efek anoreksigenik pada sistem saraf pusat. Kedua hormon ini dapat menurunkan asupan makan, meningkatkan pengeluaran energi, dan termogenesis. Diet tinggi lemak jangka panjang
120-150 g digunakan dalam penelitian. Tikus dibagi menjadi 4 kelompok, yaitu kelompok tikus ovariektomi dan diberi diet standar (OVX-SC), kelompok tikus ovariektomi dan diberi diet tinggi lemak (OVX-HF), kelompok tikus tidak ovariektomi dan diberi diet standar (SHAM-SC), kelompok tikus tidak ovariektomi dan diberi diet tinggi lemak (SHAM-HF).
Penelitian ini menggunakan metode eksperimental murni dengan pre-post test with control group design untuk pengukuran kadar leptin serum, asupan makan dan indeks Lee. Sedangkan post test only control group design untuk massa lemak abdominal. Uji korelasi
menggunakan uji Pearson. Uji paired t-test digunakan untuk menganalisis perbedaan nilai sebelum dan setelah diberi perlakuan. Penurunan asupan maka harian dijumpai pada kelompok yang diberi diet lemak tinggi meskipun tidak bermakna (p>0,05). Ovariektomi menyebabkan peningkatan indeks Lee yang bermakna (p<0,05). Obesitas terjadi pada tikus yang diovariektomi baik yang diberi diet tinggi lemak maupun diet standar. Masa lemak abdominal lebih tinggi secara nyata pada kelompok diet tinggi lemak dibandingkan kelompok diet standar (p<0,05). Peningkatan kadar leptin serum tertinggi terjadi pada kelompok OVX-HF (16,45 ± 8,75 ng/mL), dan terendah pada SHAM-SC (2,98 ± 1,61 ng/mL). Dapat disimpulkan, kadar leptin serum memiliki korelasi positif dengan indeks Lee
dan massa lemak abdominal, namun berkorelasi negatif dengan asupan makan harian.
Keywords: obesity, menopause, leptin, Lee index, abdominal fat.
INTRODUCTION
Menopause is a critical period in the woman’s life related to aging and marks the cessation of the woman’s natural reproductive life. During the menopause, the ovaries no longer produce ovum and the production of estrogen decreases and eventually stopped.1
The composition of body fat after menopause is changed, from the deposition of subcutaneous fat into the abdominal and visceral fat which causes an increased incidence of metabolic syndrome. This is due to decreased production of estrogen after menopause, which is a crucial
factor in inluencing metabolic abnormalities.2
The estrogen has an anorexigenic function to the central nervous system. When estrogen levels are high, during the estrous cycle or menstruation, as well as during pregnancy decreased food intake and accumulation of subcutaneous fat. In contrast to the ovariectomy, menopause and anti-estrogen therapy increase food intake and abdominal fat.2,3
Obesity is the accumulation of excess total body fat leading to high body mass
index (≥25kg/m2 for the Asian population
and ≥30kg/m2 for the European population).
Physiologically, obesity can occur because of a disturbance in the energy balance which is the amount of energy intake more than the amount of energy expenditure and the excess energy is stored in the body as fat.4,5 The prevalence of obesity in many developed and developing countries have increased and are in an alarming condition, because it has reached pandemic proportions over the past decade.6
Leptin is a hormone mainly secreted by white adipose tissue, known as ‘satiety hormone’.7 Leptin function is as a signaling
molecule that communicates messages to the brain about the availability of energy stored in body fat. The brain, particularly the hypothalamus integrates metabolic signals coming from the leptin to regulate energy homeostasis by reducing appetite, increasing energy expenditure and thermogenesis.8,9
Women tend to have higher leptin levels
than men, but decreased signiicantly after
an important role in energy homeostasis and anorexigenic function, the author interested to investigate the effect of long-term high-fat
diet and estrogen deiciency as a risk factor
for obesity on leptin function, which is seen through changes in serum leptin levels, daily food intake, Lee index and abdominal fat mass.
MATERIALS AND METHODS
Animals
Twenty-eight female Wistar rats (Rattus norvegicus) aged 6-8 weeks with body weight
120-150 g were obtained from Laboratory of
Research and Testing Integrated, Universitas Gadjah Mada, Yogyakarta. All of the rats were adapted for seven days in a cage made
from plastic material 25 x 35 cm in size. Each
cage contains a rat and was reposed by chaff and given cover by woven wire. The cages were placed on Animal Treatment Laboratory room which is located in the Department of Physiology, Faculty of Medicine, Universitas Gadjah Mada, Yogyakarta. The temperature
ranged 20-25oC was under controlled 12 hr
of day and night cycle. Standard feed and drinking water were provided in the cages and could be consumed at any time (ad libitum). Protocol of this study was approved by the Medical and Health Research Ethics Committee, Faculty of Medicine, Universitas Gadjah Mada, Yogyakarta.
Animal groupings
At day 8th, rats were randomly divided into
two groups. The irst goup is ovariectomized
rat (OVX) and the second group is not
ovariectomized rat (SHAM) with each number
of group is 14 rats. After having ovariectomy and undergoing recovery for 21 days, rats in groups of OVX and SHAM were subdivided into two new groups based on the provision of
diet. The irst group is ovariectomized given
standard diet (OVX-SC), the second group is
ovariectomized given a high-fat diet
(OVX-HF), the third group is non-ovariectomized
given a standard diet (SHAM-SC), and the last
group is non-ovariectomized given a high-fat
diet (SHAM-HF).
Ovariectomy rat
Ovariectomy was irstly started by rat anesthesia using ketamine injection 0.2 mL/100 g body weight (IM) under aseptic
conditions. Surgery was begun by doing a small incision on the ventral abdominal wall. After that, ovary was clamped bilaterally and removed out. Uterine horns (the meeting point between the uterus with fallopian tubes) was tied and uterus was left intact, then the abdominal wall was sutured back. In dissected
rat (SHAM group), it was anaesthetized and
the abdominal wall was opened in the same way as in the ovariectomy ovaries group without removing it out.1
Taking and examination of blood samples Blood samples for serum leptin levels examination (pre and post-test) was taken from
the retro orbital vein of 1.5 mL. Before blood
sampling, rats were fasted approximately 6-8
hr. Blood samples were kept frozen for 25 min, then centrifuged 20 min at 2,000 g, equal
to 4,339 rpm. Serum was taken and stored at
-20oC temperatures until examination using
ELISA.
Measurement of daily food intake
Measurement of food intake was done
every day at 8:00 to 10:00 am during the treatment (56 days). The measurement was
performed by calculating the difference between the amount of feed given and the remaining amount of feed, both in the feed bowl and scattered in the cage. Feed was
given as much as 15 g/day/rat.
The Lee index
the 8 weeks of administration of a high fat diet). The measurement results are used to calculate the Lee index. Lee index is calculated using the formula, which is the cube root of the weight (g) divided by naso-anal length
(cm) and multiplied by 1000. The result of the calculation is greater than 310 expressed as an
indicator of obesity.12
Abdominal fat mass extraction and measurements
Abdominal fat extraction begins with
anesthesia using ketamine 0.2 mL/100gBW
(IM), under aseptic conditions. Surgery was performed through an incision of the ventral abdominal wall. After the abdominal wall was
open, then intra-abdominal fat was collected including retroperitoneal and omental fat. Collected fat was weighed on digital scales and expressed in units of grams.
Statistical analysis
Normality data test with the Shapiro-Wilk test and variance data test were using Levene test. Normal distribution data was shown
as mean ± standard deviations. Parametric statistical tests for numerical data was done by using one-way ANOVA, followed by
multiple comparison post hoc LSD (p<0.05).
Correlation between serum leptin levels, food intake, Lee index and abdominal fat mass was tested using Pearson correlation test. Paired t-test (for daily food intake, Lee index and leptin serum levels) or the Wilcoxon signed rank test (for daily food intake OVX-HF
group) was used to analyze the differences in
values before and after being treated.
RESULTS
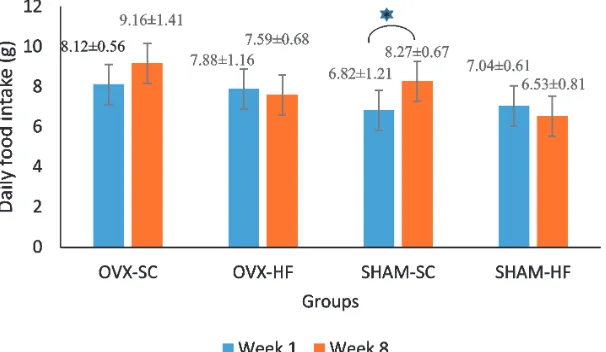
The daily food intake
The highest daily food intake was found in
OVX-SC group (9.71 ± 1.40 g) and the lowest was in the SHAM-HF group (6.68 ± 0.78 g). The statistical analysis showed a signiicant difference between the irst week and eighth
week of the SHAM-SC group, whereas in OVX-SC, OVX-HF and SHAM-HF groups were not found any signiicant differences (FIGURE 1).
FIGURE 1. The bar chart is the average daily food intake ± standard deviation in
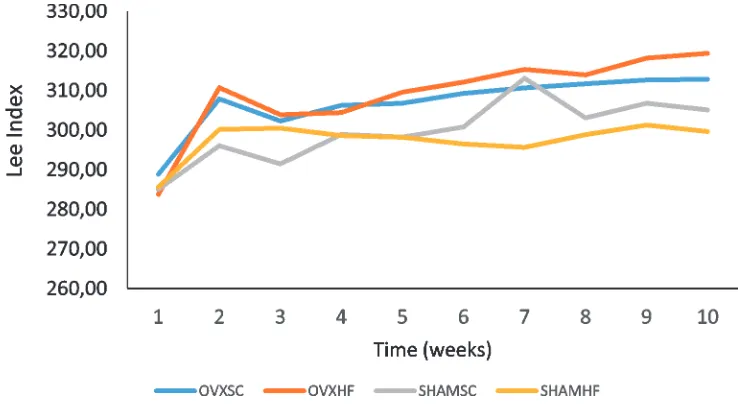
Lee Index
Lee index value in each treatment group in this research is shown on FIGURE 2.
FIGURE 2. First week to eighth week Lee index graph of diet treatment in each group.
OVXSC: groups of ovariectomized rat and given a standard diet; OVXHF: groups of ovariectomized rat and given a high-fat diet; SHAMSC: groups of non ovariectomized rat and given a standard diet; SHAMHF: groups of non ovariectomized and given a high-fat diet.
The results of paired t-test on the mean of Lee index before and after ovariectomy, as
well as before and after giving high-fat diet are shown in the TABLE 1.
TABLE 1. The mean ± standard deviation Lee index before ovariectomy, after ovariectomy and after givin high fat diet based on group
Group (n=7)
Lee Index
Beginning (before ovariectomy)
After Ovariectomy (before given high fat diet)
End (After given high fat diet)
OVX-SC 288.88 ± 16.48a 307.86 ± 5.56a 312.84 ± 6.94
OVX-HF 283.78 ± 6.19b 310.75 ± 6.21b 319.38 ± 8.23b
SHAM-SC 285.03 ± 7.33c 296.05 ± 6.56c 305.12 ± 4.37c
Abdominal fat mass
The mean value of abdominal fat mass in each group after treatment from the highest to
the lowest, the OVX-HF group (10.49 ± 3.79
g), SHAM-HF group (10.04 ± 1.60 g),
OVX-SC group (7.31 ± 2.76 g) and SHAM-OVX-SC
group (6.08 ± 2.41 g) are shown in FIGURE
3.
FIGURE 3. The bar chart abdominal fat mass mean ± standard deviation after
treatment. OVXSC: ovariectomy group and given a standard diet; OVXHF: ovariectomy group and given a high-fat diet; SHAMSC: non ovariectomy group and given a standard diet; SHAMHF: non ovariectomy group and were given a high fat diet. Signiicant differences between groups are marked by (*)
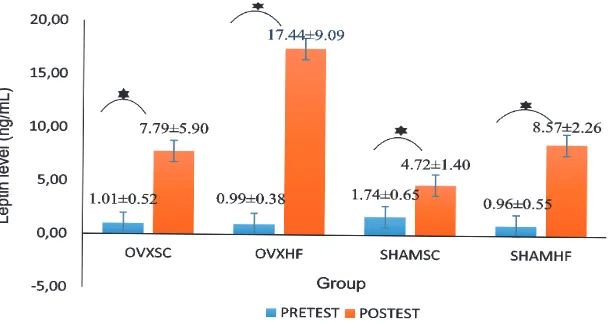
Levels of serum leptin
The mean value of leptin serum levels before and after treatment is shown in FIGURE 4. The highest increased serum
leptin levels was in OVX-HF group with an
average value increase of 16.45 ± 8.75 ng/mL,
and the lowest was in SHAM-SC group (2.98
± 1.61 ng/mL).
FIGURE 4. The bar chart serum leptin levels mean ± standard deviation before and after
DISCUSSION
The daily food intake dropped in rat fed a high-fat diet (OVX-HF and SHAM-HF groups), but this reduction was not
statistically signiicant. These results were
different from previous research by Lin et al.11 which explained the food intake in rat
fed a high-fat diet was higher than rat fed a standard diet since the 8th week after given a
high fat diet. A decreasing daily food intake in OVX-HF group is because the effect of leptin, seen from the increase in leptin serum
levels were very high (16.45 ± 8.75 ng/mL).
Leptin is a hormone that plays a role in energy homeostasis and have anorexigenic effects on the central nervous system.9 Leptin circulation
are transported to the brain, binds to the leptin receptor (ObRb) in the hypothalamus, activates the JAK-STAT3 pathway and lead to suppression orexigenic neuropeptides such as Neuropeptide Y (NPY) and
agouti-related protein (AgRP), which plays a
role in increasing food intake. In addition, activation of JAK-STAT3 results in increased production of anorexigenic neuropeptides as
Proopiomelanocortin (POMC) and Cocaine and Amphetamine-regulated Transcript
(CART), which plays a role in reducing food intake.13,14
A decreasing daily food intake in SHAM-HF group probably caused by the effects of the hormone estrogen. Estrogen acutely and chronically affecting energy homeostasis through inhibitory effects on food intake involving estrogen receptors (ERs) in the central nervous system. Estrogen also trigger an increase in the number of input stimulation to the POMC neurons in the ARC hypothalamus that produce anorexigenic neuropeptides.15-17
LSD posthoc analysis of the results showed that the difference in daily food
intake between irst week and the eight week
was higher in the SHAM-SC compared with
the SHAM-HF group. These results indicate
that the high-fat diet only inluence the non-ovariectomized group. The low daily food
intake in SHAM-HF group can be caused by the effects of leptin as an inhibitor of orexigenic neuropeptides.1 Another possibility is because
of the content of saturated fatty acids in the diet which is an important factor in the energy balance. Although the daily food intake on SHAM-HF group is low, but the daily energy intake is relatively higher than that given a standard diet. This is because of the high energy content of fat in the diet. Moreover,
fat also has the highest nutrient utilization eficiency compared to carbohydrates or protein, so the adequacy of energy intake is
achieved faster even though fewer.1,12
OVX-SC group has an increasing daily food intake, but this increase was not
statistically signiicant. An increase of daily
food intake in the group of OVX-SC is
probably caused by the inluence of estrogen deiciency due to ovariectomy. Estrogen has
an effect on food intake similar to leptin, and giving exogenous estrogen causes a decrease
of food intake in ovariectomized rat.18 Estrogen
is also known have a role in the regulation of orexigenic neuropeptides such as NPY and grelin, and anorexigenic neuropeptides like insulin, leptin and serotonin.19 In addition,
studies reveals that estrogen deiciency
causes excessive production of NPY in the hypothalamus and central leptin sensitivity disorders that causes an increase food intake and contributes to obesity.15
The results of paired t-test showed that
there was a signiicant increase in the value
of the index Lee before and after ovariectomy both in ovariectomy and non ovariectomy group. These results indicated that the increase
in the Lee index in rat was not only inluenced by estrogen deiciency. Estrogen deiciency
closely related with an increase of women body mass, meanwhile estrogen withdrawal through ovariectomy in rat can increase body mass and this condition can be balanced by estradiol therapy.13,20 Another study21 also
explains that the decline in estrogen levels along menopause is accompanied by weight gain, and a decrease in energy expenditure. But there are other factors that also affect the increase in body mass index in addition
to estrogen deiciency. Several factors affect
the body mass index in adults including the amount and composition of food consumed, age, physical activity, a decrease in the body’s metabolic or physiological changes related to menopause in women which enables an increase in body weight.22 Another study
explains that obesity is especially common in women, increased with age, and is closely
related to the frequency of consumption and
the amount of calories in food.23 From the
described studies, it is known that increasing
age has an inluence on an increase in body mass
index, especially in women. It is associated with a decrease in the body’s metabolism and physical activity which causes an increase in body mass index is easier to rise.23
In this study, physical activity in rat could
be assumed to be very low. The small size of cage (25 x 35 cm) caused the limited activity
of rat, so there is no excessive energy expens.
In addition, the availability and adequacy
of feed given to the rat also could be factor
inluencing the increase in body mass index.
Food and drink were always available inside the enclosure allowing the rat to consume at any time. Positive energy balance, when energy intake more than energy expenditure can cause an increase in body mass index and obesity.4
In the SHAM-HF group was no increase in the Lee index after a fat diet. Oppositely, the
Lee index decreased mean of 0.57 ± 7.20, but
this reduction was not statistically signiicant (p = 0.840). The reduction of Lee index in
SHAM-HF group was likely because the effect of anorexigenic estrogen. Estrogen is a steroid hormone that acts directly or indirectly in reducing food intake, increase energy expenditure and termogenesis.15 Estrogen is also suspected as a modulator of the anabolic action of leptin. High estrogen levels are associated with increased sensitivity of leptin
central characterized by high expression of the
leptin receptor (ObRb) in the arcuate nucleus (ARC) despite circulating leptin levels are not increased.13,24 The reduction of Lee index in
SHAM-HF group may also be caused by the
inluence of leptin. Brown et al.,15 explains that leptin in circulation will be transported to the brain, then leptin will bind to the leptin receptor (ObRb) in the hypothalamus. The bond between leptin and its receptor causes
activation of JAK/STAT which will trigger
the production of anorexigenic neuropeptides and inhibit orexigenic neuropeptides. Anorexigenic neuropeptides activation causes a decrease in appetite, increased energy expenditure and thermogenesis.10,15 The effect of anorexigenic neuropeptides which may indirectly lead to decrease on the Lee index in SHAM-HF group.
Examination of abdominal fat mass after treatment in this study showed no
signiicant difference between in both the ovariecvatomized and non-ovariectomized
group. The differences appeared only among the group given high-fat diet and a standard diet, which was between HF and OVX-SC groups and between SHAM-HF and SHAM-SC groups, which indicated that the differences caused by the provision of high-fat diet and it was not because of the effect of ovariectomy. These results are in contrast to some previous researches which explained
rat is accompanied by changes in energy homeostasis which leads to increased intraabdominal fat mass.24-26 However another
study27 described a similar result to this
research. Ovariectomy in rat and menopause that occurs in women, both are closely linked with increase body mass and total fat mass. But in ovariectomy, more fat will be stored in the subcutaneous compared to intra-abdominal.
The results showed that the group given a high-fat diet, having a mean abdominal fat mass, was higher than those given a standard diet. This is probably caused by the content of saturated fatty acids that existed in a high-fat diet. Studies in humans and animals showed that saturated fatty acids are more obesogenic than unsaturated fatty acids. It is because very little saturated fatty acids are used for energy and mostly stored in adipose tissue as triacylglycerols.12,28
Increased levels of leptin serum was
signiicant in the control group (SHAM-SC) that are likely due to the indirectly inluence
of estrogen.29 Studies explain that leptin levels
may be inluenced by estrogen, either directly
or indirectly, through changes in body weight. In addition, high levels of estrogen are closely linked to improved leptin central sensitivity in rodents.30,31 Other possibility that causes increase leptin levels in SHAM-SC group is subcutaneous fat produce more leptin than the visceral fat.13
Ovariectomy and high-fat diet in this study affected serum leptin levels, seen from
the signiicant differences between OVX-SC
and OVX-HF group, and between OVX-HF and SHAM-HF group. The results agreed with previous research suggesting that
high-fat diet given to ovariectomized rat may lead
to increased leptin serum levels which are
higher than non-ovariectomized rat and with
standard diet.1 Another study32 explains that
there are some things that can affect changes
in circulating leptin levels, such as changes in body weight, fasting and high-fat diet.
Increased serum leptin levels positively correlated with increased Lee index and abdominal fat mass, but negatively correlated with daily food intake. This indicates that
the high-fat diet given to ovariectomized or non-ovariectomized rat still heve not been
able to induce leptin resistance. In humans or even obese rat, leptin resistance is commonly found. Leptin resistance is a condition that indicates a decrease in the response to leptin and linked as compensation for increased levels of circulating leptin which takes place continuously in subjects with obesity.10,14 But in this study, there was no leptin resistance in
obese group which was categorized based on
the average value of the Lee index (groups of rats OVX-SC and OVX-HF), It was due to high levels of leptin but low of daily food intake.
Meanwhile, the positive correlation between elevated levels of serum leptin with Lee index and abdominal fat mass in this study have met with previous research that suggests that circulating leptin consentration is correlated with body mass index (BMI), fat percentage and total body fat mass.33-35
CONCLUSIONS
Overall, high-fat diet in ovariectomized
rats is a risk factor for obesity and impaired function of the hormone leptin. High-fat diet
in ovariectomized rats leads to an increase
in body mass index, abdominal fat mass and serum leptin levels, and a decrease in daily food intake which indicates that leptin resistance does not occur in this study.
Further research is needed to determine the
effect of high-fat diet in ovariectomized rats
such as SOCS-3, STAT3 and NPY in order to explain the mechanism of the leptin resistance on the subject of obesity.
ACKNOWLEDGEMENTS
The author is thankful to the Study Program of Basic Medical and Bomedical Sciences, Postgraduate Program, Faculty of Medicine, lecturers and Physiology staff at Universitas Gadjah Mada for the advice and favor.
REFERENCES
1. Correia AL Jr, Aguila MB, Mandarim-de-Lacerda CA, Faria TS. Effects of high-fat diet
on plasma lipids, adiposity, and inlammatory markers in ovariectomized C57BL/6 mice. Nutrition 2012; 28(3):316-23. http://dx.doi. org/10.1016/j.nut.2011.07.014
2. Yonezawa R, Wada T, Matsumoto N, Morita
M, Sawakawa K, Ishii Y, et al. Central versus peripheral impact of estradiol on the impaired
glucose metabolism in ovariectomized rat
on a high-fat diet. Am J Physiol Endocrinol
Metab 2012; 303(4):445-56. http://dx.doi. org/10.1152/ajpendo.00638.2011
3. Roepke TA. Oestrogen modulates
hypothalamic control of energy homeo-stasis through multiple mechanisms.
J Neuroendocrinol 2009; 21(2):141-50. http://dx.doi.org/ 10.1111/ j.1365-2826.2008.01814.x
4. Margetic S, Gazzola C, Pegg GG, Hill RA.
Leptin: a review of its peripheral actions and Interactions. Int J Obes Relat Metab Disord
2002; 26(11):1407-33.
5. Mushref MA, Srinivasan S. Effect of high
fat-diet and obesity on gastrointestinal motility.
Ann Transl Med 2013; 1(2):14.
6. Boonyaratanakornkit V, Pateetin P. The role of ovarian sex steroids in metabolic homeostasis, obesity, and postmenopausal breast cancer:
molecular mechanisms and therapeutic
implications. Biomed Res Int
2015;149196:1-14. http://dx.doi.org/ 10.1155/2015/140196.
7. Paracchini V, Pedotti P, Taioli E. Genetics of leptin and obesity: a HuGE review. Am
J Epidemiol 2005; 162(2):101-14. http:// dx.doi.org/10.1093/aje/kwi174
8. Morris DL, Rui L. Recent advances in understanding leptin signaling and leptin resistance. Am J Physiol Endocrinol Metab
2009; 297(6):1247-59. http://dx.doi.
org/10.1152/ajpendo.00274.2009
9. Kelesidis T, Kelesidis I, Chou S, Mantzoros
CS. Narrative review: the role of leptin in human physiology: emerging clinical
applications. Ann Intern Med 2010; 152(2):92-100. http://dx.doi.org/10.7326/0003-4819-152-2-201001190-00008
10. Dardeno TA, Chou SH, Moon HS, Chamberland JP, Fiorenza CG, Mantzoros
CS. Leptin in human physiology and
therapeutics. Front Neuroendocrinol 2010;
31(3):377-93. http://dx.doi.org/10.1016/j.
yfrne.2010.06.002.
11. Lin S, Thomas TC, Storlien LH, Huang XF. Development of high fat diet-induced obesity
and leptin resistance in C57Bl/6J mice. Int J Obes Relat Metab Disord 2000; 24(5):639-46. http://dx.doi.org/10.1038/sj.ijo.0801209
12. Hariri N, Thibault L. High-fat diet-induced
obesity in animal models. Nutr Res Rev 2010;
23(2):270-99. http://dx.doi.org/10.1017/
S0954422410000168
13. Park HJ, Ahima RS. Physiology of leptin: energy homeostasis, neuroendocrine
function and metabolism. Metabolism 2015;
64(1):24-34. http://dx.doi.org/10.1016/
j.metabol.2014.08.004
14. Ahima RS. Revisiting leptin’s role in
obesity and weight loss. J Clin Invest 2008;
118(7):2380-3. http://dx.doi.org/10.1172/
15. Brown LM, Clegg DJ. Central effects of
estradiol in the regulation food intake, body weight, and adiposity. J Steroid Biochem
Mol Biol 2010; 122(1-3):65-73. http://dx.doi. org/10.1016/j.jsbmb.2009.12.005
16. Gao Q, Mezei G, Nie Y, Rao Y, Choi CS,
Bechmann I, et al. Anorectic estrogen mimics leptin’s effect on the rewiring of melanocortin cells and Stat3 signaling in obese animals.
Nat Med 2007; 13(1):89-94. http://dx.doi. org/10.1038/nm1525
17. Gao Q, Horvath TL. Cross-talk between estrogen and leptin signaling in the hypothalamus. Am J Physiol Endocrinol
Metab 2008; 294(5):E817-26.
http://dx.doi.org/10.1152/ajpendo.00733. 2007
18. Pelleymounter MA, Baker MB, McCaleb M. Does estradiol mediate leptin’s effects on adiposity and body weight? Am J Physiol
1999; 276(5 Pt 1):955-63.
19. Fungfuang W, Terada M, Komatsu N, Moon C, Saito TR. Effects of estrogen on food intake, serum leptin levels and leptin mRNA expression in adipose tissue of female rats.
Lab Anim Res 2013; 29(3):168-73. http:// dx.doi.org/ 10.5625/lar.2013.29.3.168
20. Chen Y, Heiman ML. Increased weight gain after ovariectomy is not a consequence of
leptin resistance. Am J Physiol Endocrinol
Metab 2001; 280(2):E315-22.
21. Bryzgalova G, Lundholm L, Portwood
N, Gustafsson J, Khan A, Efendic S,et al. Mechanisms of antidiabetogenic and body weight-lowering effects of estrogen in high-fat diet-fed mice. Am J PhysiolEndocrinol Metab 2008; 295(4):E904-12. http://dx.doi.
org/10.1152/ajpendo.90248.2008
22. Asil E, Surucuoglu MS, Cakiroglu FP, Ucar
A, Ozcelik AO, Yilmaz MV, et al. Factors
That affect body mass index of adults. J Nutr
2014; 13(5):255-60.
http://dx.doi.org/10.3923/pjn.2014.255.260
23. Fouad M, Rastam S, Ward K, Maziak W.
Prevalence of obesity and its associated
factors in Aleppo, Syria. Prev Control 2006;
2(2):85-94. http://dx.doi.org/10.1016/j.
precon.2006.09.001
24. Jarvis FM, Clegg DJ, Hevener AL. The role of estrogens in control of energy balance
and glucose homeostasis. Endocr Rev 2013;
34(3):309-38. http://dx.doi.org/10.1210/
er.2012-1055
25. Carr MC. The emergence of the metabolic
syndrome with menopause. J Clin Endocrinol Metab 2003; 88(6):2404-11. http://dx.doi.
org/10.1210/jc.2003-030242
26. Toth MJ, Tchernof A, Sites CK, Poehlman ET. Effect of menopausal status on body composition and abdominal fat distribution.
Int J Obes 2000; 24(2):226-31. http://dx.doi. org/10.1038/sj.ijo.0801118
27. Gloy V, Langhans W, Hillebrand JJ, Geary N, Asarian L. Ovariectomy and overeating palatable, energy dense food increase subcutaneous adipose tissue more than intra-abdominal adipose tissue in rats.
Biol Sex Differ 2011; 2:6. http://dx.doi. org/10.1186/2042-6410-2-6
28. Storlien LH, Huang XF, Lin S, Xin X, Wang HO, Else PL, Dietary fat subtypes and obesity.
World Rev Nutr Diet 2001; 88:148-54. http:// dx.doi.org/10.1159/000059778
29. Pinilla L, Seoane LM, Gonzalez L, Carro E,
Aguilar E, Casanueva FF, et al. Regulation of serum leptin levels by gonadal function in
rats. Eur J Endocrinol 1999; 140(5):468-73. http://dx.doi.org/10.1530/eje.0.1400468 30. Bennett PA, Lindell K, Wilson C, Carlsson
LM, Carlsson B, Robinson IC. Cyclical variations in the abundance of leptinreceptors, but not in circulating leptin, correlate with NPY expression during the oestrous cycle.
31. Ainslie DA, Morris MJ, Wittert G, Turnbull H, Proietto J, Thorburn AW. Estrogen
deiciency causes central leptin insensitivity
and increased hypothalamic neuropeptide Y.
Int J Obes 2001; 25(11):1680-8. http://dx.doi. org/10.1038/sj.ijo.0801806
32. Weigle DS, Duell PB, Connor WE, Steiner RA, Soules MR, Kuijper JL. Effect of fasting, refeeding, and dietary fat restriction on plasma leptin levels. J Clin Endocrinol Metab
1997; 82(2):561-5.http://dx.doi.org/10.1210/ jcem.82.2.3757
33. Kobayashi J, Sasaki T, Watanabe M. The relationship of abdominal fat mass assessed
by helical or conventional computed tomography to serum leptin concentration.
J Atheroscler Thromb 2004; 11(3):173-9. http://dx.doi.org/10.5551/jat.11.173
34. Paul RF, Hassa M, Nazar HS, Gillani S, Afzal
N, Qayyum I. Effect of body mass index on serum leptin levels. J Ayub Med Coll
Abbottabad 2011; 23(3):40-3.
35. Considine RV, Sinha MK, Heiman ML,
Kriaugiunas A, Stephens TW, Nyce MR, et al. Serum immunoreactive-leptin concentration in normal weight and obese humans. N Engl