ACCESS TIME OF EMERGENCY VEHICLES UNDER THE CONDITION OF
STREET BLOCKAGES AFTER A LARGE EARTHQUAKE
N. Hirokawa a*, T. Osaragi b
a Dept. of Mechanical and Environmental Informatics, Tokyo Institute of Technology, Meguro-ku, Tokyo, - [email protected]
b School of Environment and Society, Tokyo Institute of Technology, Meguro-ku, Tokyo, - [email protected]
KEY WORDS: Earthquake, Street Blockages, Agent-based Simulation, Emergency Vehicle, Accessibility, Information Collection
ABSTRACT:
The previous studies have been carried out on accessibility in daily life. However it is an important issue to improve the accessibility of emergency vehicles after a large earthquake. In this paper, we analyzed the accessibility of firefighters by using a microscopic simulation model immediately after a large earthquake. More specifically, we constructed the simulation model, which describes the property damage, such as collapsed buildings, street blockages, outbreaks of fires, and fire spreading, and the movement of firefighters from fire stations to the locations of fires in a large-scale earthquake. Using this model, we analyzed the influence of the street-blockage on the access time of firefighters. In case streets are blocked according to property damage simulation, the result showed the average access time is more than 10 minutes in the outskirts of the 23 wards of Tokyo, and there are some firefighters arrive over 20 minutes at most. Additionally, we focused on the alternative routes and proposed that volunteers collect information on street blockages to improve the accessibility of firefighters. Finally we demonstrated that access time of firefighters can be reduced to the same level as the case no streets were blocked if 0.3% of residents collected information in 10 minutes.
1. INTRODUCTION
In the field of street-network analysis, many studies have been carried out on traffic congestion and optimization strategies for route assignment. For instance, Li et al. (2009) analyzed the probe car data for 57 days in Beijing, and detected recurrent congestion points in each time/day. This method enables us to detect the rule of congestion by controlling conditions pertaining to time, place, and so forth. Also, Claes et al. (2011) described a routing strategy based on forecast information. This strategy forecasts the locations of vehicles using the delegate multi-agent system. The result of the simulation using forecast information showed vehicles travel 35% more efficiently than the other strategies using real-time data. In addition, this strategy has high scalability and, thus, takes practical advantage since it was described through decentralized architecture.
These studies focused on accessibility in daily life, but it is also important to analyze the accessibility on street networks after a large earthquake in Japan. After a large earthquake, rubbles of collapsed buildings block many narrow street, and street blockages obstruct the smooth accessibility of emergency vehicles. Additionally, the demands for the emergency transportation increase since many fires occur at the same time in different places, and many people are injured. In these circumstances, the accessibility of emergency vehicles is one of the most important issues for mitigating disaster.
Hence, there are many studies on emergency vehicles for fire brigades and health services under the condition after a large-scale earthquake occurs. For instance, Sekizawa et al. (2008, and 2009) constructed the simulation system, which contains firefighting operations model and fire spreading model. They analyzed the relationships between the damage from fire
* Corresponding author
spreading and the strategy of firefighting. We can execute the simulation in a wide area in a comparatively short calculation time by using a grid spacing of 250 meters. However, it is difficult to make a detailed analysis considering the influence of street-blockages on the accessibility. In addition, Ertugay and Duzgun (2006) proposed three indices (the zone-based technique, the isochrones-based technique, and the raster-based technique) and analyzed the access time from the locations of emergency services, fire brigades and health services. There are some differences of calculation time and parameters. However, these approaches might underestimate the access time because impassable streets caused by street blockages were not considered. Furthermore, Kugai and Kato (2007) proposed the method to evaluate disaster mitigation performance in the street network by considering the distribution of the passable probability for fire engines. However, this study focused on not supporting firefighting activities just after a disaster but on the urban development and improvement.
In this paper, we analyze the accessibility of firefighters immediately after a large earthquake by using a microscopic simulation model. More specifically, we construct simulation models, which describe the property damage and the movement of firefighters from fire stations to the locations of fires via water sources. We integrate these models, agent technology, GIS technology, a geo-database, and routing algorithm in similar way in Wang and Zlatanova (2016). Using this system, we analyze the influence of the street-blockage from the viewpoint of the access time of firefighters. Additionally, we focus on the alternative routes and propose that volunteers collect information on street blockages to improve the accessibility. Finally we demonstrate the effects of collecting street-blockage information on reducing the access time of firefighters. The originality of our research is
little to consider the moving obstacles and many destination for one responder, TSP or MTSP, since we focused on assisting for firefighters immediately after an earthquake occurrence.
In this paper, we attempt to (1) focus on the accessibility of firefighters immediately after an earthquake, (2) consider not only the single hazard but also the multi-hazards (such as collapsed buildings, street blockages, and fire spreading) (3) construct microscopic simulation model that can be estimated a single collapsed building, single street blockage, and so forth, and (4) propose the information collection and demonstrate the effects.
2. MODELING FIREFIGHTERS’ ACTIVITIES
AND PROPERTY DAMAGE IN A LARGE EARTHQUAKE
2.1 Modeling of Firefighters’ Activities
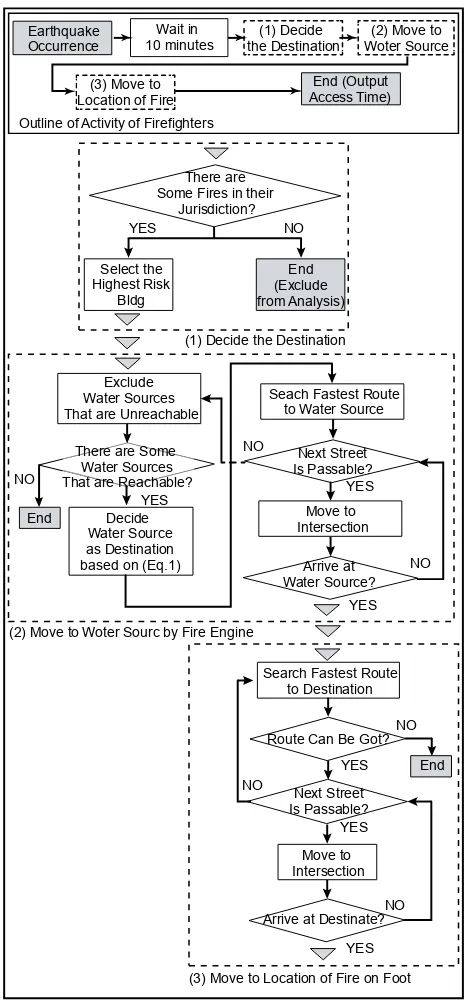
It is highly important that firefighting activities are performed immediately after outbreaks of fires in order to decrease the damage of fire spreading. Hirokawa and Osaragi (2015) analyzed the relationships between the elapsed time from outbreaks of fires and fire scales using a fire spreading simulation. The result indicated that firefighters arrive at the location of the fire within an average of 26 minutes from the outbreak of the fire or they cannot prevent its spread. Moreover, according to the Tokyo Fire Department, firefighters should remain at the fire station for a certain period of time to grasp the condition of the locations and the risk of fires. Thus, they have only about 10 minutes to move to the location of the fire. Considering the above background, we model firefighters’ activities, which are moving to the locations of fires from a fire station, immediately after an earthquake occurrence by using agent-based technology. Specifically, firefighter first moves to a water source (dynamic destination), and when he/she arrives, moves to the location of fire (static destination). That is because the optimal water source is dynamically changed by the locations of streets blockages, which firefighter knows. Firefighters search the fastest path on the street network which they think passable by using A* algorithm. Also, they search the fastest routes again when they are obstructed by street blockages (Figure 1). The followings are more details of the model and assumptions.
-Firefighters remain at their fire stations for 10 minutes after an earthquake to grasp the locations and the risk of fires.
-Firefighters move to the building, which has highest fire spread risk estimated by fire spreading simulation, in their jurisdiction. -Fire engines move with a certain velocity (speedv) based on street width, and firefighters move with 10 km/h (speedf) on all streets.
-Firefighters move to an optimum water source, such as a pool and a fire cistern, by a fire engine. From the water source, firefighters move to the location of the fire on foot. The optimum water source is defined by the Equation 1.
arg min , , , 1
where ows is the optimum water source. WS is the group of all water sources. D (A,B) is the distance between the location of A and B.
f, w, and fi are the location of the firefighter, the location of a water source, and the location of the fire correspondingly.
speedV, and speedf is the speed of fire engine, and firefighter respectively.
-In case the firefighters cannot arrive at the water source due to street blockage, the water source are excluded from the WS, and the destination is changed to another one based on Eq.1. -Firefighters try to move the fastest path on the street network in
the condition that all streets are passable. When they find street blockages on the way to the destination, they memorize the locations of street blockages.
-When they cannot move on their route due to street blockages, they try to search another fastest route except the impassable streets they have already known.
-One trial of simulation is that all firefighters arrive at the location of the fire or they notice that they cannot arrive due to street blockages.
Figure 1. Firefighters’ model (Agent-based model) (1) Decide the Destination
(2) Move to Woter Sourc by Fire Engine
(3) Move to Location of Fire on Foot Outline of Activity of Firefighters
End
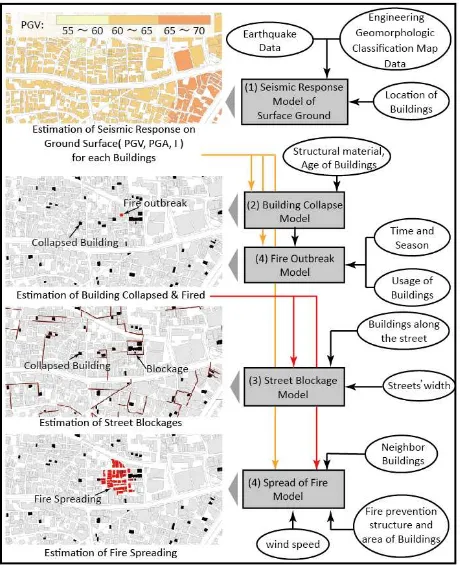
2.2 Modeling of Property damages
Figure 2 summarizes the outline of the property damage models integrated by Hirokawa and Osaragi (2016). The models consist of the following models proposed in the previous studies: (1) the model of seismic response of surface ground (Si and Midorikawa, 1999) and (Midorikawa et al., 1994), (2) the building-collapse model (Murao and Yamazaki, 2000), (3) the model of street blockage (Ieda et al., 1998), and (Ministry of Land, Infrastructure and Transport, 2003), (4) the fire-outbreak model and the fire spread speed model (Tokyo Fire Department, 1997), (Tokyo Fire Department, 2005), and (Tokyo Fire Department, 2001). Also, we use the Nationwide 7.5-Arc-Second Japan Engineering Geomorphologic Classification Map (Matsuoka and Midorikawa, 1994), (Fujimoto and Midorikawa, 2003), (Wakamatsu and Matsuoka, 2008), and (Matsuoka and Wakamatsu, 2008), and the data of buildings and streets based on condition of land use survey conducted in 2011 as GIS data.
First, subsurface-ground data on 250 m cell, building data, and epicenter data are input into the surface-ground seismic-response model to estimate surface-ground responses such as the peak-ground velocity (PGV), and peak-peak-ground acceleration (PGA). Next, building collapses are estimated based on PGV, structural material, and age of the buildings. In addition, street blockages caused by collapsed buildings along the streets are estimated. Moreover, the probability of a fire outbreak is estimated based on building usage, earthquake intensity, the season, the time, and building collapses. Finally, burnt down buildings are estimated by the structural material, the area, the PGA of the building, the distance of the neighbor building, and wind speed.
Figure 2. Outline of property damage model
3. ESTIMATION OF ACCESS TIME OF THE
FIREFIGHTERS IN A LARGE EARTHQUAKE 3.1 Assumption for the Simulation and the Results of Property Damage
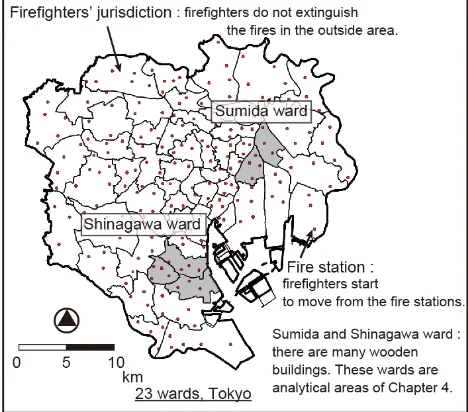
In this paper, we focus on the 23 wards of Tokyo, in which there are many typical high-density wooden residential areas (Figure 3). On the basis of the damage assumption (Tokyo Metropolitan Government, 2012), we assume that North Tokyo Bay Earthquake (M 7.3), which is considered to cause the most critical damage, occurs on 6 p.m. in winter. The other are as follows.
-Epicenter : North Tokyo Bay ( latitude : 35.3200 degrees, longitude : 140.1400 degrees )
-Moment magnitude : 7.3
-Depth of epicenter : 1 km upper the Philippine Sea plate -Length and width of the fault : 63.64 km, 31.82 km -Strike and dip of the fault : 296 degrees, 23 degrees -Fault type : relative plate
Figure 4 shows the result based on 100 times of Monte Carlo simulations using models of the property damage, such as building collapse and the street blockage, under above assumptions. The simulation result shows about 80 thousands buildings, about 5% of all buildings in the whole area, are collapsed and about 13% of streets are blocked in average (Table 5). An example of spatial distribution of property damages is shown in Figure. 6.
Next, using 100 samples of property damage, we estimate the access time for firefighters in each pattern under the following cases: (A) streets are blocked according to property damage simulation results, or (B) streets are blocked but the locations of street blockages are known. As a comparison to those cases, we also estimate the access time for a case (C) no streets are blocked. Figure 7 shows an example of the route from the fire station to the location of the fire for case (A) to (C). Firefighters cannot arrive at the location of the fire in 10 times in average. In these samples, they cannot arrive whether in case (A) or (B). Thus, we exclude the samples from the analysis to calculate the average access time.
To help describe the condition of the simulation, Wang and Zlatanova (2013) propose the following form of a quadruple.
<X1, X2, X3, X4>
where X1 is the number of responders (one or many). X2 is the number of destinations (one or many). X3 is the type of the destinations (static or dynamic). X4 is the type of the obstacles (static or moving).
According to the taxonomy, we considered the case <o, O, S & D, s>.
Figure 3. Analytical areas
Figure 4. Ratio of collapsed buildings or street blockages to the total number
Table 5. Summary of property damage
Figure 6. Example of collapse buildings and street blockages
Figure 7. Example of the routes of firefighter
3.2 Influence of Streets Blockage on Accessibility of Firefighters
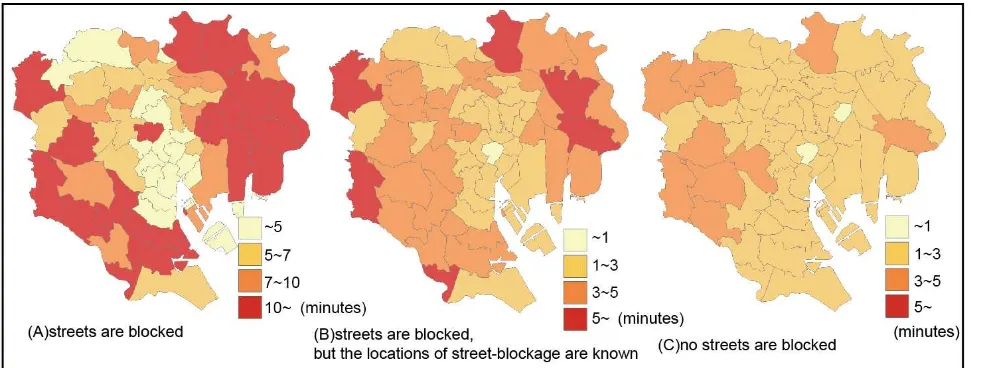
In case (A), the firefighter encounters blocked streets around the fire station several times (Figure 7). As is shown in Figure 8, there is no firefighter that arrive later than 5 minutes in case (C). However, the average access time in case (A) is more than 10 minutes in the outskirts of the 23 wards of Tokyo, and there are some firefighters arrive over 20 minutes at most. This result indicates that firefighters might not be able to extinguish fires in the outskirts of the 23 wards of Tokyo even if they can reach the fire’s location.
3.3 Effects of Information on the Locations of Street Blockages
If firefighters can get the information on the locations of street blockages before leaving the fire stations, they might be able to select the alternative route to avoid street blockages and arrive at the location of the fire smoothly. Therefore, we attempt to discuss a case in which all the locations of street blockages are known ~10%
10%~20%
20%~30%
~30% ~5%
5%~10%
10%~15%
~15%
(1) Spatial Distribution of Collapsed Buildings
(2) Spatial Distribution of Street Blockages
Fire Station Location of Fire
Water Source for Fire Defense
Route (C) 2.16 minutes
Route (A) 4.52 minutes
Route (B) 2.94 minutes
Collapsed Building
Route to Water Source by Fire Engine & to Buring Building on Foot Street-blockage
Route C : No Street Blockage Route A : Street Blockage Route B : Disaster information
before leaving the fire stations (case (B)). In particular, the firefighters are assumed to be able to search the route with only passable streets and move to the location of the fire via the fastest route.
The simulation result shows that the mean access time is five minutes or less in almost all of the analytical areas. This is the same level as no street blockages (case (C)) and there is little dependence on spatial characteristics. Thus, the information on the locations of street blockages can improve firefighters’ accessibility effectively. In the Chapter 4, we will discuss the strategies of collecting information.
4. EFFECTS OF STREET BLOCKAGE
INFORMATION COLLECTED BY VOLUNTEERS
4.1 Overview of Collecting Information
There are some methods to collect disaster information. For instance, motion-images from high altitude, sensors equipped on buildings and streets, looking down by helicopter, patrolling by firefighters and volunteer fire corps, etc. However, it is difficult to cover wide-area by motion-images analysis from high altitude and sensors on buildings or streets. Also, it takes a long time before start of searching by helicopter. Thus, these methods have the problems of accuracy, urgency and completeness (Sugii, 2008).
By contrast, patrolling by firefighters and volunteer fire corps has an advantage of accuracy and collecting speed and, it requires no special equipment. In the Great Hanshin-Awaji Earthquake in 1995, firefighters and volunteer fire corps used the similar method by using wireless telephones (Sugii, 2008). However, firefighters and volunteer fire corps have to play a crucial role of rescue and extinguishing fire immediately after an earthquake occurs.
In this paper, we consider the method of collecting information on street blockages by local residents, who register as members of the volunteers after a large earthquake. We focus on two wards (Sumida-Ward and Shinagawa-Ward) out of 23 wards due to calculation time in following sections. Table 9 summarizes characteristics of these areas.
Table 9. Summary of sumida-ward and shinagawa-ward
4.2 Modeling of Information Collection
We assume volunteers have 10 minutes to collect information on street blockages, and firefighters leave the fire station for the location of the fire after 10 minutes since a large earthquake occurs. That is because Tokyo Fire Department has the policy, wherein firefighters should not leave their fire station for a certain period of time with the exception of the case that fire breaks out in high risk area. Moreover, we construct two different models of the behavior of collecting information by volunteers as shown in Figure 10 and Figure 11.
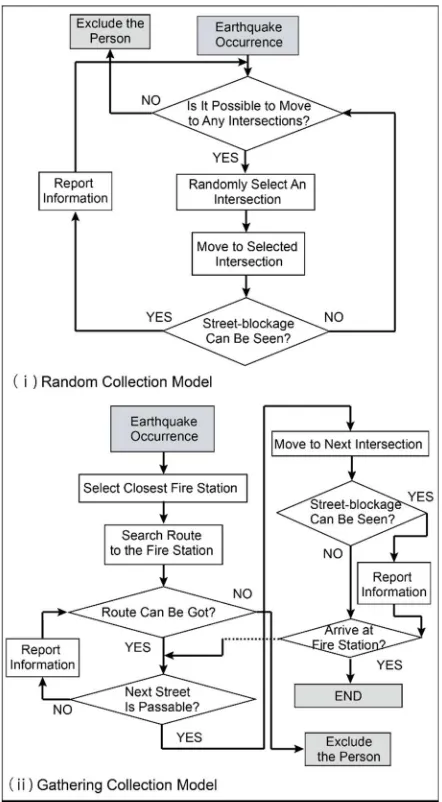
(1) Random Collection:
-Volunteers collect information while moving around there randomly.
-With the exception of the case that they encounter a dead-end or street blockages, volunteers walk on the streets which they have not passed through.
(2) Gathering Collection:
-Volunteers collect information while moving to the nearest fire station from their own locations.
-After volunteers arrive at the fire stations, they finish collecting information, and they stay in the fire stations.
In addition, we assume the followings in both models.
-Volunteers use applications, which bear similarity to Wase (Wase, 2006), in order to collect information. Additionally, the applications are taken into account the situation in an earthquake, for instance this system can save the battery and Figure 8. Spatial distribution of access time of firefighters in case A to C
work on the band limitation that causes the communication delay on mobile phone (Niwa et al., 2015)
-Because of improvements at the cellular base station, the internet connections is not completely broken down.
-In an earthquake, volunteers can communicate through the server since data contains only latitude, longitude and time. -The information is posted to the system on the cloud server, and
shared with all of volunteers and firefighters.
-Volunteers search for the street blockages when they reach each intersection.
-The time required for posting the information is 30 seconds, and volunteers start to collect information again after they finish posting.
-Volunteers do not post the same information because posted information is shared among them.
-The locations of volunteers just after an earthquake occurs are uniformly distributed following the locations of intersections. -Volunteers start to move immediately after an earthquake.
Figure 10. Collecting information model (Agent-based model)
Figure 11. Example of collected information
4.3 The Difference between two Strategies
In case that volunteers collect the information while moving toward fire stations, which is called Gathering Collection, the ratio of shared information on street blockage (RoSIS) converges to about 50% in both areas (Figure 12). The RoSIS is defined by the Equation 2.
, (2)
where CSB is the number of street blockages collected by volunteers.
TSB is the total number of street blockages in whole area.
The reason is redundant information near the fire stations and volunteers do not collect information after arriving at fire stations. On the other hand, if volunteers collect information while moving around there randomly, which is called Random Collection, the ratio of shared information reaches about 70% in Sumida ward, and about 80% in Shinagawa ward. That is because there are a few overlaps in the information since a low number of volunteers collect information in the widespread area homogenously.
Next, we discuss the characteristics of the collected information. In case of Random Collection, the information is prone to be collected discontinuously and dispersively. On the other hand, the information is prone to be collected as the available route radiates from fire stations in Gathering Collection. A similar tendency can also be seen concerning access time and RoSIS in both areas. This result indicates that the access time is affected not only by characteristics of strategies for information collection, but also by amount of information. However, the performance will be improved, if volunteers search the street blockages after they arrive at a fire station in Gathering Collection.
Gathering Collection
Fire Station Collected
Street-blockage
Routes of Volunteers
Random Collection
Fire Station
Figure 12. Difference between the two strategies
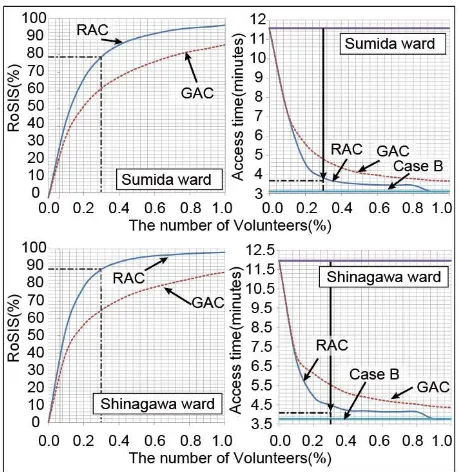
4.4 The Relationship between the Number of Volunteers and Accessibility of Firefighters
Figure 13 shows the relationships between the number of volunteers who collect information on street blockage and the access time to the locations of fires. Even if about 0.3% of the residents collects the information, RoSIS reaches about 80% in Sumida ward, and about 70% in Shinagawa ward. Moreover, Figure 13 indicates that enough information can be provided, since the access time converges toward the lower limit, which is the access time in case B in both areas (RAC).
Figure 12 shows that the ratio of shared information on street blockages is about 15% in Sumida ward and about 20% in Shinagawa ward immediately after 0.2% of volunteers start to collect information. The result indicates much information can be provided with little burden, for instance volunteers post only the road condition in front of their houses.
5. SUMMARY AND CONCLUSIONS
We focused on the accessibility of firefighters immediately after a large earthquake and analyzed the influence of street blockages, and effects on information collection quantitatively. First, we constructed the microscopic simulation model, which describes the property damage to estimate the condition of single building or road, and the movement of firefighters from fire stations to the locations of fires after a disaster occurs.
Using this model, we executed the simulation in which the North Tokyo Bay Earthquake (M 7.3) was assumed to occur on 6 p.m. in winter. The simulation result showed the average access time of firefighters was about 10 minutes in the outskirts of the 23 wards of Tokyo, and at most over 20 minutes. In case firefighters have the information on street blockages, the simulation result showed that the accessibility of firefighters might be improved.
Figure 13. Relationship between the number of volunteers and access time of firefighters and RoSIS
Therefore, we proposed the information collection by volunteers and evaluated the effects on improvement of accessibility. In particular, compared with Gathering Collection, volunteers collected the information efficiently because there are a few overlaps of the information in Random Collection. In addition, the access time could also be reduced to the same level as the case no streets were blocked if 0. 3% of residents collected information for 10 minutes. Furthermore, it might be possible that much information was obtained with little burden, for instance volunteers posted only the situation in front of their houses.
However, we should analyze other strategies of collecting information, such as volunteers do not finish searching after they arrive at fire stations, and volunteers collect information while moving to the nearest refuge area from their own locations. Another important task for the authors is to improve the property damage model. For instance, the street blockage by the traffic congestion, and street blockages changing dynamically by fire are not taken into account in street blockages model. These may be our future works.
ACKNOWLEDGEMENTS
The authors would like to express sincere thanks to the Tokyo Fire Department for providing a portion of the data used in the study. A portion of this paper was published in the Journal of Architectural Planning and Engineering (Architectural Institute of Japan), in an article entitled “Information Collection of Street Blockage after a Large Earthquake for Reducing Access Time of Fire Fighters”, 80, pp.465-473, 2015 (in Japanese).
REFERENCES
Claes, R., T. Holvoet, and D. Weyns, 2011. A Decentralized Approach for Anticipatory Vehicle Routing Using Delegate Multiagent Systems, IEEE transactions on intelligent transportation systems, Vol.12, no.2, pp.364-373.
Ertugay, K., and S. Duzgun, 2006. Integrating Physical Accessibility of Emergency Establishments into Earthquake Risk Assessment, Engineering Conferences International
Fujimoto, K., and S., Midorikawa, 2003. Average Shear-Wave Velocity Mapping throughout Japan Using the Digital National Land Information, Journal of Japan Association for Earthquake Engineering, vol.3, pp. 13-27 (in Japanese)
Hirokawa, N., and T. Osaragi, 2015. Fire Spread Indices and Its Application for Supporting Fire Fighters, Papers and proceedings of the Geographic Information Systems Association,
Tokyo, Japan (in Japanese)
Hirokawa, N., and T. Osaragi, Earthquake Disaster Simulation System: Integration of Models for Building Collapse, Road Blockage, and Fire Spread, Journal of Disaster Research, Vol.11, No.2, 2016.
Ieda, H., T. Mochizuki, and S. Kaminishi, 1998. Assessment of Vulnerability of Urban Areas to Street-Blockades Caused by Quake-Collapsed Buildings, International Association of Traffic and Safety Sciences review, vol.23, No.3, pp. 138-145. (in Japanese)
Kugai, T., and T. Kato, 2007. The Structure of Disaster Mitigation Performance of Road Network from the Viewpoint of Road Blockade - the Basic Study on the Evaluation of Disaster Mitigation Performance of the Local Area Road Network Based on Percolation Theory, Journal of Architecture and Planning, 615, pp.113-120. (in Japanese)
Li, M., Y. Zhang, W. Wang, 2009. Analysis of Congestion Points based on Probe Car Data, Proceedings of the 12th International IEEE Conference on Intelligent Transportation Systems, St. Louis, USA.
Matsuoka, M., and S. Midorikawa, 1994. The Degital National Land Information and Seismic Micro Zoning, The 22nd Symposium of Earthquake Ground Motion, Architectural Institute of Japan, pp. 23-24 (in Japanese)
Matsuoka, M., and K. Wakamatsu, 2008. Average Shear-wave Velocity (Vs30) Map Based on the 7.5-arc-second Japan Engineering Geomorphologic Classification Map, National Institute of Advanced Industrial Science and Technology, H20PRO-936 (in Japanese)
Midorikawa, S., M. Matsuoka, and K. Sakugawa, 1994. Site effects on strong motion records observed during the 1987 Chiba-Ken-Toho-Oki, Proceeding of 9th Japan Earthquake Engineering Symposium
Ministry of Land, Infrastructure and Transport, 2003. Developments of Technology and Evaluation index of Disaster Mitigation for planning Local Areas. (in Japanese)
Murao, O., and H. Yamazaki, 2000. Development of Fragility Curves for Buildings Based on Damage Survey Data of a Local Government After the 1995 Hyogoken-nanbu Earthquake,
Journal of Structural and Construction Engineering, 527, pp. 189-196. (in Japanese)
Niwa, I., T. Osaragi, T. Oki, and N. Hirokawa, Development of Real Time Synchronous Web Application for Posting and Utilizing Disaster Information, ISCRAM 2015 Conference - Kristiansand, May 2015
Osaragi, T., N. Hirokawa, and T. Oki, Information Collection of Street Blockage after a Large Earthquake for Reducing Access Time of Fire Fighters, Journal of Architecture and Planning, vol.80, pp. 465-473, March 2015 (in Japanese)
Sekizawa, A., K. Sasaki, K. Sugii, T. Yamase, S. Zama, and M. Endo, 2009. Comparison Analysis of Mitigation Effect of Fire Spread by Initial Turn-out System of Fire Brigades against Simultaneous Multiple Fires following an Earthquake,
Proceedings of the annual conference of the Institute of Social Safety Science, 25, pp. 5-6. (in Japanese)
Sekizawa, A., K. Sasaki, T. Yamase, S. Zama, M. Endo, and H. Okabe, 2008. Risk Analysis of Fire Spread Potential caused by Post-earthquake Fires Using Real Time Fire Spread & Firefighting Simulation Model, Proceedings of the annual conference of the Institute of Social Safety Science, 23, pp. 1-4. (in Japanese)
Si, H., and S. Midorikawa, 1990. New Attenuation Relationships for Peak Ground Acceleration and Velocity Considering Effects of Fault Type and Site Condition, Journal of Structural and Construction Engineering, 523, pp. 63-70 (in Japanese)
Sugii, K., A. Sekizawa, H. Okabe, M. Endo, S. Zama, and K. Araiba, 2008. Necessity of Structuring an Effective Scheme of Acquiring Disaster Information by Fire Departments Just After an Earthquake, Journal of Social Safety Science, 10, pp. 89-96. (in Japanese)
Tokyo Fire Department, 1997. Provision and Elucidation of New Factor of Fire and Fire Spread Behavior Considering Inland Earthquakes, Report of Fire Prevention Council (in Japanese)
Tokyo Fire Department, 2005. Provision and Elucidation of Risk Factor after Large Earthquake in Civilization, Report of Fire Prevention Council. (in Japanese)
Tokyo Fire Department, 2001. Development and Application of Evaluation Method for Preventing Ability of Earthquake Fire,
Report of Fire Prevention Council. (in Japanese)
Tokyo Metropolitan Government, 2012. Estimation of earthquake damage in Tokyo, Tokyo, Japan
http://www.bousai.metro.tokyo.jp/taisaku/1000902/1000401.ht ml (accessed May. 18, 2016) (in Japanese)
Wakamatsu, K., and M. Matsuoka, 2008. Construction of the 7.5-arc-second Japan Engineering Geomorphologic Classification Map, Summaries of technical papers of Annual Meeting Japan Association for Earthquake Engineering, pp. 222-223 (in Japanese)
Waze, 2006, Waze - GPS, Maps & Traffic, https://play.google.com/store/apps/details?id=com.waze&hl=en (accessed May. 18, 2016)
Wang, Z., and S. Zlatanova, 2013, Taxonomy of Navigation for First Responders, In: J. Krisp (Eds.) Progress in Location-Based Services, LNG&C, Springer, Heidelberg, New York, Dordrecht, London, pp. 297-315
Wang, Z., and S. Zlatanova, 2016, Multi-agent based path planning for first responders among moving obstacles,
Computers, Environment and Urban Systems, 56, pp. 48-58