AUTOMATIC INTERPRETATION OF HIGH RESOLUTION SAR IMAGES:
FIRST RESULTS OF SAR IMAGE SIMULATION FOR SINGLE BUILDINGS
J. Tao*, G. Palubinskas, P. Reinartz
German Aerospace Center DLR, 82234 Oberpfaffenhofen, Germany
(Junyi.Tao, Gintautas.Palubinskas, Peter.Reinartz)@dlr.de
KEY WORDS: SAR interpretation, SAR simulation, line extraction, line matching, change detection
ABSTRACT:
Due to the all-weather data acquisition capabilities, high resolution space borne Synthetic Aperture Radar (SAR) plays an important role in remote sensing applications like change detection. However, because of the complex geometric mapping of buildings in urban areas, SAR images are often hard to interpret. SAR simulation techniques ease the visual interpretation of SAR images, while fully automatic interpretation is still a challenge. This paper presents a method for supporting the interpretation of high resolution SAR images with simulated radar images using a LiDAR digital surface model (DSM). Line features are extracted from the simulated and real SAR images and used for matching. A single building model is generated from the DSM and used for building recognition in the SAR image. An application for the concept is presented for the city centre of Munich where the comparison of the simulation to the TerraSAR-X data shows a good similarity. Based on the result of simulation and matching, special features (e.g. like double bounce lines, shadow areas etc.) can be automatically indicated in SAR image.
* Corresponding author.
1. INTRODUCTION
Because of the all-weather and all-time data acquisition capabilities, high resolution space borne Synthetic Aperture Radar (SAR) plays an important role in remote sensing applications like change detection, earth mapping etc.. However, because of complexity of buildings urban area in SAR image is often hard to interpret.
SAR simulation technique eases visual interpretation of SAR images. Different concepts for SAR simulation are differentiated and classified in (Balz, 2010). Additional optical simulation helps identification of objects in the SAR image (Tao et al., 2011). However, an automatic interpretation of SAR image is still a challenge.
With an edge detector (Touzi et al., 1988) lines can be detected in SAR images. Some other special features like roads (Tupin et al., 1998) and double bounce lines (Wegner et al., 2010) can be directly extracted from SAR images.
In this paper, we use the simulation and geocoding algorithm as proposed in (Tao et al., 2011). To analyse the influence of neighbouring buildings in SAR images, we generate a digital elevation model (DEM) using a single building model for simulation. Additionally, we extract line features from the simulated and real SAR image and use them for the matching of both images. An analysis of the features in SAR images using exactly overlaid simulated images is presented thereafter. The paper is structured as follows. In section 2 the method for single building model generation and simulation is presented. Section 3 shows line extraction and matching of the simulated image and the real SAR image. Section 4 shows the result of the simulation, line extraction, matching and the associated analysis. Finally the paper is concluded in section 5 and ended with outlook.
2. SIMULATION FOR SINGLE BUILDING
For the interpretation of SAR image, simulation technique using a digital surface model (DSM) is proposed in (Tao et al., 2011). The open-source ray tracing software POV-Ray is used for simulation of optical image. A SAR simulator RaySAR (Auer et al., 2010), which has been developed at Remote Sensing Technology, Technische Universität München (TUM), is used for SAR simulation. Both simulated images are automatically geocoded and show good similarity to the real SAR image. However, for urban areas, where man-made objects with different height, building-materials, shape of roof etc. stand close to each other, it is still difficult to identify signals for single buildings. Reflexions from different buildings are mixed in the SAR image and can be hardly differentiated.
For a better analysis of the influence of neighbouring buildings in SAR images, we divide the DSM into single buildings and perform a simulation with the same algorithm described in (Tao et al., 2011).
2.1 Generation of single building model from DSM
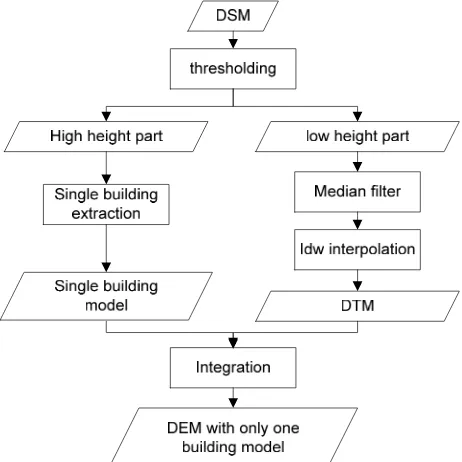
In order to divide the DSM, we create a histogram for the whole image. We assume that the ground of the DSM area is relatively flat, so that a threshold value of height can be easily chosen to divide the DSM into two parts: high height part and low height part (ground level).
The ground level part has holes in the places of buildings. Because of the one selected threshold value, there can be still noise around the boundaries of the holes. A median filter is used to compensate the noise. After that, the holes are interpolated using inverse distance weighted (IDW) interpolation. Using this processing we obtain a digital terrain model (DTM).
The high height part contains only buildings. The connected pixels with height values are considered to represent a single International Archives of the Photogrammetry, Remote Sensing and Spatial Information Sciences, Volume XXXVIII-4/W19, 2011
building and are extracted and integrated with the processed DTM. The result is a digital elevation model (DEM) with only one building model.
The processing chain is shown as a flowchart in Figure 1.
Figure 1. Methodology for generation of a DEM with only one building model from a DSM
2.2 Processing of simulated images for single building model
The DEMs with single building models together with real SAR image acquisition parameters (e.g. azimuth and incidence angles, pixel size) are used as input data for SAR simulation. The results are simulated SAR images for single buildings. A detailed description of the simulation can be found in (Tao et al., 2011). It has to be mentioned that all the geometrical parameters (e.g. position of camera and light source) for the simulation of single building model are defined the same for the simulation of the whole DSM. As a result, we obtain a simulated image with the same size and orientation as the simulated image using the whole DSM.
Based on the geoinformation of the DSM, the geocoding of the simulated image is performed as in (Tao et al., 2011). The geocoding is the same as in a projection of the simulated image from azimuth-slant range plain onto a horizontal plain with a constant height, which is equal to the minimal height value of the used DSM.
The real SAR product we used is also geocoded. For instance, the TerraSAR-X GEC product is represented in a map geometry with ellipsoidal corrections. The average terrain height of the respective scene is added to the semi-major and semi-minor axes of WGS84 ellipsoid which are used for correction (Breit et al., 2010).
Due to the fact that the height of the plane we used is different from the average terrain height of the respective scene, there is a constant shift between the simulated image and real SAR image. To solve this problem a matching algorithm is needed.
3. LINE EXTRACTION AND MATCHING
As we explained in section 2.2, a matching algorithm is needed to compensate the shift between the geocoded simulated image and georeferenced real SAR image. Additionally, for the comparison of simulated image in azimuth-slant range plane and original real SAR image (e.g. TerraSAR-X SLC product (Breit et al., 2010)), a matching is also a condition for further research.
The simulator RaySAR uses the geometry of SAR image. Feature based matching algorithm is suitable for our case. To match the simulated image with the real SAR image, point, line and region features can be used. In our case, line features are proved to deliver the best results.
3.1 Lines extraction
In the SAR image, double reflection of radar signal leads to bright lines, which indicates the footprints of buildings. If the viewing direction of the radar sensor is orthogonal to a roof plane, a line feature will also be induced.
In the simulated image, lines are generated for the same reason, but appear more regular and linear, as the used DSM is more regular than the reality.
A function in Software Halcon (Halcon 2011) named “lines_gauss” is used to extract lines (curvilinear structures) from the images. The function “lines_gauss” compensates the effect of asymmetrical lines and corrects the position and width of the lines. The line model type used for the correction is selected as parabolic lines. Line features, which lie approximately on the same line, are unified. We use a threshold value for the length of the line segments to eliminate the extracted short line segments. Only long line segments are used for the followed matching step.
3.2 Matching of simulated images and real SAR image
For the matching of the simulated images with the real SAR image, a function “find_shape_model” in Halcon software is used. We consider all the extracted line features from one image together as a “shape model” and search it in the other image. For the output we obtain three parameters: the translation in row and column direction, and the rotation angle. In our case, the rotation angle should be zero.
We performed the matching process twice. First, the shape model generated from real SAR image is matched to the simulated image. Second, the shape model generated from the simulated image is matched to the real SAR image. Because both extracted shape models are precise to sub-pixel level and previously filtered, the SAR image contains more noise than the simulated image, the second matching leads to a better result than the first one. We can obtain it clearly in section 4.
For the simulated image generated from the DEM with single building model, only a few line features can be extracted. The matching of these lines with the real SAR image is therefore not very stable. Fortunately, all the simulated images (with single bounce or double bounce) generated from the DSM (and from it processed DEM with single building model) have the same geometry. We can apply the same parameters for the geometrical transformation of the other simulated image to the real SAR image.
4. EXPERIMENTAL RESULTS
For the simulation, we use a DSM of Munich city centre with a vertical and horizontal resolution of 0.1 meter and 1 meter, respectively. A DEM with a single building model of the Frauenkirche in Munich was generated. The two models are shown in Figure 2.
For this case study, we use the geocoded TerraSAR-X (TSX) image (GEC product) (Figure 3a), having a pixel size of 0.5 meter, which has been acquired during a descending orbit with the incidence angle of 50°.
Figure 2. Digital surface model of Munich centre (left), digital elevation model with a single building model (right)
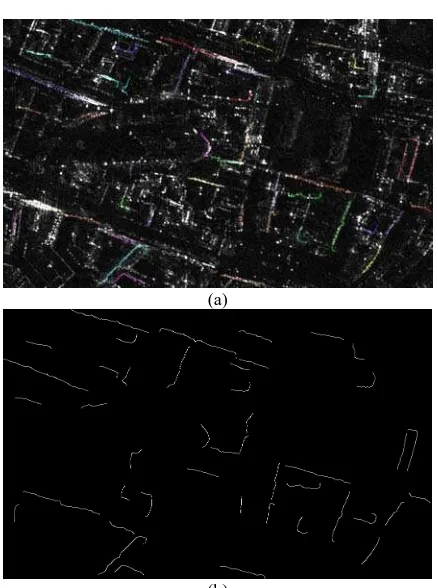
(a)
(b)
Figure 3. TerraSAR-X overlapped with extracted line features (highlighted in colour) (a), only extracted line features (b)
4.1 Result of simulated images and line extraction
The simulated images generated from the whole DSM and from the DEM with single building model are shown in Figure 4. The extracted lines are overlapped on the simulated images, and highlighted in colour. Compared to the TSX image, the simulated image contains less noise and more lines are extracted from it.
In Figure 4c, we can clearly obtain the shadow and layover area of a single building in the simulated image. The extracted lines from this image are evidently less compared to Figure 4a. An unexpected line is extracted in the left upper corner of the Figure 4c, since the generated DTM (section 2.1) has errors
because of the interpolation in the holes corresponding to the buildings in the DSM.
(a)
(b)
(c)
Figure 4. Simulated image overlapped with extracted lines (highlighted in colour): (a) from the whole DSM, (c) from DEM
with only one building model, (b) the extracted lines from the simulated image generated from the whole DSM
4.2 Result of matching
As it was discussed in section 3, there is a small shift between the geocoded simulated image and the real SAR image. In Figure 5a, the lines from the simulated image generated from the whole DSM are directly overlapped on the TSX image. The shift can be seen clearly.
After the matching, the lines are shifted and overlapped in TSX image (Figure 5b). Most of the long and straight line features are located exactly in the right position. For some of the short and curvilinear lines, no signal can be found in the same position in TSX image.
The lines from the TSX image are matched to the simulated image generated from the whole DSM. The result is shown in Figure 6. Compared to Figure 5b, the lines from TSX are International Archives of the Photogrammetry, Remote Sensing and Spatial Information Sciences, Volume XXXVIII-4/W19, 2011
heavily filtered so that less are remaining. The simulated image has a clear structure. So the matching result in Figure 6 is a little better than that in Figure 5b. We can notice it by focusing on the shift in row direction. In Figure 5b, there is still a very little shift in row direction, while all the lines fit perfectly in Figure 6. So we can use the two shift parameters of the matching result in case of Figure 6 for the following analysis.
(a)
(b)
Figure 5. Lines (highlighted in colour) extracted from the simulated image generated from the whole DSM are overlapped
on TSX image: (a) before matching, (b) after matching
Figure 6. Lines (highlighted in colour) extracted from TSX image are matched to simulated image generated from the
whole DSM
4.3 Application of the matching result
Because all of the simulated images have the same size and geoinformation, we can convert them to the real SAR location with the same transformation parameters. We use the matching
result of lines from TSX to the simulated image generated from the whole DSM.
Figure 7a shows the shifted simulated image overlapped on the TSX image. Most structure of objects can be seen in red, which means a good similarity of signals in both images. The speckle noise in TSX is not simulated. Hence, some cyan bright lines can still be seen in the image.
Because single or multiple scattering can be separately presented in SAR images (Auer et al., 2010), an overlay of them on the TSX image can directly indicate the type of reflections. For instance, the reflectivity map of double bounce is highlighted in red colour in Figure 7b.
When more analysis of the DSM and the simulated image are performed, special features like layover area, shadow area, etc. can also be highlighted in a TSX image. They can be considered as reference maps for the processing algorithm (e.g. road extraction, classification) of real SAR image. One application for identification of a single building in the SAR image is shown in the following.
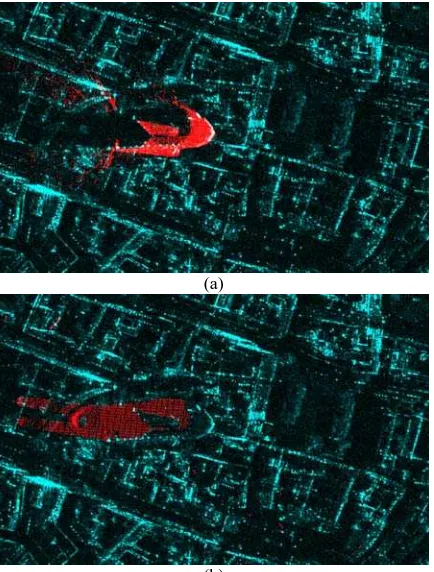
To automatically analyse the influence area of one building in a SAR image, a simulated reference image using the DTM (section 2.1) is generated. The difference to the simulated image with a single building model shows the influence area of the single building (here: Frauenkirche). The positive difference value indicates reflection signals from the building while the negative difference value indicates shadow caused by the building. The positive and negative difference areas overlaid on the TSX image are shown in Figure 8a and 8b, respectively. The shadow area can be clearly seen in the TSX image, while the reflection area can be hardly recognised because of low contrast of the single reflections of the building in the TSX image.
(a)
(b)
Figure 7. TerraSAR-X image (cyan) overlapped with simulated SAR image (red) include: (a) all reflection level, (b) only
double bounce reflection
(a)
(b)
Figure 8. TerraSAR-X image (cyan) overlapped with reflection area (a) and shadow area (b) of single building (red)
5. CONCLUSION AND OUTLOOK
In this paper, a method for supporting the interpretation of high resolution SAR images with simulated radar images using a LiDAR DSM has been presented. Line features are extracted from the simulated SAR image and the real SAR image and used for matching of the images. Two subpixel precise translation parameters are calculated from the matching result and enable a direct overlay of all simulated images on the real SAR image. A single building model is generated from the DSM and used for building recognition in SAR image. Special features like double bounce lines, shadow areas in SAR image can be automatically indicated. Future work will concentrate on pixel based analysis of the difference between simulated and real SAR image and derive a semantic description of SAR images.
ACKNOWLEDGEMENT
TerraSAR-X data were provided by DLR through the Science Projects MTH0505 and MTH0948. The work of Junyi Tao was supported by the DLR-DAAD research grant A/09/95888.
REFERENCES
Auer, S., Hinz, S., Bamler, R., 2010. Ray-Tracing Simulation Techniques for Understanding High-Resolution SAR Images.
IEEE Transactions on Geoscience and Remote Sensing, 48(3),
pp. 1445-1456.
Balz, T., 2010. SAR Simulation of Urban Areas: Techniques and Applications, In: Soergel, U. (Ed.): Radar Remote Sensing
of Urban Areas, Remote Sensing and Digital Image Processing,
Springer Science, 2010, pp. 215-231.
Breit, H., Fritz, T., Balss, U., Lachaise, M., Niedermeier, A., Vonavka, M., 2010. TerraSAR-X SAR Processing and Products. IEEE Transactions on Geoscience and Remote
Sensing, 48(2), pp. 727-740.
Halcon Reference Manual Version 10.0.1. http://www.mvtec.com/download/reference (accessed 15 Apr. 2011)
Tao J., Palubinskas G., Auer S., Reinartz P., 2011. Interpretation of SAR Images in Urban Areas Using Simulated Optical and Radar Images. JURSE 2011 - Joint Urban Remote
Sensing Event 2011, Munich, Germany, pp. 41-44.
Touzi R., Lopes, A., Bousquet, P., 1988. A statistical and geometrical edge detector for SAR images. IEEE Transactions
on Geoscience and Remote Sensing, 26(6), pp. 764-773
Tupin, F., Maitre, H., Mangin, J.-F., Nicolas, J.-M., Pechersky, E., 1998. Detection of linear features in SAR images: application to road network extraction, IEEE Transactions on
Geoscience and Remote Sensing, 36(2), pp. 434-453.
Wegner J., Auer S., Soergel U., 2010. Extraction and Geometrical Accuracy of Double-bounce Lines in High Resolution SAR Images. Photogrammetric Engineering and
Remote Sensing, 76(9), pp. 1071-1080.