www.elsevier.comrlocateratmos
The isothermal haze chamber with discontinuous
flow: a new experimental device for CCN
measurements at low supersaturation
C. Legrand
)Laboratoire d’Aerologie, UMR CNRS-UPS 5560, 14 a´ Õenue Edouard Belin, 31400 Toulouse, France
Received 9 July 1999; received in revised form 12 April 2000; accepted 14 April 2000
Abstract
Ž .
An isothermal haze chamber IHC has been designed, incorporating results from the tests of
Ž .
earlier instruments held at the 1981 Reno NV workshop. This instrument, named isothermal haze
Ž .
chamber with discontinuous flow IHCDF , periodically discontinues the flow through the haze chamber in order to form a well-defined region of 100% RH in the center of the chamber. Indeed, tests performed with our conventional continuous flow IHC showed a poorly defined 100% RH field in the chamber, mainly due to an unsteady laminar air flow through the chamber during measurement.
Experiments with polydispersed NaCl aerosol showed that a supersaturation spectrum could be obtained within a growth time of 300 s, over a supersaturation range of 0.01–0.1%.
The instrument is suitable for field use. It is contained in a package 1.4 m high and weighs 5 kg. Three minutes is required to collect the air sample and 5 min for drop growth, thus permitting the analysis of seven samples per hour.q2000 Elsevier Science B.V. All rights reserved.
Keywords: Isothermal haze chamber with discontinuous flow; Supersaturation; Aerosol
1. Introduction
The atmospheric aerosol and clouds are important to the earth radiative balance, and the aerosol is an important component of the atmospheric chemical balance. The
Ž
atmospheric aerosol is composed of a large variety of materials Heintzenberg, 1989;
)Fax:q33-5-61-33-2790.
Ž .
E-mail address: [email protected] C. Legrand .
0169-8095r00r$ - see front matterq2000 Elsevier Science B.V. All rights reserved.
Ž .
.
Solomon et al., 1989; Saxena and Hildeman, 1996 including water, crustal dust, nitrate, sulfate, chloride, ammonium, sodium, black carbon, organic compounds and biologically derived substances. Aerosol is involved in many processes of tropospheric
heteroge-Ž .
neous chemistry, oxidation reaction see for example Chunghtai et al., 1991 , rain
Ž .
chemistry Lacaux et al., 1992 and condensed vapors partitioning gas at low saturation
Ž .
vapor pressure Pankow, 1987; Goss and Eisenreich, 1997 . Ž .
Hobbs 1993 considers the role of the aerosol in global warming. Atmospheric aerosol has direct effects with scattering, back scattering to space and absorption of solar radiation and indirect effects by influencing earth cloud cover and cloud albedo. Clouds
Ž
may be considered as both source and sink for atmospheric aerosol Hegg et al., 1991; .
Radke and Hobbs, 1991 . Particles nucleating or sorbed into cloud droplets, that are precipitated, form an atmospheric aerosol sink. Particles released during cloud evapora-tion have enough different properties to consider the cloud as an atmospheric aerosol source. This is a significant source of tropospheric aerosol and annual emissions should
y1 Ž . Ž .
be around 3000 Tg yr Jaenicke, 1993 see Table 1 . Particles produced by cloud evaporation have specific granulometric, morphological and chemical characteristics different from those of the aerosol that initiates cloud droplets. This means that modified aerosol properties will modify cloud radiative properties and that cloud evaporation processes modify aerosol radiative properties.
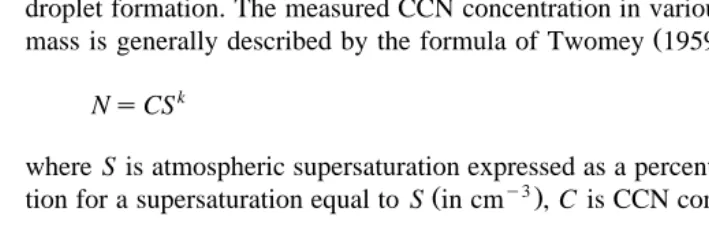
The relationship between clouds and atmospheric aerosol is not well known because of the complexity of the heterogeneous chemistry reaction. The main criterion that characterizes a particle’s capacity to condense water vapor is the critical supersaturation S . S is the water vapor supersaturation required to activate cloud condensation nucleic c ŽCCN . The estimation of S is therefore indispensable to understand and quantify cloud. c droplet formation. The measured CCN concentration in various types of atmospheric air
Ž . mass is generally described by the formula of Twomey 1959 :
NsCSk
Ž .
1where S is atmospheric supersaturation expressed as a percentage, N is CCN concentra-Ž y3.
tion for a supersaturation equal to S in cm , C is CCN concentration for Ss1% and
Table 1
Ž .
Estimates of the global strengths of aerosol particles from natural sources Jaenicke, 1993
y1
Ž .
Source Strength Tg yr
Widespread surface sources
Ocean and fresh water bodies ;1000–2000
Crust and cryosphere ;2000–
Biosphere and biomass burning ;450–
Volcanoes ;15–90
Spatial sources
Gas-to-particle conversion ;1300
Clouds ;3000
Table 2
Ž .
Empirical parameters for the CCN concentration calculated with Twomey’s formula Hegg and Hobbs, 1992
y3
k is a measurement adjusting coefficient to Twomey’s formula. Necessary parameters
Ž .
for Twomey’s formula calculation are shown in Table 2 Hegg and Hobbs, 1992 . Ž .
Hudson 1993 pointed out the importance of CCN study at Sc-0.1% because this
Ž .
supersaturation is present in stratiform type clouds Mason, 1971; Hudson, 1983 . Stratiform clouds are considered to have the largest impact on global atmospheric albedo and this points out the necessity of having a reliable CCN measurement device for this important supersaturation range.
2. Review of CCN measurement devices
There are two predominant types of experimental devices to measure CCN. The first
Ž .
type is composed of the diffusion cloud chambers Saxena and Kassner, 1970 . The geometry, operating principles and droplet detection methods are described in Rea Ž1981 . Diffusion cloud chambers require several independent measurements to deter-. mine the supersaturation spectrum. These diffusion cloud chambers work with
continu-Ž
ous or discontinuous flow Hudson and Squires, 1973, 1976; Rogers and Politovitch, .
1981; Serpolay, 1981 and the available supersaturation range is about 0.1–3%. CCN
Ž .
spectrometers Hudson 1993; Hudson et al., 1981 determine the supersaturation spec-trum within a single sample in order to avoid the problems due to the time and space
Ž variability of the aerosol source. The available supersaturation range is 0.01–3% Fukuta
. and Saxena, 1979; Radke et al., 1981; Hudson, 1989 .
Ž .
The continuous flow isothermal haze chambers IHC are the second type of experimental device for CCN measurement. They have been specially designed to
Ž
. Ž .
1981; Hindman, 1981; Hoppel, 1981; Hudson et al., 1981 . Latkionov 1972 presented an original method for CCN measurement with S ranging from 0.01% to 0.1%: startingc
with the equilibrium radius r100 of a droplet constituted from a particle in a 100% RH atmosphere, he linked r100 with S according to the following formula:c
200 a 1
S %c
Ž .
s'
Ž .
2r 3 3 100
where as2 MsrrRT, M is the molar mass of pure water, s is the surface tension of pure water, r is the density of pure water, R is the perfect gas constant and T is the temperature in Kelvin. At 293 K, we have:
0.041
S %c
Ž .
fŽ .
3r100
Ž
mm.
Ž .
Eq. 3 allows the calculation of the supersaturation spectrum of an aerosol with a single measurement by means of an optical particle counter. It is not necessary to know
Ž .
the initial diameter of the particles, nor their chemical composition. Eq. 3 allows us to define the size spectrum range for the droplet, between 0.41 and 4.1mm in radius, to obtain a supersaturation spectrum in the range of 0.01–0.1%.
The constant ‘a’ represents properties of pure water and may be affected by the chemical composition of the CCN. Some compounds present in the atmosphere act as
Ž
surfactants, which may significantly modify the droplet surface tension Andrews and
. Ž .
Larson, 1993 . Corradini and Tonna 1979 studied the Laktionov relation according to the electrolyte composition of continental and maritime aerosol and the variation of the Laktionov formula does not exceed 6%. The minimal amount of necessary soluble material in the dry particle to prevent any deviation from the Laktionov formula is
Ž .
around 5% in mass Hoppel and Fitzgerald, 1977 . Finally, at 208C, a variation of
"108C in the temperature induces an error of"5% for S .c
The Reno workshop compared the performances of four different models of IHC ŽFitzgerald et al., 1981 . The results show that two IHC out of four agreed as near as. 40% over the whole range of critical supersaturation. The third IHC is in agreement at small critical supersaturation values, but departs by a factor 2 at greater supersaturation. The fourth IHC could not be compared with the others because of the use of a different
Ž .
type of optical particle counter. Fitzgerald et al. 1981 explained the differences in the results obtained with the four IHC. Firstly, r100 is dramatically sensitive to the RH value inside the IHC. For example, a NaCl nucleus with initial radius of 0.2mm, a growth in a 99.99% RH atmosphere will induce an 8% relative error in the critical supersaturation. This error will reach 90% with growth in 99.9% RH! The difference shown by the
Ž .
University of Colorado IHC Hindman, 1981 is probably due to this reason. Secondly, the residence time of droplets in a 100% RH atmosphere must be long enough to allow them to reach their equilibrium radius r100. This time is theoretically about 7 min ŽFukuta and Walter, 1970; Latkionov, 1972; Robinson and Scott, 1980 ..
In addition to this discussion, tests performed with the IHC designed by the Ž
.
Serpolay, 1986 showed two major problems, mainly due to an unsteady laminar air
Ž .
flow through the chamber during measurement Legrand, 1996 . Firstly, the transfer time of the droplet is too short in the IHC, between 30 s and 5 min, instead of the 8.5-min theoretical transfer time. Furthermore, measurements are not reproducible without changing the experimental procedure. This problem may result from the flow velocity in the IHC. At low speed, the laminar flow seems to be unsteady, thus
Ž .
introducing a doubt about the RH field value Legrand, 1996 . Secondly, the time needed to obtain a homogeneous aerosol concentration in the IHC is 30 min. This induces problems in associating the supersaturation spectrum with the aerosol concentra-tion source when this source varies with time.
The available instruments, including thermal diffusion chambers and IHC, allow the measurement of supersaturation spectra in an approximate range between 0.01% and 3% of S . This range represents the most important part of atmospheric supersaturations.c
However, the IHC problems highlighted by Fitzgerald and Legrand seem to originate from the inhomogeneity of the RH field value. As a consequence, it seemed necessary to Ž . conceive a new type of isothermal haze chamber with discontinuous flow IHCDF . With the use of discontinuous flow, definitely reaching a 100% RH atmosphere becomes possible in the center of the IHC.
3. Technical description of the IHCDF
Ž .
The operation of the IHCDF is based on Laktionov’s formula 3 . A theoretical model taking into account the heat and mass transfer was elaborated in order to define the physical characteristics of the IHCDF. This model is based on the droplet growth
Ž .
equation Fukuta and Walter, 1970 , on the RH field equation inside the chamber, on the sedimentation velocity equation of droplets inside the chamber and on constraints in
Ž .
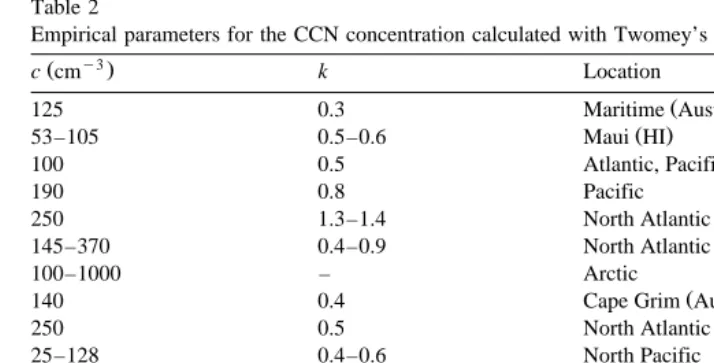
using the optical particle counter airflow velocity, inlet diameter . . . . Several thermo-dynamic parameters, such as temperature, incoming air humidity, temperature difference between incoming air and chamber interior wall, were separately studied. Fig. 1 shows a description of the IHCDF. The IHCDF is a PVC tube of height 1.1 m and 72 mm diameter, with an inner wall covered with a synthetic cloth constantly moistened during the measurement. With these dimensions and when the airflow is switched off inside the chamber, the theoretical time to obtain 99.999% RH in the center of the chamber is approximately 100 s.
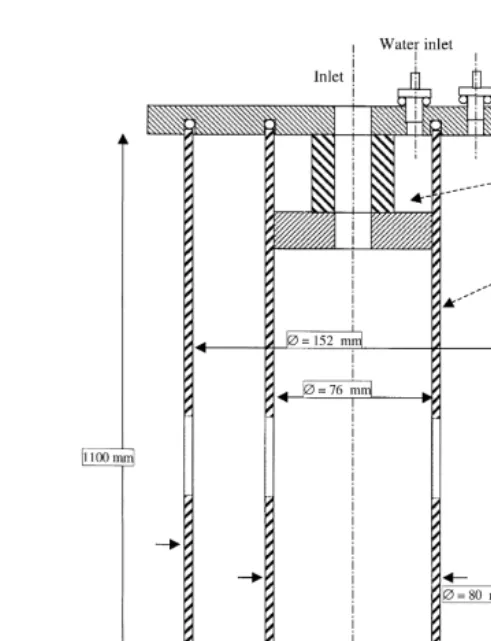
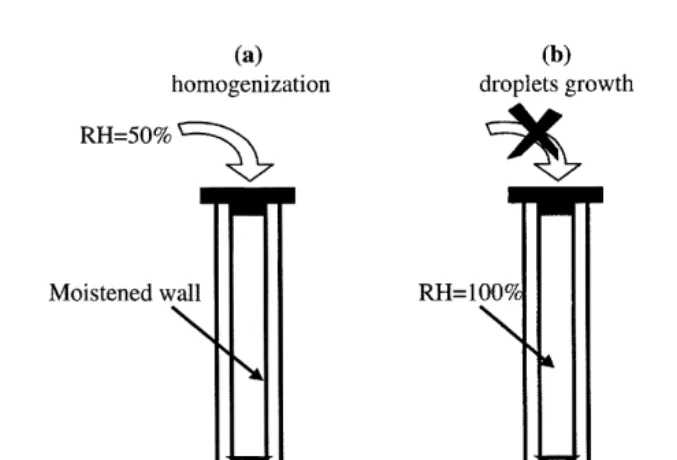
Fig. 2 shows the operating principle of the IHCDF. The aerosol is introduced into the Ž .
IHCDF Fig. 2a and the flow is then interrupted. Particles remain static in the chamber ŽFig. 2b . The transfer pump is turned on after the necessary delay for the droplets to.
Ž .
reach their equilibrium radius r100 and the droplets are counted in the transfer flow Ž .
with an optical particle counter Fig. 2c . At first, we must define three different characteristic times for the IHCDF measurement procedure:
Fig. 1. Description of the isothermal haze chamber with discontinuous flow.
ØDuring the growth time, the sample pump is turned off and particles remain inside the IHCDF. The growth time is the necessary time for the droplets to reach their equilibrium radius r100. The growth time value will be defined in Section 4.
Ø The sampling time: after the growth time, the sample pump is turned on and the sampling time is the time of droplet size spectrum measurement performed with the optical particle counter. The sampling time is the beginning of the homogenization time for the following measurement.
Therefore, there are four major phenomena to consider when optimizing the dimen-sions of the IHCDF prototype.
Ø Droplet sedimentation while they are in the chamber during the growth time. This can cause larger droplets to disappear before droplet size measurement.
Ž . Ž . Ž .
Fig. 2. Operating principle of the IHCDF: a the homogenization time, b the growth time, c the sampling time.
Ø Introduction of dry air in the chamber during droplet size measurement, thus causing droplet evaporation.
Ø Difference between atmospheric temperature and IHCDF wall temperature may cause supersaturation inside the IHCDF. In order to avoid this problem, the chamber is mounted inside a second PVC tube. Both cylinders together enclose a volume in which ambient air circulates in order to homogenize the temperature of the device.
The modeling study, taking into account the four phenomena above described, allows us to define the dimensions of the prototype:
Ž .
Ø Total height of the chamber: 1.1 m. In order to prevent larger droplet rs4.1mm
sedimentation in the lower third of the chamber.
Ø Radius of the chamber: 3.6 cm. To get 99.999% RH in the center of the chamber as
soon as possible and a sufficient Reynolds flow number to get a steady laminar flow during droplet size measuring.
Ø Sampling flow: 5.5 lrmin. To get a steady laminar flow during droplet size
measuring.
Ø Sampling time: 15 s. Sufficient for measurement and highest possible value to ensure
sampling in the lower third of the chamber only, without mixing with dry air in order to prevent droplet evaporation.
Ø Sampling Õent: B18 mm and maximum sampling pipe length: 4 m. Both are
4. Experimental validation of the IHCDF
The experimental validation of the IHCDF is performed with a polydispersed NaCl
Ž .
aerosol. First experiments concerned the non-existence of leaks air and water inside the chamber and the non-production of particles by the IHCDF itself. These issues will not be dealt with in this paper. Two important points are developed hereafter. Firstly, it is necessary to evaluate depressurization consequences on the droplet growth during the droplet size spectrum measurement. Secondly, we must define the growth time value. This time must be long enough for the droplets to reach their equilibrium radius, and short enough to avoid the sedimentation of the largest droplets.
Fig. 3 shows the experimental device used for the experimental validation of the Ž
IHCDF. The aerosol source is a 520-l stainless steel tank, with 12 holes in order to .
connect sample pipes . The aerosol is produced by nebulization of a NaCl solution of concentration from 1 to 100 grl. The nebulization flow rate is 8 lrmin and nebulization time is about 15 s. Because the laboratory humidity value is always lower than 70% RH, nebulized droplets quickly evaporate from the tank to leave polydispersed NaCl
parti-Ž .
cles. A continuous flow 8 lrmin pump blows filtered air, allowing a non-contaminated dilution while sampling. Initial concentration is about 10 000 cmy3. This source is stable for about 2 h. The output concentration is measured with a TSI 3022 condensation particle counter.
The Polytec HC70G500 optical particle counter measures the size spectrum of droplets in the diameter range 0.7–21 mm in 128 channels. The highest measurable concentration is about 18 000 cmy3 with a 5% coincidence. A counting problem is
Ž .
present in the channels 0–39 0.7–2.38 mm diameter , due to the acquisition software ŽLegrand, 1996 . The data on those channels are to be used cautiously. However, this. problem will have no consequence to the experimental study because it will be carried out with comparisons of droplet spectra in a relative mode. Furthermore, this counting problem concerns the smallest droplets, which are the least affected by sedimentation
Ž and which rapidly reach their equilibrium radius r100. For absolute measurements for
.
field studies , the Polytec OPC is now driven by new acquisition software that corrects the counting problem present in the smallest channels.
The TSI 3022 condensation particle counter detects particles of radius greater than 10 nm, at concentrations less than 106 cmy3. It is used for aerosol source concentration
checking and for normalized size spectra calculation.
4.1. Checking of depressurization consequences
In the first part of this experiment, we are going to evaluate consequences of depressurizations inside the IHCDF during droplet size spectrum measurement. Because
Ž .
of the high humidity value 100% RH inside the chamber before the droplet size spectrum measurement, a small depressurization will cause a transient supersaturation in the chamber, by the way of an adiabatic pressure loss, when the sample pump is switched on. This transient supersaturation induces new growth of the droplets during
Ž droplet size measurement. Because of the short time of the droplet size measurement 15
.
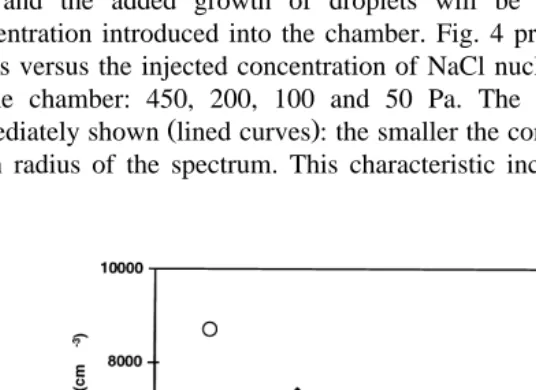
s , the humidification system of the IHCDF will not be able to maintain the supersatura-tion and the added growth of droplets will be a funcsupersatura-tion of the NaCl particle concentration introduced into the chamber. Fig. 4 presents the droplet arithmetic mean radius versus the injected concentration of NaCl nuclei for four depressurization values in the chamber: 450, 200, 100 and 50 Pa. The effect of the depressurizations is
Ž .
immediately shown lined curves : the smaller the concentration of nuclei, the larger the mean radius of the spectrum. This characteristic increases with the importance of the
Fig. 4. Droplet arithmetic mean radius versus injected NaCl nuclei concentration for four depressurizations
Žlined curves and without depressurization circle inside the IHCDF. We can note the evolution of arithmetic. Ž .
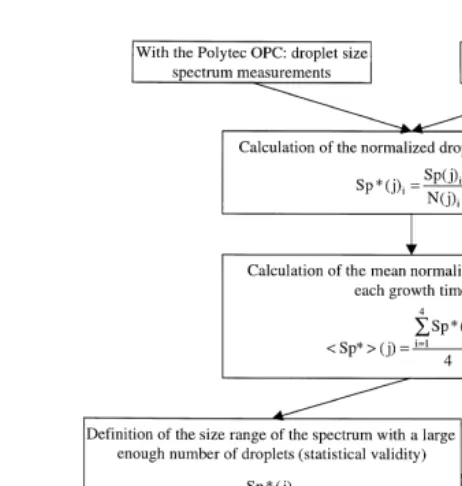
Fig. 5. Experimental method for the determination of the growth time value.
depressurization. When the depressurization value is not detectable with our barometer, which is the case in the normal operating mode of the IHCDF, the mean radius does not
Ž .
depend on the nucleus concentration black circles . In this case, there is no added droplet growth during size spectrum measurement. These results do not allow us to conclude that supersaturation does not increase during droplet size measurement. However, if supersaturation occurred when operating, it remained very low and had no influence on the droplet radius. Consequently, we admit that the depressurization created
Table 3
Summary of growth experiments
Ž .
Experiments Concentration of the Number of Growth time studied min
Ž .
NaCl solution grl measurements
11 1 13 0, 0.5, 1, 2, 5, 10
7, 8, 12, 13, 14 2 77 0.5, 1, 2, 3, 5, 7, 10
9, 10 6 32 0, 0.5, 1, 1.5, 2, 2.5, 3
15, 16, 17, 18, 19 20 64 1, 3, 4, 5, 6, 7, 8, 9, 10, 20
34 60 38 1, 3, 5, 7, 10
37 100 7 5, 10, 15, 20
by the inlet pipe is very low, and does not induce supersaturation in the chamber during droplet spectrum measurement.
4.2. Definition of the growth timeÕalue
There is no possibility to directly check the growth time necessary for the droplets to reach their equilibrium radius r100, because we cannot measure the NaCl nucleus size spectrum of the aerosol source. Consequently, there is no possibility to theoretically calculate the droplet spectrum with 100% RH. On the contrary, we have an aerosol
source whose concentration is permanently known. To know whether the droplets remained long enough in the chamber to reach r100, we have to compare the size spectrum measured according to their growth time in the chamber. The method used to compare the droplet size spectrum according to growth time is explained in Fig. 5. To achieve this comparison, we use the size spectrum normalized by the source concentra-tion in order to take the source diluconcentra-tion into account. Droplets are considered to have reached their equilibrium radius when the normalized spectrum shape is independent of
Ž growth time. Several measurements are made during several growth times three
.
different growth times, and four to five measurements for each growth time . A specific Ž .
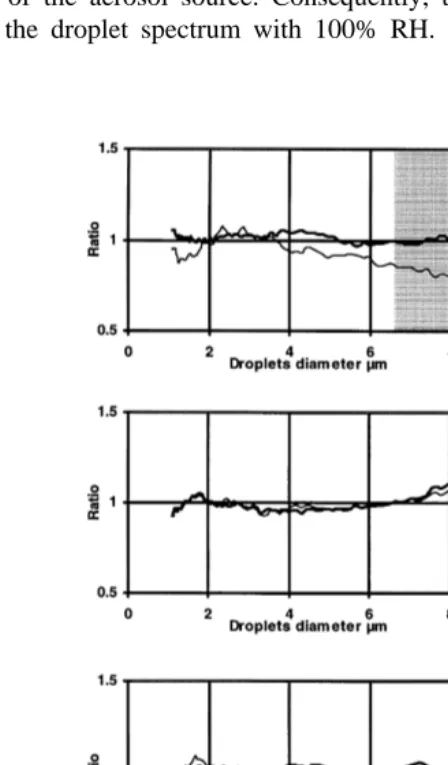
growth time has been selected 5 min to be used as a reference for all the experiments. Comparison may begin after checking the normalized spectrum statistical validity for each measurement. The mean spectrum for each growth time is calculated. The results are used to calculate the ratio of the mean spectrum for the growth time versus the mean spectrum for the 5-min growth time. Table 3 shows the achieved growth experiments. Experiments made with a 20 grl NaCl solution are used as an example. Fig. 6 shows the results for 1, 3, 4, 7, 8, 9, 10 and 20 min of growth time.
From this figure, we can determine three results:
Ø If growth time is shorter than 4 min, we see a lack of larger droplets. Growth time is not long enough to allow larger droplets to reach r100.
Ø If growth time is longer than 9 min, a lack of larger droplets appears again. This is a result of sedimentation.
Ø When growth time is 4–9 min, the growth is the same in all the experiments. We can Ž note that the growth of larger nuclei is slightly faster than its theoretical value 7
. min .
An issue of this experiment is that the concentration of the largest droplets is not Ž
large enough to have a statistical validity over all the size range studied from 0.82 to
. 8.2mm in diameter corresponding to a supersaturation range from 0.01% to 0.1% . To confirm good growth for the largest droplets, we made an experiment with a 100-grl NaCl solution. Fig. 7 shows that sedimentation, for a growth time equal to 10 min, is effective for droplets larger than 10 mm, and the ratio ranges between 0.9 and 1.05 for droplets smaller than 10mm in diameter. Here we see that droplets as large as 10mm in diameter reach their equilibrium radius and the lower limit of the supersaturation spectrum can be smaller than 0.01% if the concentration of the largest droplets is large enough.
As a result of these experiments, we have chosen a growth time of 5 min to obtain spectra in the standard measurement procedure. This growth time can be set from 4 to 9 min.
Ž
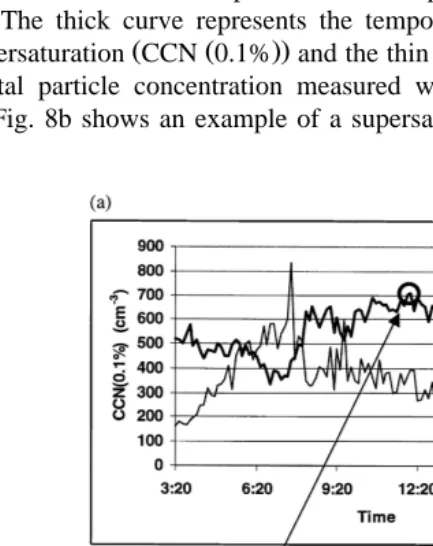
Fig. 8a gives an example of field use of the IHCDF in an urban area Toulouse, .
France . Measurements were performed on September 1st, 1998, between 03:20 and 16:40 h. The thick curve represents the temporal evolution in CCN concentration at
Ž Ž ..
0.1% supersaturation CCN 0.1% and the thin curve represents the temporal evolution in the total particle concentration measured with the TSI 3022 condensation nuclei counter. Fig. 8b shows an example of a supersaturation spectrum measured at 12:05 h.
Ž . Ž .
Fig. 8. Application of the IHCDF in urban atmosphere Toulouse, France . a Evolution with time of the CCN
Ž0.1% concentration solid thick curve and of the CN concentration solid thin curve . b Example of. Ž . Ž . Ž .
With a measurement every 8 min, the temporal resolution of the IHCDF reveals Ž .
significant variations in CCN 0.1% concentration during the day, between 350 and 710 cmy3. It also shows fluctuations in this concentration within time intervals of about half an hour. All the results obtained during this experiment as well as their interpretation shall be dealt with in a future article.
5. Conclusions
The review of CCN measurement devices has shown that the problem inherent to the isothermal haze chamber with continuous flow is linked to an uncertainty in the RH field value in its center. The isothermal haze chamber with discontinuous flow allows a reliable 100% RH field value to be attained in its whole volume. The necessary time to
Ž
complete a supersaturation spectrum is 8 min 3 min to collect the air sample and 5 min
. Ž .
for drop growth . The short homogenization time 3 min allows us to have a good time resolution of CCN source fluctuations. However, the main limit of the IHCDF comes
Ž .
from the short sample time available 15 s . As a matter of fact, the optical sample volume after 15 s is only 1.6 cmy3 and the CCN concentration must be rather high to
get a droplet spectrum statistically significant. In this case, we accumulate several consecutive spectra but this induces a loss of information on the temporal evolution of the CCN source. The IHCDF small dimensions, of 1.4 m height and 10 kg weight, allow easy field use. Moreover, an adapted version of the IHCDF can be designed for aircraft platform instrumentation.
References
Alofs, D.J., Trueblood, M.B., 1981. UMR dual mode CCN counter. J. Rech. Atmos. 15, 219–223.
Andrews, E., Larson, S.M., 1993. Effects of surfactant layers on the size changes of aerosol particles as a function of relative humidity. Environ. Sci. Technol. 27, 857–865.
Chunghtai, A.R., Jassim, J.A., Peterson, J.H., Stedman, D.H., Smith, D.N., 1991. Spectroscopic and solubility of characteristics of oxidized soots. Aerosol Sci. Technol. 10, 161–171.
Corradini, C., Tonna, G., 1979. Condensation nuclei supersaturation spectrum: analysis of the relationship between the saturation droplet radius and the critical supersaturation in the Latkionov isothermal chamber. J. Aerosol Sci. 10, 465–469.
Fitzgerald, J.W., Rogers, C.F., Hudson, J.G., 1981. Review of isothermal haze chamber performance. J. Rech. Atmos. 15, 333–346.
Fukuta, N., Saxena, V.K., 1979. A horizontal thermal gradient clouds condensation nucleus spectrometer. J. Appl. Meteorol. 18, 1352–1362.
Fukuta, N., Walter, N.A., 1970. Kinetics of hydrometeor growth from a vapor spherical model. J. Atmos. Sci. 27, 1160–1172.
Garmy, M., 1985. Definition et realisation d’un prototype de chambre a diffusion thermique isotherme a flux´ ´ ` ` continu. Note IOPG 78.
Garmy, M., Serpolay, R., 1986. An isothermal diffusion tube for getting low supersaturation spectra of CCN by coupling with a polytec HC15 spectrogranulometer. J. Aerosol Sci. 17, 401–405.
Goss, K.U., Eisenreich, S.J., 1997. Sorption of volatile organic compounds to particles from a combustion source at different temperatures and relative humidities. Atmos. Environ. 31, 2827–2834.
Hegg, D.A., Hobbs, P.V., 1992. Cloud condensation nuclei in the marine atmosphere: a review. In: Fukuta, N.,
Ž .
Hegg, D.A., Radke, L.F., Hobbs, P.V., 1991. Measurements of aitken nuclei and cloud condensation nuclei in the marine atmosphere and their relation to the dms-cloud-climate hypothesis. J. Geophys. Res. 96, 8727–8733.
Heintzenberg, J., 1989. Fine particles in the global troposphere — a review. Tellus 41B, 149–160. Hindman, E.E., 1981. An airborne isothermal haze chamber. J. Rech. Atmos. 15, 235–243.
Ž .
Hobbs, P.V., 1993. Aerosol–cloud interactions. In: Hobbs, P.V. Ed. , Aerosol–Cloud–Climate Interactions. Academic Press, San Diego, CA, pp. 33–73.
Hoppel, W.A., 1981. Description of the NRL isothermal haze chamber. J. Rech. Atmos. 15, 263–266. Hoppel, W.A., Fitzgerald, J.W., 1977. Measurements of CCN spectra at low supersaturation in relation to fog
formation off the coast of Nova Scotia. In: Proc. Symp. on Radiation in the Atmosphere. Science Press, Princeton, NJ, pp. 62–64.
Hudson, J.G., 1983. Effect of CCN concentrations on stratus clouds. J. Atmos. Sci. 40, 480–485. Hudson, J.G., 1989. An instantaneous CCN spectrometer. J. Atmos. Oceanic Technol. 6, 1055–1065. Hudson, J.G., 1993. Cloud condensation nuclei. Am. Meteorol. Soc. 32, 596–607.
Hudson, J.G., Squires, P., 1973. Evaluation of a recording continuous cloud nucleus counter. J. Appl. Meteorol. 12, 175–183.
Hudson, J.G., Squires, P., 1976. An improved continuous flow diffusion cloud chamber. J. Appl. Meteorol. 15, 776–782.
Hudson, J.G., Rogers, C.F., Keyser, G., 1981. Simultaneous operation of three CCN counters and an isothermal haze chamber at the 1980 international CCN workshop. J. Rech. Atmos. 15, 271–283.
Ž .
Jaenicke, R., 1993. Tropospheric aerosols. In: Hobbs, P.V. Ed. , Aerosol–Cloud–Climate Interactions. Academic Press, San Diego, CA, pp. 1–31.
Lacaux, J.P., Delmas, R., Kouadio, G., Cros, B., Andreae, M.O., 1992. Precipitation chemistry in the Mayombe Forest of equatorial Africa. J. Geophys. Res. 97, 6195–6207.´
Latkionov, A.G., 1972. A constant temperature method of determining the concentrations of cloud condensa-tion nuclei. Atmos. Oceanic Phys. 8, 382–385.
Legrand, C., 1996. Etude d’un dispositif de mesure des noyaux de condensation de nuage: application a` l’aerosol de combustion de savane. In: Rapport D.E.A.. Laboratoire d’Aerologie, observatoire Midi´ ´ Pyrenees, Toulouse, France, 39 pp.´ ´
Mason, B.J., 1971. In: The Physics of Clouds vol. 2 Clarendon Press, Oxford, UK, 671 pp.
Pankow, J.F., 1987. Review and comparative analysis of the theories on partitioning between the gas and aerosol particulate phases in the atmosphere. Atmos. Environ. 21, 2275–2283.
Radke, L.F., Hobbs, P.V., 1991. Humidity and particle fields around some small cumulus clouds. J. Atmos. Sci. 48, 1190–1193.
Radke, L.F., Domonkos, S.V., Hobbs, P.V., 1981. A cloud condensation nucleus spectrometer designed for airborne measurements. J. Res. Atmos. 15, 225–229.
Ž .
Rea, S.W., 1981. In: The Third International Cloud Condensation Nuclei Workshop. Rea, S.W. Ed. , J. Rech. Atmos. vol. 15, no. 3–4.
Robinson, N.F., Scott, W.T., 1980. Two-stream Maxwellian kinetic theory of cloud droplet growth by condensation. J. Atmos. Sci. 38, 1015–1026.
Rogers, D.C., Politovitch, M.K., 1981. Contribution to CCN workshop report from university of Wyoming group. J. Rech. Atmos. 15, 203–207.
Saxena, P., Hildeman, L.M., 1996. Water-soluble organics in atmospheric particles: a critical review of the literature and application of thermodynamics to identify candidate compounds. J. Atmos. Chem. 24, 57–109.
Saxena, V.K., Kassner, J.R., 1970. Thermal diffusion chambers as cloud condensation nuclei counter. In: Proc. Symp. Precipitation Scavenging, Richland, WA. Pacific Northwest Laboratory and U.S. Atomic Energy, pp. 217–238.
Serpolay, R., 1981. The CCN counter of the I.O.P.G. of Puy de Dome: main characteristics and results ofˆ measurements. J. Rech. Atmos. 15, 215–218.
Solomon, P.A., Fall, T., Salmon, L., Cass, G.R., Gray, H.A., Davidson, A., 1989. Chemical characteristics of PM10 aerosols collected in the Los Angeles area. J. Air Pollut. Control Assoc. 39, 154–163.