MONITORING THE URBAN GROWTH OF DHAKA (BANGLADESH) BY SATELLITE
IMAGERY IN FLOODING RISK MANAGEMENT PERSPECTIVE
G. Bitelli, F. Franci*, E. Mandanici
Department of Civil, Chemical, Environmental and Materials Engineering (DICAM) – University of Bologna Viale del Risorgimento 2, 40136 – Bologna, Italy – (gabriele.bitelli, francesca.franci2, emanuele.mandanici)@unibo.it
KEY WORDS: Dhaka, flooding risk, urban growth, landcover, Landsat.
ABSTRACT:
There is large consensus that demographic changes, the lack of appropriate environmental policies and sprawling urbanization result in high vulnerability and exposure to the natural disasters.
This work reports some experiences of using multispectral satellite imagery to produce landuse/cover maps for the Dhaka city, the capital of Bangladesh, which is subject to frequent flooding events.The activity was conducted in collaboration with the non-profit organization ITHACA (Information Technology for Humanitarian Assistance, Cooperation and Action).
The Landsat images acquired in 2000, 2002 and 2009 were used to evaluate the urban growth in order to support risk assessment studies; to identify areas routinely flooded during the monsoon season, the image of October 2009 (the most critical month for the effects of rain) was compared with two images acquired in January and February 2010.
The analysis between 2000 and 2009 was able to quantify a very rapid growth of the metropolis, with an increase in built-up areas from 75 to 111 km2. The analysis highlights also a sharp rise of Bare soil class, likely related to the construction of embankments for
the creation of new building space; consequently a decrease of cultivated land was observed. In particular, these artificial islands have been invading flooding areas.
The change detection procedure also showed that the flooding in October 2009 affected about 20% (115 out of 591km2) of the entire study area; furthermore these areas became wetlands and farmland over the next three/four months.
1. INTRODUCTION
Urbanization is one of the most common anthropogenic causes of the arable land loss, the destruction of habitats and the decline of natural vegetation cover. In the last few decades, land use/cover conversion, due to human activities, occurred more rapidly in developing countries than in the developed world. Like other developing countries, Bangladesh has experienced rapid urbanization and Dhaka, its capital, is expected to grow by 2020 to more than 50 times its size in 1950 (UN-HABITAT Report, 2006). In fact, in recent decades rapid increase in urban population has occurred in Dhaka, 1.4 million people in 1970, 6.6 in 1990 and 15.4 in 2011 (United Nations, 2011). The population explosion, caused in large part by the rural-urban migration, has contributed significantly to this growth; it was estimated that in 2020 Dhaka will have about 20 million of inhabitants (UN-HABITAT Report, 2006).
Unfortunately,the absence of reliable and up-to-date information on land use/cover, which is important prerequisite for a sustainable urban development, has contributed to an unmanaged urban sprawl, resulting in widespread environmental problems throughout the city. In particular, the increase of impervious surfaces,resulting from rapid urbanization,has been exacerbating the impacts of water flows during the monsoon season, that affects Dhakafrom May to October (Islam Khan, 2000; Islam et al., 2010).
In this context, Remote Sensing can allow the monitoring of some ongoing phenomena, which are difficult to assess on a large scale in a different way, by means of change detection techniques (Maktav et al., 2005; Dewan and Yamaguchi, 2009). In this perspective, the present paper aims to provide a contribution to the development of risk assessment and mapping procedures, which can support urban planning and decision making in respect to flooding events.The activity was conducted in collaboration with the non-profit organization ITHACA (Information Technology for Humanitarian
Assistance, Cooperation and Action), which cooperates with the World Food Programme of United Nations to support the management and planning of interventions in case of disasters (Ajmar et al., 2008; Ajmar et al., 2011), and which provided data and contextualization for this study.
2. THE STUDY AREA
The study area is located in the center of Bangladesh between 23°54’7’’N,90°18’28’’E and 23°39’38’’N, 90°31’32’’E. It covers about 590 km2 and includes Dhaka, the capital of Bangladesh (Fig. 1).Dhaka is situated on an alluvial terrace, called Modhupur, and it is surrounded by four major rivers: Tongi Canal to the north, the Buriganga River to the south, theBalu River to the east and the Turag River to the west.
Figure 1. The study area (Dhaka, Bangladesh)
A distinct monsoon season affects Dhaka from May to October. The surface elevation of this area ranges from 0.5 to 12 m; these low lands, that serve as detention basin, with the occurrence of the monsoon rains, make the study area dangerously subject to flooding (del Ninno et al., 2001; Dewanet al., 2005).
3. DATA AND METHODOLOGY
3.1 Data collection
For the study, seven Landsat images were collected (Tab.2). To evaluate urban growth in Dhaka and resulting land use/cover changes fiveimages of1989, 2000, 2002 and 2009 were processed. The study area is characterized by strong seasonality so all the images included in the time series were acquired in the same season (between October and November).
To identify systematically flooded areas during the monsoon season, the image of October 2009 was compared with two images of 2010, respectively of January and February, that show the territory at three/four months away from flooding.
Date Sensor Spatial resolution
Product level
04.11.1989 TM 28,5 m 1T
26.11.2000 ETM+ 30 m 1T
01.02.2002 ETM+ 30 m 1T
31.10.2002 ETM+ 30 m 1T
26.10.2009 TM 30 m 1T
30.01.2010 TM 30 m 1T
15.02.2010 TM 30 m 1T
Table 2. Characteristics of satellite data
The size of a Landsat scene is 170 km x 185 km; to select the study area all the images were therefore cropped.
In addition, geospatial information provided by ITHACA (Boccardo et al., 2007) were used; they include land use map, administrative subdivisions (Thana) and major rivers. These data, referred to the local geodetic system Everest_Adj_1937,were projected in WGS 84 to allow the comparison with satellite images.
3.2 Image processing
To obtain multi-temporal land use/cover map (Fig. 4), all the images were processed with amaximum likelihood classification. Seven basic informative classes were identified (Tab. 3) by photointerpretation and spectral profile analyses, and for each one some training sites were selected, also examining high resolution images.
Class Description
Build-up Urban areas, buildings, roads, slum, airports etc. Bare soil Excavation areas, filled area, exposed soil.
Vegetation Deep vegetated areas (deciduous, coniferous, palm forests, etc.).
Cultivated land Agricultural areas, fallow lands and crop fields.
Water_1 Water with suspended solids and sediment transport (river, creeks, flooded areas).
Water_2 Water in contact with vegetation (irrigation ditches, lakes, flooded vegetated areas).
Wetland/lowland Low and wet areas, periodically flooded areas.
Table 3. Land use/cover classes
The images of 2010, acquired far from monsoon season, show no flooded areas, thusWater_1 and Water_2 classes were
replaced with a single one, called Water, that represents the permanent water bodies in the study area.
In the image of October 2002,affected by cloud cover, the classes Cloud and Shadow Cloud were added. The cloud cover affects particularly the urban area, so the built-up areas were identifiedclassifyingan image of February 2002. The loss of information caused by clouds persists in the other cover types; therefore, only Build-up class was used in the following change detection procedure.
Figure 4. Land use/cover maps
3.3 Accuracy assessment: map validation
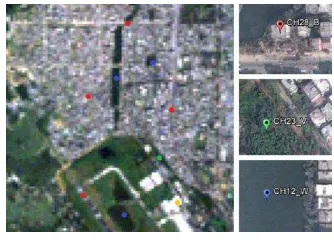
Unfortunately, ground truth data were not available for the study area, therefore a rigorous validation was not possible. However, for a first assessment of the classification accuracy, a number of checkpoints were identified on the Landsat images and their land cover class was verified by photointerpretation with the aid of high-resolution colour images (Fig. 5).In particular, for each class, about a hundred ground truth points were selected and the confusion matrixes were compiled (Tab. 6 ).
The high-resolution images are available since 2001 and only in 2004 covering the entire study area. Therefore, these images have been useful only for 2009 and 2010 mapsvalidation, for which an accuracy higher than 90% was achieved.
Figure 5. Examples of ground truth points in the Landsat images and in the high-resolution images
Overall Accuracy = (577/621) 92,9147 %
Table 6. Example of Confusion matrix for 30.01.2010 image
From the confusion matrix, some observations about the errors that affect the classification come out.
Relevant commission errors have been outlined between Vegetation and Cultivated classes, probably due to a similar spectral response of trees or plants and certain plantations. A similar situation occurs in the 2010 maps for Water and Wetland/lowland classes.
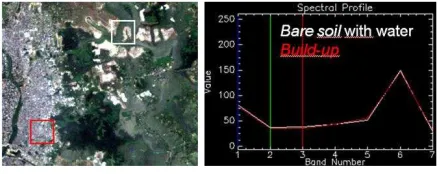
Isolated houses in dense vegetated areas or small canals that run through built-up areas or extensive cultivated land were not detected, because of the spatial resolution of Landsat images. A significant issue for the present study is represented by the commissionerror in the Bare soil class; in particular, in correspondence of sandy or clayey material saturated with water (river banks, or filling material in contact with water) the classifier incorrectly detects urban areas. This can be explained considering that the aggregate on the river banks and mixtures of sand clay and water are used to produce bricks or as construction material in the slum shacks. Therefore, the error resulting from the confusion between Bare soil and Build-up classes depends on the impossibility to distinguish between very similar materials that have almost coincident spectral profiles (Fig. 7).
Figure 7. Spectral profile comparison between filling material in contact with water and urban areas
The same problem occurs for Water and Wetland/lowland classes at the sandy bottom and low water levels.
The 1989 map is particularly afflicted by this problem where the error occurs not only in correspondence of water bodies but also in the inland areas. It is caused by the presence of fluvial material deposits transported by the river overflowing; in fact, in 1988, Bangladesh was hit by an intense flood event. For this reason, the 1989 map was discarded from the land use/cover change study.
4. RESULTS AND DISCUSSION
Maps obtained from the Landsat images classification were compared throughchange detection analyses to quantify land use/cover changes and systematically flooded areas.
4.1 Land use/cover change and urban growth dynamics
From the comparison between 2000 and 2009 maps, it has been observed the pronounced increase of built-up areas and of areas taken up by bare soil. In particular, Build-up class increased approximately by 47%, from 75,4 km2to 111,1 km2, and Bare
soil class grew more than double, from 14,4 km2 to 38,9 km2; vegetated areas remained almost unchanged, while water areas and cultivated land experienced a reduction. Total loss of Water (Water_1+Water_2) and Cultivated land classes was 31,1 km2 and 30,9 km2respectively (Fig. 9).
2000 * 1 Build up, 2 Bare soil, 3 Vegetation, 4 Cultivated land, 5 Water
Table 8. 2000-2009 land use/cover changes matrix (km2)
Figure 9. Land use/cover class statistics (km2)
The urban growth is the main cause of the reduction of cultivated areas; in fact, as can be seen from the land use/cover changes matrix (Tab. 8), Build up class increased by 35,7 km2,
the 92% (32,8 km2) of which, in 2000, were cultivated fields (Fig. 10).
Figure 10. Urban growth in cultivated land between 2000 and 2009 (see legend Fig. 4)
The increase of bare soil was due mainly to the presence, in 2009 map, of many artificial islands; these were made with aggregate extracted from river banksin order to create new areas for construction (Fig. 11). In particular,these expansions invadedthe systematically flooded areas and the cultivated fields.
Bare soil class increasedto 24,5 km2, of which the 60% (14,7
km2) and the 29% (7,2 km2) respectively came from Water and Cultivated Land classes.
Figure 11. Development of artificial islands between 2000-2009
In 2000, 2002 and 2009 maps,Build-up classes were extracted and they were composed in an RGB representation to highlight the urban expansion of Dhaka city. In Fig. 12, the white areas represent built-up areas which remained unchanged in all three years, urban growth between 2002 and 2009 appears with the cyan colour and the city perimeter in 2009 is displayed in blue. Overall, it can be deducted that the urban area grew mainly in the North and in the South East of the study area. Areas classified as urban in the image of 2000 and no longer present in the map of 2009 are shown in red, and they correspond to areas where the confusion between Build-up and Bare soil classeshas been observed during the classification of the 2000 image. The green areas represent the urban class in 2002 that no longer exists in 2009. Only a part of these areas correspond to classification errors between Build up and Bare soil classes, but the majority is located in correspondence of storing areas belonging to brick factories, where the produced bricks are temporarily piled. This has been confirmed by using high resolution colour images. Yellow pixels represent built-up areas between 2000 and 2002 but absent in 2009. Using high-resolution images, it was verified that this is due, at least in part, to the demolition of some buildings and squatter settlements in the urban environment.
Figure 12. Urban growth map (2000-2002-2009)
4.2 Flood-prone areas
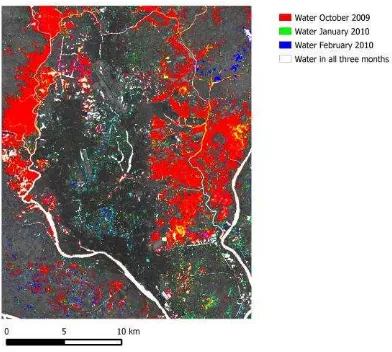
Comparing post-monsoon map of October 2009 with 2010 maps the water bodies permanently in the area and the areas routinely flooded during the monsoon season were identified and quantified.
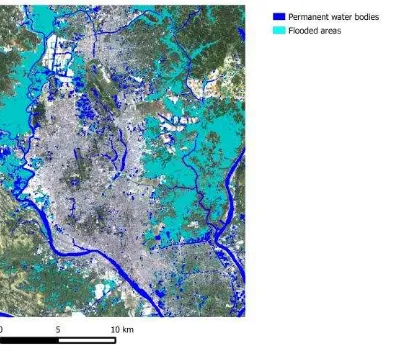
In the maps, Water classes were isolated and for each class was assigned red green and blue colour respectively. Displaying these classes simultaneously, permanent water bodies in the area and flooded area were identified (Fig. 13). In particular, to verify the correctness of the procedure the obtained water bodies data were compared with the vector map of the major rivers described in section 3.1. The water bodies always present in the territory occupy 27,2 km2, instead the flooding affect
115,2 km2,amounting to 20% of the entire study area (Fig. 14).
Figure 13. Overlapping of Water classes
Figure 14. Permanent water bodies and flooded areas
Using an intersection operation between vector layers in a GIS environment, the flooded areas have been associated with administrative divisions of Bangladesh. Therefore, the flooded area was calculated for each district in the study area (Fig. 15).
Figure 15. Flooded area for district.
Through the comparison between the 2009 map and the two
reduced to 96 km2. Even in this case, the space occupied by the flooding is replaced by wetlands and fields but in different proportions. Compared toOctober-January period, the cultivated fields increased (46,7 km2) and wetland decreased (33,3 km2).
Therefore after four months, the flooded areas in October appear as areas of intense agricultural activity characterized by extensive cultivations of Boro rice identified combining the land use data provided by ITHACA.
5. CONCLUSIONS
A post-classification comparison procedure was adopted to quantify the urban expansion in the Dhaka area and to investigate the evolution of routinely flooded areas during monsoon season. Landsat multispectral images were used. Regarding the urban growth, it was observed through the multi-temporal analysis an increase of built-up of about 47% between 2000-2009.This expansion caused the reduction of cultivated land equal to 30,9 km2. In the same period, the development of
artificial islands which have encroached mostly flood-prone areas and water bodies led to an increase of the Bare soil class by 170%.
Table 16. October-January land use/cover changes matrix (km2)
From the comparison between the October 2009 and the two images of January and February 2010, the extension of the flooding, as a result of monsoon rains, was evaluated. In October, about 20% of the study area is affected by flooding; in the following three/four months the flooded zones arereplaced by wetlands and fields.The flooded areaswere quantified for the single districts using GIS tools.
Despite this process suffers from the lack of ground reference data collected on the field, from the confusion matrixes (based on photointerpretation)accuracy values exceeding 90% were obtained, confirming the effectiveness of Landsat images for the identification of the different basic types of coverage. This process suffers of course from the lack of reference data in form of ground truth points collected on the field.
This study is an example of using satellite images as a support for the realization of new products and for the updating of existing databases,in order to make available more detailed information concerning a certain territory, with particular reference to developing countries such as Bangladesh, which often have a strong lack of reliable and updated information of the area. This deficiency is even more significant considering the highly dynamic phenomena that characterize the study area, related both to anthropogenic aspects and natural events.
ACKNOWLEDGEMENTS
The authors want to acknowledge ITHACA (Information Technology for Humanitarian Assistance, Cooperation and Action) and in particular Piero Boccardo and Fabio Giulio Tonolo for providing the main database and for the fruitful discussions.
REFERENCES
Ajmar, A., Boccardo, P., Disabato, F., Giulio Tonolo, F., Perez, F., Sartori, G., 2008. Early impact procedures for flood events. February 2007 Mozambique flood. Italian Journal of Remote Sensing, 40 (3), pp. 65-77.
Ajmar, A., Boccardo, P., Giulio Tonolo, F., 2011. Earthquake damage assessment based on remote sensing data. The Haiti case study, 2011. Italian Journal of Remote Sensing, 43 (2), pp.123-128.
Del Ninno, C., Dorosh, P.A., Smith L.C., Roy, D.K., 2001. The 1998 floods in Bangladesh: disaster impacts, household coping strategies, and responses. Research reports 122, International Food Policy Research Institute (IFPRI). Washington, DC, USA.
Dewan, A.M., Alam, M., Nishigaki, M., 2005. Remote Sensing of 1998 and 2000 Floods in Greater Dhaka, Bangladesh: Experiences from Catastrophic and Normal events. Journal of the Faculty of Environmental Science and Technology, Okayama University, 10(l), pp. 57-65.
Dewan, A.M., Yamaguchi, Y., 2009. Land use and land cover change in Greater Dhaka, Bangladesh: Using remote sensing to promote sustainable urbanization. Applied Geography, 29(3), pp. 390-401.
Islam, K.N., 2000. Temporal mapping and spatial analysis of land transformation due to urbanization and its impact on surface water system: a case from Dhaka metropolitan area, Bangladesh. International Archives of Photogrammetry and Remote Sensing, Amsterdam, Netherlands, Vol. XXXIII, Part B7, pp. 598-605.
Islam, S., Rahman, R., Shahabuddin A.K.M., Ahmed R., 2010. Changes in wetlands in Dhaka city: Trends and physico-environmental consequences. Journal of Life and Earth Science, 5, pp. 37-42.
Maktav, D., Erbek F.S., Jürgens, C., 2005. Remote sensing of urban areas. International Journal of Remote Sensing, 26(4), pp. 655-659.
Rahman, G., Alam, D., Islam, S., 2008. City Growth with Urban Sprawl and Problems of Management for Sustainable Urbanization, Proceedings 44th ISOCARP Congress “Urban Growth without Sprawl. A way Towards Sustainable Urbanization”, Dalian, China.
Rahman, H., Agricultural Land Use and Land susceptibility in Bangladesh: An overview.
http://globalcommunitywebnet.com/GlobalFiles/agriculturallan duse.pdf
United Nations Human Settlements Programme (UN-HABITAT), 2006. THE STATE OF THE WORLD’S CITIES REPORT 2006/2007. UN Report.Earthscan, UK and USA.
United Nations, Department of Economic and Social Affairs, Population Division: World Urbanization Prospects, the 2011 Revision: Highlights. New York, 2012.
![T1 [362008055] BAB II](data:image/gif;base64,R0lGODlhAQABAIAAAP///wAAACH5BAEAAAAALAAAAAABAAEAAAICRAEAOw==)