A MICRO-UAV SYSTEM FOR FOREST MANAGEMENT
T. Hormigoa, J. Araújoa
a
Spin.Works, Rua de Fundões, 151, Centro Empresarial e Tecnológico, São João da Madeira, Portugal – (tiago.hormigo, joao.araujo)@spinworks.pt
KEY WORDS: Micro-UAV, Forest Management, Fire Detection, Aerial Photogrammetry, Ground Control Station, Image Processing, Remote Piloting
ABSTRACT:
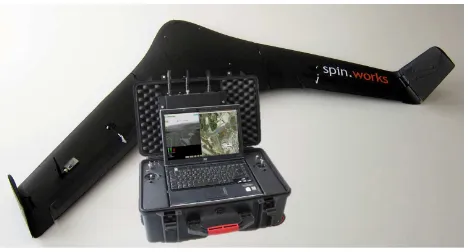
Spin.Works has developed a complete micro-UAV system with the purpose of supporting forest management activities. The aircraft is based on a winged-body design spanning 1.8m with a maximum take-off weight of 2kg, and can carry out missions lasting up to 2h at a cruise speed of about 60km/h. The corresponding ground station ensures the mission planning functions, real-time flight monitoring and visualization, and serves also as a real-time and post-flight data exploitation platform. A particular emphasis is placed on image processing techniques applied to two operational concepts: a fire detection service and a forest mapping service. The real-time operations related to fire detection consist on object tracking and geo-referencing functions, which can be operated by a user directly over the video stream, enabling the quick estimation of the 3D location (latitude, longitude, altitude) of suspected fires. The post-flight processing consists of extracting valuable knowledge from the payload data, in particular tree coverage maps, orthophoto mosaics and Digital Surface Models (DSMs), which can be used for further forest characterization such as wood and cork volume estimation.
The system is currently entering initial operations, with expanded operations expected during Q3 2013.
INTRODUCTION
Forests are an essential part of the environment, contributing towards water quality and biodiversity, and providing food, energy and medicinal resources, as well as construction materials. Forests also represent a large percentage of land, a relevant economic value (1% of GDP) and a significant source of employment (over 3 million jobs) in Europe, which underscores their role in the lives of many Europeans, the majority of which live in rural areas. The sustainable management of this resource is thus among one the foremost challenges to our society, which can only be addressed through a combination of policy, technology and infrastructure efforts such as to have a high probability of success.
Two of the key elements in the sustainable forest management are, on one hand, their protection against wildfires (through both planning, continuous monitoring and effective combat) and, on the other, an assessment of the economic value of the forest biomass. In this respect, and while an assessment of the available wood - both as an energy resource and as a construction material – is more generally applicable to forests throughout the continent, in the specific case of low-density cork oak forests common throughout Southwestern Europe, the focus variable is, instead, an assessment of the available cork.
In the present work, we present a micro-UAV system, which is described as follows: In section 1 we present 1) the overall system performance (section 1.1); 2) the ground station (section 1.2).
In section 2, we describe the mathematical background behind the UAV-based fire location service, including a tool based on motion tracking of real-time video images transmitted to the ground station. In section 3, we look at the approach taken for the reconstruction of orthomosaics and Digital Surface Models to be used in the assessment of wood volume (section 3.1) and the image processing techniques involved in the estimation of
cork volume (section 3.2). In addition, in section 4 we describe the concepts of operation which we developed (section 4.1), as well as the flight planning tools used to implement them (section 4.2), On section 5 we show results from a flight test under wind conditions. Finally on section 6 we summarize the outcome of the work.
1 UAV SYSTEM
1.1 System Performance
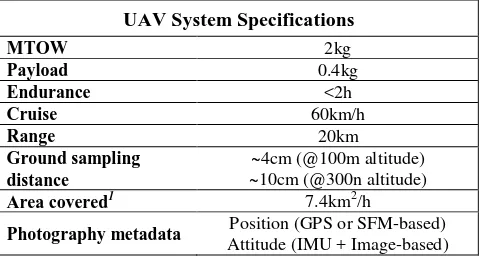
The performance of the micro-UAV system we are currently using can be summarized as follows:
UAV System Specifications
MTOW 2kg
Payload 0.4kg
Endurance <2h
Cruise 60km/h
Range 20km
Ground sampling distance
~4cm (@100m altitude) ~10cm (@300n altitude)
Area covered1 7.4km2/h
Photography metadata Position (GPS or SFM-based) Attitude (IMU + Image-based)
Table 1: Spin.Works S-20 key performance data.
1
Accomodating a 80% longitudinal and 60% lateral overlay between images, at an altitude of 200m (approximately 7cm/pixel resolution). For different altitudes the areas covered scale accordingly.
Figure 1: Spin.Works S-20 micro-UAV.
1.2 Ground Station
The ground station is a multi-purpose platform that ensures the mission planning functions, real-time flight monitoring and visualization, and also serves as a real-time or post-flight data exploitation platform. The ground station provides tools for mission planning, allows a pilot to manually control the UAV and decide when to engage and disengage the autopilot, handles the bi-directional communications with the UAV, treats the gathered information in real-time and serves the data to the ground crew and other potential users, records video and logs telemetry data and provides tools for on-site mission assessment.
The hardware is composed by a laptop, a set of communication links composed by radios and antennas, control pads for manual control of the UAV, and a Wifi router for serving wireless data and video to a network of local users.
The software runs on the Linux based Ubuntu operating system. The main application front end displays the real-time video from the UAV pilot seat with the essential telemetry data overlaid in the form of a head-up display (HUD). Other functions are available through a menu bar that the user can call upon when needed. These functions include calling up displays for looking at telemetry data, enabling object tracking and geo-referencing functions, and more trivial functionalities such as reset mission timer, start or stop video recording, hide HUD display or change its colour. On the background, all telemetry data is being saved to the hard drive for post-processing. Additionally, the main application is serving the information it gathers to a list of clients that connect to it. It can also relay commands being sent from client stations to the UAV. These functionalities allow for mission planning and mission monitoring to be handled by separate applications, either running locally on the ground station laptop or on a computer connected to the local wireless network.
A mapping window application creates a front end display consisting of a map of the local geographic area where the UAV is located, overlaid with mission related information. It is used for mission planning and mission monitoring in real-time.
The post-processing of the data can be handled by a set of different software tools, depending on the type of mission. The analysis of the UAV flight is carried out by a custom built toolbox for MATLAB. It reads the telemetry data and performs data consistency checks, time synchronization between telemetry data, video and photos (payload data), flight path
reconstruction, and data plots, creating input files for other post-processing tools, such as image processing tools.
2 IMAGE-BASED FIRE LOCATION
Monitoring a given forested region for wildfires is typically performed visually, either from the ground, from suitably-placed observation towers or from flying platforms. From the latter two - both of which imply added costs - the first solution is able to observe only a fixed area around its location, which may include blind spots, whereas the second is even more expensive operationally (since it requires the use of both manpower and aircraft, resulting in prohibitively high cumulative costs when used over sufficiently large areas). Conceptually, real-time satellite imagery would be more suitable to perform detection. In practice, however, this would require high-altitude balloons, geostationary satellites (which would provide images with too low resolution to be helpful), or a sufficiently dense network of low Earth-orbit satellites to ensure continuous ground observation, which would require a far larger investment than is justified by the extent of the regions affected by wildfires in Europe.
A smaller-cost alternative would be to use lighter, unmanned autonomous vehicles to perform the same function. The elimination of the costs associated to the manpower required to operate aircraft, as well as the decrease in costs resulting from using smaller aircraft, would translate to a smaller overall system cost. Unfortunately, the current generation of UAV is neither sufficiently autonomous – requiring a human pilot to be operated – nor is it legal to fly these vehicles, at least until a reliable means for two-way detection of the vehicle in a given airspace has been proven.
As such, many forest producers in southern Europe have resorted to mobile ground teams, which investigate occurrences every time a suspected wildfire is reported. These teams operate initially on very limited amounts of information, such as a general observing direction performed by individuals from a certain location, and must be prepared to deploy at any given time, during a large fraction of the year (in particular, during the summer).
While the costs incurred by these organizations are smaller, by comparison, to other alternatives, some are now actively pursuing the use of small, remotely-piloted vehicles carrying a camera and onboard instrumentation, and capable of real-time data and video telemetry, something which provides enough information for a ground user to directly identify areas where a suspected wildfire may occur. It is in the scope of this scenario that we have developed a ground-based software tool fully integrated with UAV payload and the onboard computer that implements automated geo-referencing algorithms, which are described next.
2.1 Observation model
The underlying mathematical model for fire location can be described using the condensed expression:
(
i i)
i( )
i(
j j)
j
=
F
t
,
x
,u
=
p
+
kM
f
u
,
v
X
θ
(1)
In the above equation, Xj is the inferred ground location in an East-North-Up (ENU) frame, associated the system state vectors at a given instant (xi=[pi, θi]T), where the camera position is pi and the camera attitude is represented by the Euler angles θi=[φi,θi,ψi]T, and the image pixel coordinates u=(uj,vj); k is a constant which is derived from the assumption that the z-axis coordinate of Xj is identical to the ground z-axis coordinate in a suitable ENU map frame; M(κi,φi,ωi) is the matrix transformation from the camera to the map reference frame:
( ) ( ) ( ) frames as estimated by a navigation system, and TV→MAP is the fixed transformation matrix between Vertical and Map frames; Finally, f is the function which translates image coordinates into 3D directions in the camera frame:
( )
(
(
)
)
sizes respectively. It should be noted that this set up requires a good observation of aircraft position and attitude at all instants, provided by a navigation system which continuously filters IMU, magnetometer and GPS measurements during the flight, or extracted from onboard-logged data in post-flight processing.2.2 Observation model
Uncertainties in the estimated ground location corresponding to a set of image coordinates can be projected from state uncertainties, by calculating the partial derivatives of feature j with respect to the states xi, Pi(Xj) = J Pi JT, where Pi(Xj) is the covariance matrix associated to the ground location of feature j at instant i, and J is the Jacobian of the feature location with respect to the system states.
These uncertainties can be translated into image coordinates by using the inverted of (1), and are displayed on the ground station screen in real-time, on top of the received image.
2.3 Motion tracking
While the above model relies on instantaneous user-selected image coordinates to provide estimates of ground locations, tracking a specific feature through a set of video images, by means of computer vision techniques such as template matching, is also possible. For the case where the ground station is operated for fire direction purposes, we rely on the user to select the region of interest in a base image, then use it as a template to match in subsequent images according to the techniques described in (Lewis, 1999).
In this case, and in order to keep real-time tracking of a visual target during temporary occlusions, we use Kalman filtering techniques as in (Cuevas, 2005) to estimate the relative image position and velocity of a selected image area over an extended time frame, a capability which ultimately enables the calculation of substantially more precise estimates of a fixed target (for instance, the fire location) than in the above case, via triangulation or intersection methods such as those described in (Triggs, 2000).
3 DATA PRODUCT EXTRACTION FROM UAV-BASED IMAGING
3.1 Ortophoto mosaics and Digital Surface Models
The construction of orthophoto mosaics and the reconstruction of Digital Surface Models from the imaged terrain are the basic data products for forest management purposes. To this purpose, we have internally developed software which automatically searches each acquired image for unique, prominent features (currently SURF features are used), identifies common features in the images most likely to overlay (based on the post-flight filtering of synchronized GPS, IMU, air data and forward-looking video data), and attempts to locate features appearing in multiple images (following the k-d tree search method shown in (Wald, 2006), in order to provide an initial basis for image correspondence. A small number of invalid pairs has been found to remain even after this step, however – therefore a random sampling algorithm has been implemented to filter out invalid correspondences, based on the errors produced by a statistically significant (Stewart, 1999) set of homographies generated from combinations of 4 image point pairs.
At this point, the validated point pairs, the initial position and attitude estimates, and the known positions of several ground control points, are used in a bundle adjustment tool based on the algorithm described in (Lourakis, 2009) to yield the first estimates of feature 3D positions. The output from this tool can be subsequently used in conjunction with the CMVS tool (Furukawa, 2010) for a dense reconstruction process, resulting on the recovery of high resolution Digital Surface Models (DSMs). It is this product that is used to construct textured maps – orthorectified mosaics of the imaged terrain.
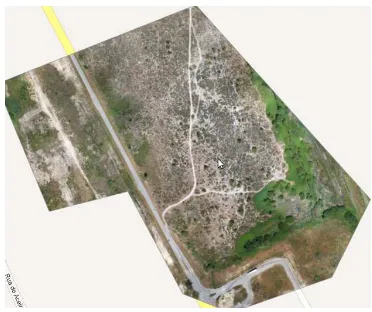
As an alternative to the above-described method, which often results in less detailed outputs, commercially available software packages like PhotoMod, as well as cloud-based services such as Pix4D, have been used to produce high-resolution (5-10cm), low error (~10cm) mosaics and digital terrain models. An example of an ortophoto mosaic and a DSM, produced using the Pix4D Cloud (Pix4D, 2013) service can be found in Figure 2 and Figure 3 below.
Figure 2: Example of an orthomosaic obtained from a set of aerial photographs with an average resolution of 6.9cm,
obtained using the Spin.Works S-20 system.
Figure 3: Example of a Digital Surface Map resulting from the same set of aerial photographs as in Figure 2.
3.2 Cork Volume Estimation
Image-derived maps of forested regions are a primary product from our system. This product results from the post-flight processing of onboard GPS, IMU and magnetometer measurements in conjunction with time-tagged and synchronized images collected along the nadir direction.
There are two kinds of data which are calculated in this process. For more sparsely forested areas, trees are detected and located individually, and their dimensions are determined from a combination of image processing and assumptions made over the appropriate tree model. For more densely forested areas, continuous areas are delineated and a tree size is assumed based on the statistical distribution of nearby individual trees in order to determine the total amount of cork volume. The process is shown in Figure 4.
Flight images are initially smoothed using a median filter, to remove noise while preserving edge data for subsequent operations. Colors are also converted into HSV coordinates, after which the value channel is separated (it was observed through experience that this channel provided the most useful data for image segmentation and tree identification purposes).
Next, an image thresholding algorithm is used, in which the threshold value is determined for each flight according to
lighting conditions, to distinguish the tree-covered areas from the image background. Segmentation is then performed on the resulting image, leading to the identification of all connected tree areas in the image. Areas smaller than a certain value, or which have a width smaller than a given value (which is associated to the minimum tree size and the expected ground resolution), are automatically excluded. The remaining areas are classified either as individual trees or as forested regions, according to their largest dimension.
Figure 4: Cork Tree Volume Estimation from nadir imaging and post-flight navigation data.
At this point, different algorithms are used for trees and tree agglomerates. Individual trees are processed first, for which navigation data (position and attitude) is used in conjunction with an assumed tree shape to determine the tree location and size. After all individual trees have been processed, their average size is calculated, and the value is used to determine a rough estimate of the number of trees contained in each large patch of forested area. The total cork volume can then be assessed from empirical relations between the tree size, age and the cork volume per tree.
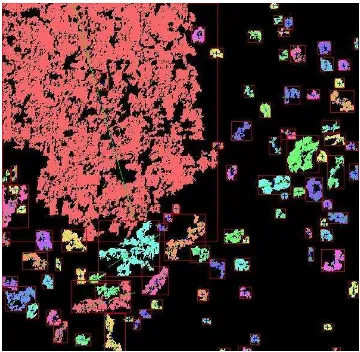
Figure 5 shows an example of the input image, and Figure 6 shows the processing output, for a forested area which is partly continuous forest and partly scattered trees. It can be seen that both areas are accurately identified, even if some of the detected objects in the image are clumps of trees instead of individual trees. The dimensions of each tree are estimated from ellipse fits, and each tree can be geo-referenced during post-processing using navigation data.
4 MISSION PLANNING
4.1 Concepts of Operation
The two different missions which are currently performed by our micro-UAV system can be characterized as fire detection and positioning missions, on one hand, and forest mapping missions, on the other. The first case corresponds to a situation where a report of suspected fire is issued by the appropriate authorities (in some areas this responsibility is assumed by local forestry associations), in the absence of sufficiently detailed information regarding its actual location.
Figure 5: Visual image of a mixed continuous/scattered tree area of cork oak forest in southern Portugal.
Figure 6: Results from the tree detection algorithm.
Normally, at this point ground-based mobile teams would drive towards the suspected location and further investigate the occurrence; however, in many cases the event is exceedingly difficult to spot from the ground, or its location is all but inaccessible to ground vehicles, such that its confirmation may be delayed until the wildfire is already affecting a significant area, or is altogether impossible until it does.
It is in these cases that a low-cost aerial platform is of most use. Instead of sending a ground team towards the suspected fire location, a small remotely-piloted vehicle is launched using a catapult, quickly rising to an altitude from where signs of wildfire occurrences are far more easily detected through real-time video streams obtained with a forward-looking visual camera, and automatically guided towards the suspect area. Once an image feature consistent with wildfire has been spotted by the ground station operator, its’ image coordinates can be correlated to ground locations by using navigation telemetry and determining the intersection of the line-of-sight represented in the map reference frame and the ground (in the special case that a motion tracking function is used over a user-specified image patch, line-of-sight directions can be accumulated over time to improve the precision of ground location estimates). A
confirmation of occurrence is then sent back to the alarm issuer, and detailed location estimates are forwarded to fire fighting teams to be used as inputs to their intervention. This type of missions can provide both permanent (24/7) availability and aerial video feed with the latter, requiring periodic landings and subsequent launch of replacement aircraft.
The second type of missions performed by our system are forest mapping missions. Typically, these are planned well in advance of the flight; however, and given the low flying speeds and the vehicle configuration, they are subject to weather conditions, therefore a mission planning capability has been deployed for greater flexibility, namely where the preferential image strip orientation can be adjusted by the user according to wind conditions observed on site at the time of the flight.
The flight profile differs from the fire location mission primarily in the sense that, unlike in the former, for this mission a specified trajectory must be flown precisely in order to gather suitable imaging data from a pre-selected area. After the launch from a catapult, the aircraft flies towards the start of the first imaging strip, where the autopilot switches to mapping mode. In this mode, the autopilot tracks (segment-by-segment) the uploaded flight plan, automatically correcting for winds by pointing the aircraft upwind, while keeping the wings levelled. Imaging occurs at specific instances, which are calculated by the onboard computer to correspond to pre-determined longitudinal overlays between consecutive images. Each image strip concludes once the distance to a trajectory waypoint (placed somewhat beyond the location of the final image for each strip) falls below a given value, after which the aircraft turns around and starts taking a new strip of images.
This sequence is repeated until all planned strips have been collected. If and whenever necessary, imaging is stopped at the end of a strip, the aircraft is landed, its batteries are replaced, and a new take-off takes place, restarting the process a few minutes later. Upon the conclusion of the mission, all images are downloaded to a server, and the post-processing activities follow, leading to the desired data products (typically, orthophoto mosaics, Digital Surface Maps, and tree position lists are produced depending on the specific mission which is carried out).
4.2 Flight Planning
For forest mapping missions, flight trajectory and imaging plans are generated automatically and, whenever necessary, on site manual adjustments are allowed either to update wind direction or to account for obstacles.
In order to generate a trajectory plan, user input conditions include the area to be covered, the ground resolution and (longitudinal and lateral) image overlay requirements, as well as constraints on the take-off/landing location. The wind vector can be retrieved either from in-situ measurements, or alternatively from available weather forecasts for the location and time of flight.
The ground resolution essentially determines the flight altitude, and the ground size of each image. As a rule of thumb, ground resolutions of 4-10cm are typically sought, resulting in flight altitudes of 100-300m and similar image dimensions, considering the 10MP digital camera employed (a Canon S95). International Archives of the Photogrammetry, Remote Sensing and Spatial Information Sciences, Volume XL-1/W2, 2013
Many of the mapping areas where we have operated are subject to seasonal winds from the northwest which often exceed 30km/h, which affect both trajectory and imaging performance. In order to deal with this perturbation, two general rules for the generation of the flight plan are followed: 1) imaging takes place preferably perpendicular to the wind direction conditions, and 2) each successive image strip is sequentially placed upwind from the previous strip. This helps to keep along-track image separation approximately constant for a constant imaging rate, airspeed and throttle setting (there are no upwind and downwind strips), and also results in a better trajectory tracking performance during turnarounds, yielding more uniform imaging results. Still, in most cases, wind direction can be safely ignored without much consequence, and mission planning is fully automated.
In our mission planning algorithm, longitudinal image separation requirements are simply translated into imaging rate requirements, while lateral separation requirements result in separations between successive imaging strips which may be as little as 1/5 of the image width, if a maximum roll of 10deg and a maximum relative yaw, with respect to the flight path, of 30 degrees, are taken into account.
5 FLIGHT TESTING
For purposes of flight testing, closed paths can be very useful to determine trajectory tracking performance and dispersions/repeatability. The data shown in Figure 7 corresponds to a flight which took place under an Easterly 8kt wind (therefore not aligned with the flight plan, as would normally be the case in standard operations) with the aircraft configured with two cameras (a forward-looking camera transmitting real-time video plus and a nadir pointing high resolution visual camera), totalling a take off weight of 1.910kg.
The mission involved a flying at 200m AGL (Above Ground Level), and the portion of the flight shown here illustrates a segment of 3 laps around a 200x300m left-hand pattern at the designated target area. As can be observed from the direction of the wind and the magenta arrows which represent the heading (direction of the vehicle’s nose), the aircraft's flight control system automatically corrects for the wind by pointing the nose slightly upwind such that the resulting course-over-ground coincides with the desired ground track. The plot shows a systematic tendency to overshoot the turns, which results from commanding the turns at a fixed distance from the waypoint rather than triggering the turns accounting for speed and wind impact on turns, as already implemented in the later version of the flight control software. In fact, this is actually the only relevant source for trajectory deformation, with the data showing consistent and adequate convergence towards the desired path.
6 CONCLUSIONS
We have developed a micro-UAV system for two types of missions: fire detection and forest mapping services. We hereby describe both the system (the aircraft, which production is now industrialized, as well as the ground station) and present several image processing techniques which are used in the scope of the two concepts of operation for different purposes: fire location, fixed and moving target tracking, mosaic construction, and tree and forested area detection and evaluation. We furthermore
show operational results demonstrating the image-based capabilities of the system. Finally, we show the closed-loop path tracking response to windy conditions, relatively frequent in the expected areas of operation.
Figure 7: Closed-loop path tracking performance under moderate (8kt) easterly winds. For this mission, the waypoints were defined as the corners of the black rectangle.
7 REFERENCES
J. P. Lewis, 1995, Fast Normalized Cross-Correlation, Vision Interface, pp. 120-123
E. Cuevas, D. Zaldivar, R. Rojas, 2005. Kalman filter for vision tracking, Technical Report B 05-12, Freie Universität Berlin, Fachbereich Mathematik und Informatik
B. Triggs, P. McLauchlan, R. Hartley, and Fitzgibbon, 2000.
Bundle adjustment – a modern synthesis, Vision Algorithms: Theory and Practice, New York, Springer-Verlag, p. 327 I. Wald, V. Havran, 2006. On building fast kd-Trees for ray tracing, and on doing that in O(N log N), IEEE Symposium on Interactive Ray Tracing, pp.61-70
C. Stewart, 1999. Robust parameter estimation in computer vision, SIAM Reviews, vol. 41, pp. 513-537
M. I. A. Lourakis, A. A. Argyros, 2009. SBA: A Software Package for Generic Sparse Bundle Adjustment, ACM Trans. Math. Software, vol. 36, nr. 1, article 2
Y. Furukawa, J. Ponce, 2010. Accurate, Dense, and Robust Multi-View Stereopsis, IEEE Transactions on Pattern Analysis and Machine Intelligence, vol. 43, iss. 8, pp. 1362-1376 Pix4d, 2013 (http://www.pix4d.com)
8 ACKNOWLEDGEMENTS
We would like to thank our colleagues Artur Fouto, João Oliveira, Duarte Belo and Vasco Pimenta for the invaluable contributions towards the development of the S-20 micro-UAV and the corresponding ground station which have made the work hereby described possible.
The R&D described in this paper was co-funded under the European Regional Development Fund, through the Portuguese National Strategic Reference Framework 2007-2013 Operational Program "ON.2 – O Novo Norte".