ACCURACY ASSESSMENT IN STRUCTURE FROM MOTION 3D RECONSTRUCTION
FROM UAV-BORN IMAGES: THE INFLUENCE OF THE DATA PROCESSING
METHODS
G. Caroti,I. Martínez-Espejo Zaragoza, A. Piemonte
Dipartimento di Ingegneria Civile e Industriale, Università di Pisa, Largo Lucio Lazzarino 1 56123 PISA, phone 050 221 7770, e-mail [email protected]
Commission VI, WG VI/4
KEY WORDS: 3D Surveying - Low cost - UAV - Laser Scanner - Structure from Motion - Accuracy
ABSTRACT:
The evolution of Structure from Motion (SfM) techniques and their integration with the established procedures of classic stereoscopic photogrammetric survey have provided a very effective tool for the production of three-dimensional textured models. Such models are not only aesthetically pleasing but can also contain metric information, the quality of which depends on both survey type and applied processing methodologies. An open research topic in this area refers to checking attainable accuracy levels. The knowledge of such accuracy is essential, especially in the integration of models obtained through SfM with other models derived from different sensors or methods (laser scanning, classic photogrammetry ...). Accuracy checks may be conducted by either comparing SfM models against a reference one or measuring the deviation of control points identified on models and measured with classic topographic instrumentation and methodologies. This paper presents an analysis of attainable accuracy levels, according to different approaches of survey and data processing. For this purpose, a survey of the Church of San Miniato in Marcianella (Pisa, Italy), has been used. The dataset is an integration of laser scanning with terrestrial and UAV-borne photogrammetric surveys; in addition, a high precision topographic network was established for the specific purpose. In particular, laser scanning has been used for the interior and the exterior of the church, with the exclusion of the roof, while UAVs have been used for the photogrammetric survey of both roof, with horizontal strips, and façade, with vertical strips.
1. INTRODUCTION
The evolution of Structure from Motion (SfM) techniques and their integration with the established procedures of classic stereoscopic photogrammetric survey have provided a very effective tool for the production of three-dimensional textured models.
Military achievements of UAVs (Unmanned Aerial Vehicles) have provided an effective motivation for the development of such aircrafts also for civilian destinations (e.g. environmental and safety monitoring), with particular attention to the field of surveying, in which, if appropriately fitted, they provide a valuable support in photogrammetric campaigns. The use of multi-rotor systems allows achieving both horizontal and vertical photogrammetric strips in close proximity to the survey objects.
Several software offerings, both commercial and open source, are available for automatic processing of these strips, also allowing, with comparative ease, to derive three-dimensional models from collections of images.
Such models are not only aesthetically pleasing but can also contain metric information, the quality of which depends on several factors: photo capturing strategies, instruments, metric accuracy and surveying methodologies for ground geometric references (control points), geometric resolution and radiometric quality of images and applied processing methodologies.
UAV-based surveying has long been marketed to professional operators as an ultra-low cost methodology, in terms of both economic engagement and specific field-related knowledge. The authors’ experience in the context of several courses on UAV-based photogrammetry held in Italy, has shown that only
a small fraction of potential operators of UAV-based surveying is aware that knowledge of photogrammetry basics and good surveying rules is required to achieve a correct metric survey, rather than a mere metric survey.
The economic commitment required to follow flight-training courses and to achieve the relevant certifications (issued by ENAC in Italy), to purchase aircraft, software and what is needed does not hold back as much as the approach to photogrammetry and surveying basics, in order to program, perform and control data acquisition and processing workflow. The availability of processing software based on Computer Vision algorithms in user-friendly packages, featuring simple user interfaces with few operator-selectable choices, somehow masks the basic aspects in planning, processing control and above all reliability of data as a final product (Santise et al., 2014).
As regards any possible fear that this new technology could be incorrectly used, it could be argued that in this field, the current situation is similar to when GPSs and laser scanners were first marketed.
In the Authors’ opinion, the situation in the field of UAV-based survey is very different. In fact, back then, GPS and laser scanning instruments were marketed at high prices, thus operating a definite selection among potential operators. One could expect that only professionals with experience in the specific technical field would approach these innovative surveying methodologies.
Current ENAC regulations and the relevant 2014 implementation (a new release, scheduled for May ’15, had not been issued yet as of late June) have hindered the use of UAVs in work activities, due to strong limitations of non-critical operating areas and complex authorization procedures (the first authorities delegated by ENAC to issue the required authorizations have not been acknowledged in Italy until January 2015).
In this context, inexperienced operators could exploit this surveying methodology, hiring specialized third parties for UAV-based image collection, and surveying GCPs (Ground Control Points) on their own, in order to add metric significance to the survey.
GCPs are used to determine internal orientation parameters if focal length, principal point and radial/tangential distortions are set as unknown in Bundle adjustment, as well as to improve the overall accuracy of the model, and can also be used as Check Points (CPs) to check the accuracy of the results.
They are also required to georeference the photogrammetric model with an established local or national coordinate system. Overall accuracy of the final product is affected from both the accuracy of GCPs coordinates (which should exceed, or at least match, requirements for the final product of the survey), and the accuracy by which control points are detected and marked on images (GCPs should be signaled by means of properly dimensioned targets, allowing high visibility and easy detection in images).
The present contribution aims to check the influence of number and layout of GCPs on the generation of 3D models by UAV-based images, in horizontal and vertical flight, on a test area including a small building, operating the survey of GCPs like a operator lacking specific surveying experience and looking to exploit this methodology for a quick, low-cost survey.
2. STATE OF THE ART
Accuracy checks in DEMs (Digital Elevation Models) produced by UAV-borne images still have several open topics, as several papers presented in recent workshops and reviews provide evidence for (e.g. Bolognesi et al., 2014; Santise et al., 2014; Nocerino et al., 2014; Colomina & Molina, 2014; Eisenbeiß, 2009; Nex & Remondino, 2014).
Checks of rendering precision can be performed either by comparing SfM-derived models against reference models with known precision, or by measuring the deviation of control points identified on the model and surveyed with traditional topographical methods and instruments [Bolognesi et al., 2014; Gruen et al., 2012; Santise et al., 2014].
The knowledge of these precision levels is most important especially for the integration of SfM derived models with others derived by different sensors and/or methodologies (laser scanning, classic photogrammetry, etc.).
In two recent studies (Nocerino et al., 2014; Santise et al. 2014) researchers have investigated these factors at different rendering scales (1:1000, 1:50, 1:20), with different surveying methodologies (ground- and UAV-based images) and on variable survey area extension (500 to 60m).
Variations in RMSE (Root Mean Square Error) – considered by some Authors (Li, 1988; Yang e Hodler, 2000) as the most used global precision estimator in DEM accuracy assessment – have been analyzed in relation to changes in number and 2- and 3-D layout of GCPs.
3. MATERIALS AND METHODS
The present work has been carried out following a suitable approach, in the Authors’ opinion, for any operator lacking specific surveying experience, opting for this methodology in order to have a low-cost survey and entrusting the UAV-based survey to a specialized company.
In this context, GCPs and CPs have been identified by details of roof, façade and pavement surrounding the church, rather than using marker-based signalization.
This choice was made to overcome the logistic difficulties in placing targets at different levels and because, in the Authors’ opinion, it would be the most common working option for a standard operator.
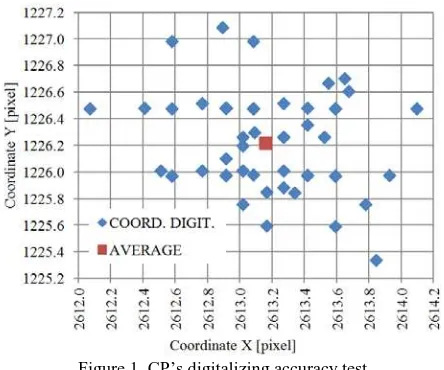
This decision leads to greater difficulties in detecting and subsequently marking points on the image, and introduces collimation errors that affect the overall accuracy of the survey. In order to take into account this problem and the need to process UAV-borne images in different modes, the same coordinate digitalization of GCPs and CPs has been used for all processing.
In this way, possible digitalization errors affect all processing, the same way as a systematic error.
The standard deviation found by independently repeating coordinate digitalization of the same points was about 0.5 pixels (Figure 1).
Figure 1. CP’s digitalizing accuracy test
Images have been processed with Agisoft’s PhotoScan, a commercial software.
3.1 Survey object
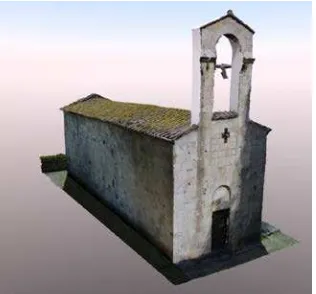
The survey object is San Miniato’s church in Marcianella (Cascina, Pisa, Italy). It has been chosen as test field for its small dimensions, the presence of survey elements at different levels and its placing in a secluded, quiet area.
Figure 2. San Miniato church, the main façade
The interior is fully accessible and includes a single aisle. The exterior is easily accessible along the South and West sides, while the presence of trees and walls hampers access to the North and East façades, respectively.
3.2 UAV system and flight mission
The UAV used in this work (Figure 3) is the SCARAB, a hex rotor prototype manufactured by Pisa, Italy-based Costruzioni Aero Meccaniche (CAM) (Caroti and Piemonte, 2013).
The SCARAB system has been designed and manufactured for a payload of about 2 kg. It has an independent flight termination system, and a recent 8-rotor evolution has been fitted with a parachute as an added safety device.
The camera used for the survey is a Nikon D600 SLR (35.9mm x 24.0mm CMOS sensor, 6016 x 4016 pixels), fitted with a fixed focal Nikkor lens (50mm, f/1.8), for a total weight of about 1.5kg.
The camera has been mounted on the UAV with the short side of the sensor along the flight direction, in order to minimize the photogrammetric strips needed to survey the object.
This system has performed two flights, the first for surveying the roof and the second for surveying the main (W) façade, avoiding tilted camera orientation and keeping the same distance from the survey object.
Due to the trees surrounding the survey object, both flights have been performed in manual mode, with support from telemetry and video streamed in real time to the ground station from a low-resolution video camera fitted on the UAV along the main camera.
Common settings for both flights:
• Images collected with an f11 aperture priority and 1/800 – 1/1000 shutter speed;
• Flight speed about 2 m/s, with calculated Image Motion Compensation Distortion < 1 pixel;
• Interval between shots at 1 s, with an average shot base of about 2 m and end lap of 80%.
These settings enable to detect the same point on at least 3-4 images, also granting a good configuration for subsequent processing with SfM algorithms.
In these surveying conditions, aircraft and camera are about 27 m above GCPs on the ground, 20 m above GCPs on the roof and 14.5 m above those on top of the belfry, with a Ground Sampling Distance (GSD) of 3.2 mm, 2.4 mm and 1.7 mm respectively.
Survey of the main façade included two vertical strips, at an average distance of about 15 m from façade and GCPs, with a GSD of about 1.8 mm.
Figure 3. SCARAB UAV system
3.3 Reference measurements
Reference measurements have been collected by means of both classic topography and laser scanning surveys.
As regards classic topography, a support topographic network has been established by means of a Leica Geosystems’ TPS1201+ total station. It includes 4 survey markers, from which 57 GCPs, on the ground and on the building, have been measured. The layout of the GCPs is as follows:
• 11 on ground;
• 31 on the façade, evenly distributed at different levels; • 15 on the roof, of which 9 along the eaves, 1 on top
and 5 on top of the bell tower.
As previously stated, GCPs have been identified as details of the survey object and the surrounding area.
After processing the topographical measures, point coordinates have been framed in a reference system with the X-axis parallel to the main façade; consequently, direction of the Y-axis is East and subparallel to flight direction and main axis of the building. Z coordinate acts as relative elevation. This network of control points has provided a point set whose coordinates can be assumed as reference for accuracy checks on the models; besides, it has allowed exact registration of each survey in a single reference system.
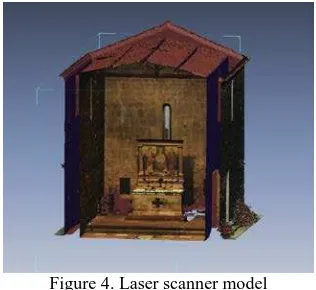
Figure 4. Laser scanner model
manufacturer, the scanner positioning precision at this range is 6 mm. Laser surveys, of both interior and exterior, have subsequently been framed in the same reference system of the topographic network. Laser models of the building required seven and four scans, for exterior and interior respectively. Merging of georeferred clouds (Figure 4) provides a global 3D reference model of the church (save for the roof) for comparison with SfM-derived models: in this case, CPs are less accurate but much denser.
3.4 Accuracy assessment
In the present work, images have been processed using Agisoft’s Photoscan Professional software, a well-known product in both scientific and technical fields. This choice has allowed to address inexperienced users by setting up a simplified, mostly automated photogrammetric workflow able to define external and internal parameters for images orientation, and to generate a dense 3D cloud, used to derive mesh models of the survey object.
All processing, except when explicitly stated, has been performed according to this mode, i.e. the most likely used from operators without field-specific training: calibration parameters of camera and lens are computed, taking into account operating conditions, during self-calibrating bundle adjustment procedure. The same UAV-borne image set has yielded, in different modes, models of façade and roof, which, having been framed in the same reference system, have been integrated with the laser models (Figure 5).
Figure 5. Laser scanner - UAV SfM integrated model
Photogrammetric processing was performed considering two main configurations for bundle adjustment: the first one is in unconstrained network (Free Net) and the other is solved with constrains (Constrained). Each configuration has been processed considering different layouts and number of Ground Control Points (GCPs).
The same set of UAV-based images has yielded façade and roof models in different modes. Accuracy of photogrammetric output has been evaluated by means of the RMSE estimator. It has been computed comparing coordinates of CPs measured on 3D models against reference coordinates.
4. RESULTS AND DISCUSSION
4.1 The photogrammetric façade models accuracy assessment
Processing UAV-borne images of the façade, two models have been generated with different GCP layouts:
- Case A: 6 GCPs evenly distributed on the façade; - Case B: 12 GCPs evenly distributed on the façade.
Figure 6. Façade GCPs and CPs map.
In order to evaluate the influence of number and layout of GCPs on model accuracy, both topographic and laser scanning surveys have been assumed as reference.
As regards the check against the topographic survey, model deviations have been measured at 19 Check Points (CPs). Results are summarized in tables 1 and 2.
n. of GCPs Case
n. of CPs
RMSE Y (m)
RMSE X (m)
RMSE Z (m)
RMSE XZ (m)
6 A 19 0.011 0.006 0.008 0.010
12 B 19 0.009 0.005 0.008 0.009 Table 1. RMSE in FreeNet Solution Type
n. of GCPs Case
n. of CPs
RMSE Y (m)
RMSE X (m)
RMSE Z (m)
RMSE XZ (m)
6 A 19 0.005 0.008 0.006 0.010
12 B 19 0.006 0.004 0.006 0.007 Table 2. RMSE in Constrained Solution Type
Analysis of the results show that RMSE values are virtually constant throughout the variation of GCP number, for both Free Net and Constrained processing, ranging from 3 to 5 GSDs and from 2 to 4 GSDs respectively.
It can be assumed that a portion of these errors depends on collimation errors on check points identified without dedicated targets (standard deviation evaluated in 0.5 pixels).
Overall, Constrained processing improves RMSE along the Y-axis, that is, in this case, the depth of the object.
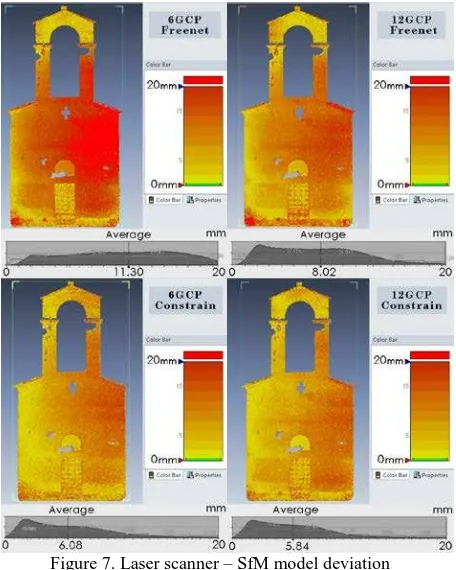
It can be concluded that this particular case of virtually planar surface does not yield deviations of any significance depending on GCP number and processing mode.
surface. The average deviations of the models in the different processing modes range between 6 mm and 11 mm, with higher values restricted to some spots.
Figure 7. Laser scanner – SfM model deviation
This trend is in accordance with the previous deviation analysis on the individual CPs.
4.2 Façade bundle adjustment self- calibration results
For each processing mode, the computed calibration parameters have been compared. In the PhotoScan environment, this kind of analysis meets some difficulties due to the unavailability of statistical parameters of computed values.
Calibration results (Tables 3 and 4) show that sensor format varies depending on the processing mode, also implying variations in pixel size. Sensor format dimensions as computed via calibration, especially referring to Free Net processing, differ from those stated by the manufacturer.
Calibration
parameters Free Net
Constrained 6 GCPs
Constrained 12 GCPs
width 6016 6016 6016
heigh 4016 4016 4016
fx 8131.396 8208.954 8214.459
fy 8125.933 8199.890 8205.916
cx 2894.511 2923.836 2926.630
cy 2043.073 2012.728 2011.585
skew 31.634 23.810 23.065
K1 -9.61E-02 -9.34E-02 -9.29E-02
K2 -8.79E-02 -9.50E-02 -9.52E-02
K3 6.86E-01 7.13E-01 7.12E-01 Table 3. Camera calibration parameters calculated by Photoscan
(pixel unit)
Calibration
parameters Free Net
Constrained 6 GCPs
Constrained 12 GCPs
f 49.986 49.990 49.991
Xp 17.798 17.809 17.814
Yp 12.570 12.272 12.256
Fw 36.992 36.642 36.618
Fh 24.711 24.488 24.470
K1 3.44E-05 3.42E-05 3.41E-05
K2 3.77E-08 3.63E-08 3.57E-08
K3 -7.31E-11 -7.30E-11 -7.22E-11 Table 4. Camera calibration parameters calculated by Photoscan
in Photomodeler format (mm unit)
Focal length is constant and coordinates of the principal point show a variation in the sub-millimetre range for the Y coordinate computed in Free Net, compared to values computed in Constrained mode.
Radial distortion parameters (k1, k2, k3) are in the same range, and of concordant sign for each processing mode.
Tangential distortion parameters are omitted in the tables because their influence is at least a magnitude order smaller than radial distortion (according with Remondino & Fraser, 2006).
4.3 The photogrammetric Roof models accuracy assessment
Accuracy of UAV-borne models of the roof has been checked against the topographic survey.
Figure 8. Roof GCPs and CPs map.
- Case A: 4 GCPs on the ground;
- Case B: 4 GCPs on the ground and 3 GCPs along the eaves; - Case C: 4 GCPs on the ground, 3 GCPs along the eaves and 2 GCPs on top of the belfry.
The remaining 20 points have been used as an independent set against which model deviations have been measured (CPs). Results of this global comparison are summarized as RMSE in tables 5 and 6. Table 5. RMSE in FreeNet Solution Type
n. of Table 6. RMSE in Constrained Solution Type
As regards Free Net processing, higher numbers of evenly distributed GCPs, not only at ground level but also on the roof, lead to an improvement in RMSE values, particularly for the X and Y components. Adding 2 more GCPs on top of the bell tower (Case C) does not entail any difference.
As regards Constrained processing, GCP layout as described in case B significantly cuts down the RMSE of the Z coordinate. In this case, too, case C layout does not change RMSE values compared to case B.
Comparison of Free Net and Constrained processing show that: - For case A, Constrained solution has a higher Z RMSE than Free Net, while it is substantially lower for X and Y. This behaviour may be referred to bad conditioning of bundle adjustment along the Z-axis, while planimetrically the constraints assigned to GCPs have a definite positive action. - For case B, RMSE value for Z is virtually the same in both modes, while it is reduced for X and Y in Constrained processing.
- Case C does not show any difference compared to case B. Addition of the two constraint points on the bell tower does not yield any significant improvement in RMSE, especially for the Z direction, possibly because the tower, due to its small footprint and different morphology compared to the remaining portion of the roof, has a marginal importance in the bundle adjustment global processing.
These data point out that any increase in the number of GCPs positively affect RMSE only if they are evenly distributed on the survey object, otherwise their action seems negligible. Tables 7 and 8 show the local variations of CP accuracy depending on processing mode, number and different level distribution of GCPs.
Ground CPs (level 1) have virtually identical RMSE for X and Y, independently from GCP number and layout, for both Free Net and Constrained processing. As for Z coordinates, case A (only ground-level GCPs) in Constrained processing yields the poorer performance.
As regards roof-level CPs (level 2), elevation accuracy for case A is better with Free Net processing; case B improves CP
RMSE over case A, especially for the Z component, while case C does not yield any improvement over case B.
CPs height Table 7. RMSE in FreeNet Solution Type
CPs height Table 8. RMSE in Constrained Solution Type
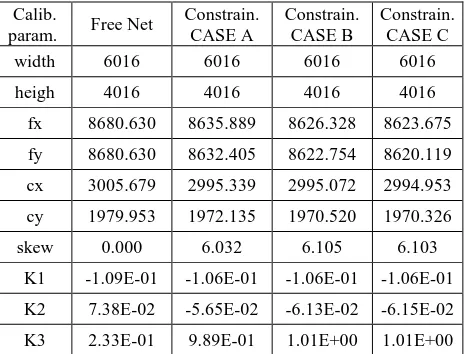
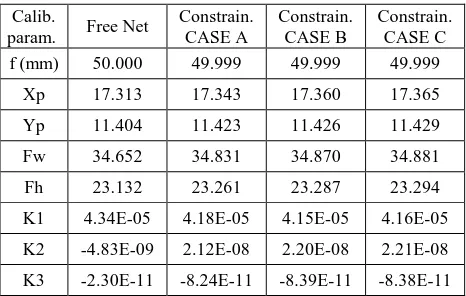
4.4 Roof bundle adjustment self- calibration results
Camera calibration parameters, computed in the different processing modes, have also been analysed for the roof (Tables 9 and 10).
fx 8680.630 8635.889 8626.328 8623.675
fy 8680.630 8632.405 8622.754 8620.119
cx 3005.679 2995.339 2995.072 2994.953
cy 1979.953 1972.135 1970.520 1970.326
skew 0.000 6.032 6.105 6.103
K1 -1.09E-01 -1.06E-01 -1.06E-01 -1.06E-01
K2 7.38E-02 -5.65E-02 -6.13E-02 -6.15E-02
Calib.
param. Free Net
Constrain. CASE A
Constrain. CASE B
Constrain. CASE C f (mm) 50.000 49.999 49.999 49.999
Xp 17.313 17.343 17.360 17.365
Yp 11.404 11.423 11.426 11.429
Fw 34.652 34.831 34.870 34.881
Fh 23.132 23.261 23.287 23.294
K1 4.34E-05 4.18E-05 4.15E-05 4.16E-05
K2 -4.83E-09 2.12E-08 2.20E-08 2.21E-08
K3 -2.30E-11 -8.24E-11 -8.39E-11 -8.38E-11 Table 10. Camera calibration parameters calculated by
Photoscan in Photomodeler format (mm unit)
5. CONCLUSIONS
The accuracy tests were conducted on an object of reduced dimensions with a regular shape and homogeneous in the three dimensions with the exclusion of the bell tower, that is different in size, shape and position.
In order to simulate a hypothetical speed survey, the GCPs were not marked with dedicated targets, and their layout was affected by logistical constraints.
The tests reported corroborate results already available in literature, i.e. that higher numbers of GCPs, evenly distributed both along and orthogonally to the photographic axis, increase model accuracy; besides, this has proven to be true particularly when surveying objects effectively spread in three dimension, while no substantial improvements in accuracy have been detected in planar elements, such as façades.
As for the bell tower, it is apparent that the use of GCPs placed at its top does not entail a significant accuracy improvement of the different models. This could be due to several factors, such as the lower number of GCPs placed at this level and their reduced influence in the calculation algorithm compared to GCPs distributed evenly on the surfaces of greater extension. The identification of GCPs and CPs by means of available details, rather than with ad hoc targets, denotes a speed survey and saves costly operations, but on the other hand is more prone to errors related to a difficult and less accurate collimation on the images.
These tests referred to a rather small object, surveyed at very large scale. Future tests will extend the same considerations to larger survey objects.
ACKNOWLEDGEMENTS
Thanks are due to CAM’s Mr. Luca Mariotti for technical support in UAV management and flight performance.
REFERENCES
Bolognesi, M., Furini, A., Russo, V., Pellegrinelli, A., Russo, P., 2014. “Accuracy of cultural heritage 3D models by RPAS and terrestrial” in The International Archives of the Photogrammetry, Remote Sensing and Spatial Information Sciences, Volume XL-5, ISPRS Technical Commission V Symposium, pp. 113-119, doi:10.5194/isprsarchives-XL-5-113-2014.
Caroti, G. & Piemonte, A., 2013. "Progettazione e primi test su prototipi di velivoli senza pilota per il rilievo metrico del territorio", in Bollettino della Società Italiana di Fotogrammetria e Topografia, n.4/2013, pp. 61-81, ISSN 1721-971X.
Colomina, I. & Molina, P., 2014. “Unmanned aerial systems for photogrammetry and remote sensing: a review”, in ISPRS Journal of Photogrammetry and Remote Sensing, n. 92, pp. 79– 97, doi:10.1016/j.isprsjprs.2014.02.013.
Eisenbeiß, H., 2009. UAV Photogrammetry, DISS. ETH NO. 18515, ISSN 0252-9335, ISBN 978-3-906467-86-3.
Gruen, A., Zhang, Z., Eisenbeiss, H., 2012. “UAV photogrammetry in remote areas – 3D modeling of DraphamDzong Bhutan” in The International Archives of the Photogrammetry, Remote Sensing and Spatial Information Sciences, Volume XXXIX-B1, pp. 375-379, XXII ISPRS Congress, doi:10.5194/isprsarchives-XXXIX-B1-375-2012.
Li, Z. 1988. On the measure of digital terrain model accuracy. The photogrammetric record 12 (72), 873-877.
Nex, F. & Remondino, F., 2014. “UAV for 3D mapping applications: a review”, in Applied Geomatics, n.6, pp.1–15, doi:10.1007/s12518-013-0120-x.
Nocerino, E., Menna, F., Remondino, F., 2014. "Accuracy of typical photogrammetric networks in cultural heritage 3D modeling projects" in ISPRS Archives of the Photogrammetry, Remote Sensing and Spatial Information Sciences, Vol. XL-5, pp. 465-472. ISPRS Commission V Symposium, 23–25 June 2014, Riva del Garda, Italy.
Remondino, F. & Fraser, C., 2006. “Digital camera calibration methods: considerations and comparisons” in The International Archives of the Photogrammetry, Remote Sensing and Spatial Information Sciences, Volume XXXVI, Part 5, pp. 266-272.
Santise, M., Fornari, M., Forlani, G., Roncella, R., 2014. “Evaluation of DEM generation accuracy from UAS imagery” in The International Archives of the Photogrammetry, Remote Sensing and Spatial Information Sciences, Volume XL-5, ISPRS Technical Commission V Symposium, pp. 529-536, doi:10.5194/isprsarchives-XL-5-529-2014.