AUTOMATIC GENERATION OF TRAINING DATA FOR HYPERSPECTRAL IMAGE
CLASSIFICATION USING SUPPORT VECTOR MACHINE
B. Abbasia , H. Arefia, B. Bigdelia, S.Roessnerb
a Department of Geomatics and Surveying Eng., University of Tehran, Tehran, Iran, (abbasi.bahar, hossein.arefi, bigdeli)@ut.ac.ir b GFZ German Research Centre for Geosciences, Section of Remote Sensing, 14473, Potsdam, Germany, (roessner
@gfz-potsdam.de)
Commission VI, WG VI/4
KEY WORDS: High resolution DSM, Hyperspectral, Training, Classification, Support Vector Machine
ABSTRACT:
An image classification method based on Support Vector Machine (SVM) is proposed on hyperspectral and 3K DSM data. To obtain training data we applied an automatic method relating to four classes namely; building, grass, tree, and ground pixels. First, some initial segments regarding to building, tree, grass, and ground pixels are produced using different feature descriptors. The feature descriptors are generated using optical (hyperspectral) as well as range (3K DSM) images. The initial building regions are created using DSM segmentation. Fusion of NDVI and elevation information assist us to provide initial segments regarding to the grass and tree areas. Also, we created initial segment regarding to ground pixel after geodesic based filtering of DSM and elimination of the non-ground pixels. To improve classification accuracy, the hyperspectral image and 3K DSM were utilized simultaneously to perform image classification. For obtaining testing data, labelled pixels was divide into two parts: test and training. Experimental result shows a final classification accuracy of about 90% using Support Vector Machine. In the process of satellite image classification; provided by 3K camera. Both datasets correspond to Munich area in Germany.
1. INTRODUCTION
With development of hyperspectral sensors and remote sensing technology, it becomes possible to provide a large amount of spatial and spectral information for image analysis applications such as classification, unmixing, subpixel mapping, and target detection (Chang, 2003; Landgrebe, 2002).
Classification is one of the main methods of extracting information from satellite images. Classification of hyperspectral data is an important challenging research topic in pattern recognition and remote sensing studies (Bartels, Wei, 2006; Brzank, Heipke, 2007). Classification methods have designed based on the use of multiple band images and sometimes several data sources. Usually there are side-information for a set of pixels for each class that introduced to algorithm. The classification algorithm uses known pixels to identify other pixels of image. So always before undertaking a supervised classification, we need number of pixels for each class.
Several urban classification methods have been proposed for classification of hyperspectral data. Roessner et al., (2001) have combined Maximum Likelihood classification with linear spectral unmixing including a new mathematical model for pixel-oriented endmember selection to accommodate the large number of spectrally similar endmembers occurring in the urban environment. This method was further extended by a shape-based classification using the thermal hyperspectral data to improve the detection of buildings (Segl et al., 2003). Other approaches for classification of hyperspectral data are based on Maximum Likelihood (Jia, 2002), Decision trees (Goel et al. 2003), Neural Networks (Del frate et al. 2007), Genetic Algorithms (Vaiphasa, 2003) and kernel based techniques (Muller et al, 2001; Camps-Valls and Bruzzone, 2005). One of the most popular classification methods is the Support Vector Machine (SVM) defined by Vapnik. This method is a supervised classification method to classify images using small-size training set compared to other methods (Cortes and Vapnik,
1995). Recently, SVMs have been successfully applied in the classification of hyperspectral remote-sensing data. Camps-Valls in 2004 proposed an automatic algorithm based on SVM classifier for classification of hyperspectral data. In this research, they used 6 hyperspectral images with 128 bands, this images were taken by HyMap sensor for agricultural products classification. They compared SVM algorithm with neural network methods and fuzzy systems for evaluation of SVM performance. Sensitivity analysis were considered in two ways: 1) the feature extraction is impossible. 2) several levels of Gaussian noise applied to data. The results showed that SVM algorithm is less sensitive to noisy data (Camps-Valls, 2004). Cromp and Gualtieri in 1998, performed SVM classification on hyperspectral images in agricultural areas. The results of their review showed that high dimensionality of input data does not influence on SVM algorithm unlike traditional classifiers (Gualtieri and Cromp, 1998).
methods does not need preprocessing step for dimension reduction (Shah et. al., 2003).
Karlsson classified high spatial resolution image with SVM method. The results of this study showed that SVM classification algorithm has high performance in multispectral images classification with a limited number of training data (Karlsson, 2003).
Chi et.al. carry out SVM unified forms for hyperspectral data classification with limited training data. In this research, they used Hyperion sensor. The results showed that: 1) In general, unified and dual form of SVM are equivalent. 2) Common methods of optimization such as Newton and Gradient Descent methods can be used for optimization of unified form. 3) Unified form converged faster than dual form (Chi et.al.2008). This paper proposes an automatic method for generating training data of hyperspectral image classification based on SVM classifier. At first, the training data extracted from 3K DSM are used for classification based on SVM. Then, classification based on SVM was applied on hyperspectral image. Finally, by using testing data which are extracted from 3K DSM, we evaluate the output of classifier from hyperspectral data.
2. PROPOSED METHODOLOGY 2.1 Data sets
Two datasets, a hyperspectral image and a 3K DSM are applied in this research. These two data correspond to Munich area in Germany.
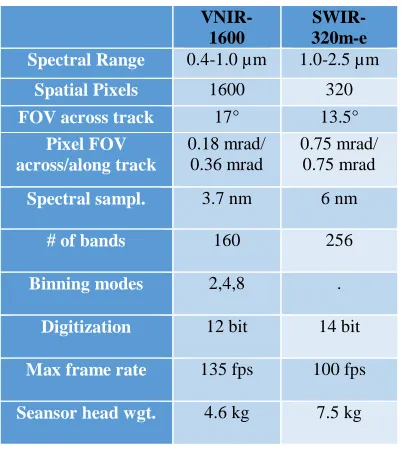
Hyperspectral image is from Hyspex sensor. The HySpex cameras are acquired by NEO since 1995 through several R&D projects (initially defence and space applications) in the field of imaging spectrometry. Today, NEO continues research and product development in close collaboration with companies and research institutes utilizing the HySpex cameras in a wide range of applications. The line of HySpex cameras comprises VNIR camera, operating in the range 400 to 1000 nm, and SWIR camera operating in the range 900 to 2500 nm (http://www.hyspex.no). In this paper we used VNIR models. In Table 1 is shown Hyspex main specification. In this table the field of view (also field of vision, abbreviated FOV or instantaneous field of view, abbreviated IFOV) is the extent of the observable world that is seen at any given moment. In case of optical instruments or sensors it is a solid angle through which a detector is sensitive to electromagnetic radiation. In this paper, we presented a method for providing training data automatically and reducing the cost of gathering training data for classification process. The study area and datasets are shown in figure 1.
The most important problem in processing of hyperspectral images is a low number of training data. In other word, there are limited number of training data to estimate the parameters of each classifier. As a result, estimation of parameters for a classifier with an increase the number of bands and the limits of training data, leads to increasing classification error (Landgrebe, 2002).
Figure 1. Left image: 3K DSM, Right image: Hyperspectral image (HySpex_Ortho_L11vnir1)
In the first part of this section, various classification methods and then SVM classification are described, after that segmentation of 3K DSM are presented. In the next part, steps to get the four classes of Buildings, Grass, Tree and Ground pixels automatically was explained. Finally we discuss about how to use these four classes for training data in hyperspectral image classification.
2.3 Classification Methods
Classification is a process which data are grouped based on
feature extraction in same classes.
Minimum Distance classifier, Maximum Likelihood, Support Vector Machine, K-nearest neighbour and many other classifiers are basic techniques in this field (J.Luis, D.Landgrebe, 1998).
2.4 SVM Classification
Support Vector Machine (SVM) is a popular method in remote sensing data analysis due to its ability to deal with small training data. Supervised classification utilizes training data to allocate unknown objects to known classes. A SVM creates good classification results from noisy and complex data. It is a supervised non-parametric statistical learning technique. Supervised classification is used to classify the pixels of an image forming, in the form of a set of spatial data. This classification is done based on hierarchy of class that is defined by the user. User-defined classes are including a group of pixels (ROIs1) or unique spectrums. Their select are as suitable region representative or are including phenomenon that you are going to display them for output map. In this issue should be careful that selected areas as ROIs have had greater homogeneity.
In General, we use four types of kernel for the SVM classifier: Linear, Polynomial, Radial Basis Function (RBF) and Sigmoid. Here, we consider the RBF kernel because it works well in most cases. This kernel is displayed mathematically as follows:
Where g is the gamma term in the kernel. This parameter is user-controlled parameter, as its correct definition significantly increases the accuracy of the SVM solution. We considered 0.006 for gamma parameter.
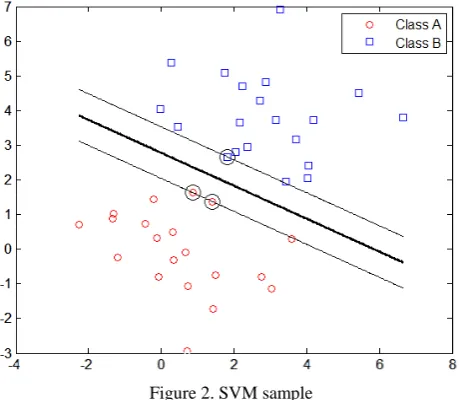
The existing experiences in hyperspectral images classification by SVM algorithm show that this algorithm has higher accuracy than other classic classifications. The simple definition of this method is shown in Figure 2.
Figure 2. SVM sample
2.5 Segmentation of 3K DSM
As is mentioned above, training data is got for classification by using the automatic method that is proposed in this paper. DSM with 30cm resolution is used for training data which corresponds to the same area of Hyperspectral image.
1 Region Of Interests
Classification is done to classify the image according to the urban area, the image is divided to 4 classes as Building, Grass, Tree and Ground pixels.
At first, noise is reduced/removed from DSM. Then segmentation is done on DSM by geodesic dilation method to extract the buildings.
The process of segmentation of 3K DSM with geodesic dilation method is shown in figure 1.
Figure 1. Steps of segmentation (H. Arefi, M. Hahn, 2005).
2.6 Automatic Training data generation
Figure 2 shows the entire process for getting automatic training data.
Hyperspectral image
NDVI image
DSM
DTM Segmentation
Building Extraction
Building class Ground pixels
Extraction Tree
Grass
Refinement Refinement
Refinement
GP Class Tree class
Grass class
Figure 2. Process of getting automatic training data
First, we segment the 3K DSM and extract the buildings, then we do refinement on the buildings and finally we shrink the building and use these buildings for training data in building class. We separated some of the buildings as training data and some of the buildings as testing data.
For other classes, we must use combination of DTM derived DSM and NDVI derived Hyperspectral images. As we know, DTM has natural features like grass and trees. Also NDVI has vegetation such as grass and trees, so we used elevation threshold for dividing vegetation into grass and trees. On the other hand, because of the higher elevation of trees than grasses we can separate trees and grasses.
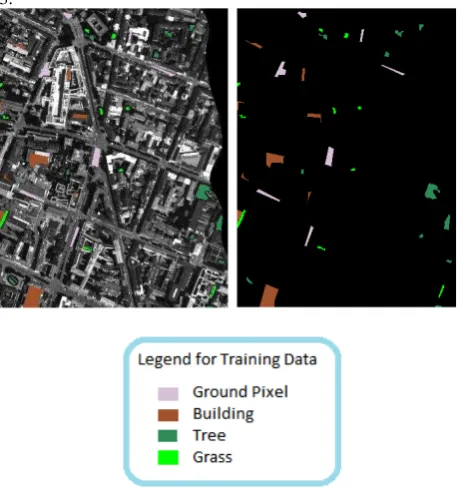
DTM shows ground pixels without vegetation features. So similar features in DTM and NDVI are vegetation and another features are ground pixels. After separating grass, tree and ground pixels, we refined them and extracted training data for these classes. Therefore, training data are obtained for classification based on SVM. These classes are shown in figure 3.
Figure 3. Training Data for SVM Classification
Testing/referencing data for evaluation of classification are shown in figure 4.
Figure 4. Testing Data for evaluation
Finally, training data for four classes are obtained and we used these training data for classification based on SVM for hyperspectral image.
3. RESULTS 3.1 Classification with SVM method
In this paper, we did SVM classification for four classes. These classes are Buildings, Trees, Grasses and Ground pixels. SVM classification is supervised method which need to training data for classification. To create training data we used the DSM and Hyperspectral image from Hyspex sensor automatically. After we have created the training data, we must do SVM classification method on hyperspectral image.
Figure 5 shows the classified image by supervised SVM classifier. This classification achieved the overall accuracy and kappa coefficient of 89.85% and 0.8557 respectively.
Figure 5. SVM classification method on the hyperspectral image
3.2 Evaluation
Standard confusion matrix was used to perform the accuracy assessment of image classifications. Accuracy assessment is based comparing the classification results with true land cover condition or ground truth data (Congalton, 1991).
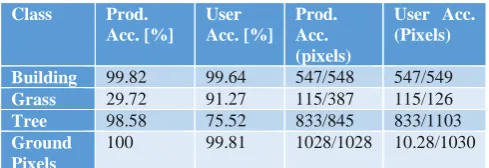
After getting the classified image, post classification has been done and SVM accuracy has been calculated. For evaluating SVM accuracy, testing data have been used. The overall accuracy of the classification method has been 90% which this report brought in Table 2.
the total number of trees are 845 pixels which 833 pixels are known trees and 12 pixels are shown in another classes, the accuracy of this class is 98.58%.
Class Prod.
Table 2. Post classification of SVM classification method on the hyperspectral image
4. CONCLUSION
In this paper, an automatic method for generating training data of hyperspectral image classification based on SVM classifier have been proposed. In first step, the training data extracted from 3K DSM are used for classification based on SVM. Then, classification based on SVM was applied on hyperspectral image. Finally, by using testing data which are extracted from 3K DSM, we evaluate the output of classifier from hyperspectral data and classification accuracy of 89.85% has been achieved.
Generating training data from 3K DSM and hyperspectral image is the important aim of our proposed method. In both data sets, complexities of hyperspectral image and 3K DSM are considered. Because hyperspectral images provide a detailed description of the spectral signatures of objects but no information on the height of ground covers, whereas 3K DSM provide detailed information about the height of objects but no information on the spectral signatures. So the elevation information of 3K DSM is very effective for the separation of objects with similar spectral signatures, for example some buildings. Also the spectral information of hyperspectral data is very effective for discrimination of similar elevation objects but different spectral information for example vegetation. Based on the results of our proposed method the overall accuracy (OA) is 89.85%.
ACKNOWLEDGEMENTS
We would like to thank Deutsches Zentrum fur Luft-und Raumfahr (DLR, German Aerospace Center) for providing us the Hyspex imagery and DSM data.
REFERENCES
Arefi, h., & hahn, m. (2005). A morphological reconstruction algorithm for separating off-terrain points from terrain points in laser scanning data, 120–125.
Bartels, M., Wei, H. (2006), Rule-based Improvement of Maximum Likelihood Classified LIDAR Data fused with coregisterd band, Computational Vision Group, School of Systems Engineering the University of Reading.
Benediktsson, j. A., & kanellopoulos, i. (1999). Classification of multisource and hyperspectral data based on decision fusion, 37(3), 1367–1377.
Brzank, A., Heipke, C. (2007), Classification of LIDAR into Water and Land in Coastal Areas. Institute of Photogrammetry and Geoinformation.
Burges, c. J. C. (1997). A tutorial on support vector machines for pattern recognition, 43, 1–43.
Camps-Valls, G., Gomez-Chova, L., Calpe-Maravilla, J., Martin-Guerrero, J.D., soriaolivas, E., Alonso-Chorda, L., Moreno, J., (2004). Robust support vector method for hyperspectral data classification and knowledge discovery. IEEE Transactions on Geoscience and Remote Sensing 42 (7), 1530–1542.
Camps-Valls, G., & Bruzzone, L. (2005). Kernel-based methods for hyperspectral image classification. IEEE Transaction on
Geoscience and Remote Sensing, 43(6), 1351–1362.
Chang, C.-I., (2003). Hyperspectral Imaging: Techniques for Spectral Detection and Classification. Kluwer Academic/Plenum Publishers, New York.
Chi, M., Feng, R., Bruzzone, L., (2008). Classification of hyperspectral remote-sensing data with primal SVM for small-sized training dataset problem. Advances in Space Research 41 (11), 1793–1799.
Cortes, V., Vapnik, V. (1995), Support vector networks. Machine Learning, 20:273–297.
Congalton, RG, (1991). A review of assessing the accuracy of classifications of remotely sensed data. Remote Sensing of Environment. 37, pp. 35–46.
Del Frate, F., Pacifici, F., Schiavon, G., & Solimini, C. (2007). Use of neural networks for automatic classification from high-resolution images. IEEE Transactions on Geoscience
and Remote Sensing, 45(4), 800–809.
Dibike, y. B., velickov, s., & solomatine, d. (2000). Support vector machines : review and applications in civil engineering 2 statistical learning theory.
Goel, P. K., Prasher, S. O., Patel, R. M., Landry, J. A., Bonnel, R.B., & Viau, A. A. (2003). Classification of hyperspectral data by decision trees and artificial neural networks to identify weed stress and nitrogen status of corn. Computers and
Electronics in Agriculture, 39(2), 67–93.
Gualtieri, J. A. And Cromp, R. F., (1998), Support vector machines for hyperspectral remote sensing classification. Proceedings of the 27th AIPR Workshop: Advances in Computer Assisted Recognition, Washington, DC, October 27, 221-232.
Harsanyi, j. C., & chang, c.-i. (1994). Hyperspectral image classification and dimensionality reduction: an orthogonal subspace projection approach. IEEE Transactions on geoscience and remote sensing, 32(4).
Jia, X. (2002). Simplified maximum likelihood classification for hyperspectral data in cluster space. IEEE International Geoscience and Remote Sensing Symposium, 2002 (IGARSS
’02), 5, 2578–2580
Karlsson. A., (2003), Classification of high resolution satellite images, Thesis for the degree of Master of Science in Engineering Physics.
Keshavarz. A., ghasemian yazdi. H. (2007), a fast algorithm based on support vector machine for hyperspectral image classification by using spatial correlation, journal of electrical engineering and computer engineering ,third year, no. 1 (in persian).
Landgrebe, D., (2002). Hyperspectral image data analysis. IEEE Signal Process. Mag. 19 (1), 17–28.
Luis, J., Landgrebe, D., (1998). Supervised Classification in High Dimensional Space: Geometrical, Statistical, and Asymptotical Properties of Multivariate Data IEEE Transactions on System, Man, and Cybernetics, Volume 28, Part C, No.1, pp.39-54.
Mather, P. M. (2003). Support Vector classifiers for Land Cover Classification, Map India 2003 Image Processing & Interpretation.
Melgani, f., & bruzzone, l. (2004). Classification of hyperspectral remote sensing, 42(8), 1778–1790.
Müller, K. L., Mika, S., Rätsch, G., Tsuda, K., & Schölkopf, B. (2001). An introduction to kernel-based learning algorithms.
IEEE Transaction on Neural Network, 12(2), 181–202.
Roessner, S., Segl, K, Heiden, U., Kaufmann, H. (2001): Automated differentiation of urban surfaces based on airborne hyperspectral imagery. IEEE Transactions on Geosciences and Remote Sensing, Vol. 39, No. 7, 1525-1532.
Segl, K., Roessner, S., Heiden, U., Kaufmann, H. (2003): Fusion of spectral and shape features for identification of urban surface cover types using reflective and thermal hyperspectral data. ISPRS Journal of Photogrammetry and Remote Sensing, Vol. 58, No. 1-2, 99-112.
Shah Hosseini.R. (2011), Classification of hyperspectral images by using SVM method, Thesis.
Shaha, A., Manoj, K., (2003), Unsupervised classification of hyperspectral data: an ICA mixture model based approach, Aroraa & Pramod K. Varshney.
Vaiphasa, C. (2003). Innovative genetic algorithm for
hyperspectral image classification, In Proceeding of
International Conference of Map Asia, pp. 20.