OBJECT-ORIENTED CHANGE DETECTION BASED ON SPATIOTEMPORAL
RELATIONSHIP IN MULTITEMPORAL REMOTE-SENSING IMAGES
Liang Li a,b,*, Guowei Ying b, Xuehu Wen b, Yun Zhang b
a The Third Academy of Engineering of Surveying and Mapping, 2 Xinjun Road, 610500 Chengdu, China b Geographic National Condition Monitoring Engineering Research Center of Sichuan Province, 2 Xinjun
Road,610500 Chengdu, China –[email protected],[email protected], [email protected], [email protected]
Commission
××
, WG
××
KEY WORDS: object-oriented, change detection, post classification comparison (PCC), spatiotemporal relationship, Markov Random Field (MRF), remote-sensing images
ABSTRACT:
In this paper a novel object-oriented change detection approach in multitemporal remote-sensing images is proposed. In order to improve post classification comparison (PCC) performance, we propose to exploit spatiotemporal relationship between two images acquired at two different times. The probabilities of class transitions are used to describe the temporal dependence information, while the Markov Random Field (MRF) model is utilized to represent the spatial-contextual information. Training sets are required to get initial classification results by maximum likelihood method (ML).Then an estimation procedure: iterated conditional mode (ICM) is present to revise the classification results. Change detection (change/no change) and change type recognitions (from-to types of change) are achieved by compare classification maps acquired at two different times. Experimental results on two QuickBird images confirm that the proposed method can provide higher accuracy than the PCC method, which ignores spatiotemporal relationship between two images.
1. INTRODUCTION
Remote-Sensing images with large cover area and short revisit time are widely used in land use/land cover change detection since its birth. Land use/land cover change detection using remote sensing technology has always been an important research topic in remote sensing applications [1]. According to the basic unit of the land use/land cover changes, change detection methods can be cataloged into two types: pixel-based method and object-oriented method.
Many change detection algorithms belong to the former approach [2]-[10]. The most popular methods of them are the image differencing algorithm [3] - [5],change vector analysis [6]-[10] and post- classification comparison[11].The image differencing algorithm is an unsupervised technique as well as change vector analysis, while PCC is a supervised technique for change detection. The image differencing algorithm is usually divided into three steps:1) pre-processing. The two images should be coregistered so that pixels with the same coordinates are corresponding to the same area on the ground.2) Difference image generation. The two images are subtracted, pixel by pixel, to generate a further image difference image. 3) Threshold decision. Under the assumption of few changes between two different images, changes are located in the tails of probability density function of the difference image. They can be detected through a certain threshold gained by ostu algorithm or bayesian theory. Change vector analysis can not only detect changes but also provide
“from-to” types of change information using the gray
* Corresponding author: Liang Li (1987 ), male, PhD
candidate, majors in intelligent interpretation of remote sensing imagery.E-mail: [email protected]
value of all bands. The gray values corresponding with different bands of a pixel at each time compose a vector. Then for each couple of pixels, change vector is computed by subtracting vectors acquired at the two times. The changes in land-cover classes are determined based on both the magnitude and the direction of the change vector [6]. The limitation of image differencing algorithm and change vector analysis is the false alarm caused by difference in light conditions, atmospheric conditions, and sensor calibration at the two acquisition images concerned. In addition, the acquisition of the optimal threshold value is also a bottleneck. However, PCC approach can overcome these problems. Two images are classified separately according to the training sets. It performs change detection and change type recognitions by comparing the classification maps between two images. The accuracy of this method depends on the performances of the classification maps. Therefore, training sets play an important part in this technique. Typical training sets are required.
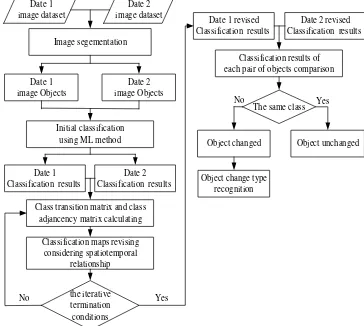
effectively in high-resolution imagery. Some object- oriented methods have been developed for change detection, such as the multilevel model [12], Kolmogorov-Simirnov test technique [13], OCI method [14], post-classification comparison [15]. Although the use of object-oriented postclassification comparison is widespread because it can detect changes and provide from-to types of change,it exhibits two major drawbacks: lack of temporal dependence information between the two images of the same area acquired at the two times and lack of spatial-contextual information in single image. In order to overcome these problems, object- oriented PCC technique considering spatiotemporal relation- ship is proposed in this paper. First, image segmentati- on with two images using marker-based watershed algorithm is applied to obtain image objects. According to acquired training sets, object-oriented classification using ML method for each image are performed to get initial classification maps. Next, spatiotemporal relationship which involves both temporal dependence information and spatial- contextual information, is presented to revise compound classification maps. Finally, change detection and change type recognitions are achieved by comparing the revised two classification maps. The processing flow of the proposed method is shown in Figure 1.
This paper is organized into five sections.In Section 1, Marker-based watershed image segmentation is described. Object-oriented PCC technique considering spatiotemporal relationship is proposed in Section 2. Experimental results and discussions are reported in Section 3. The conclusion is drawn in Section 4. Class transition matrix and class
adjancency matrix calculating Figure 1. Schematic representation of the proposed
technique
2. MARKER-BASED WATERSHED IMAGE SEGMENTATION
In the proposed method, image segmentation is employed to gain image objects. The definition of image segmentation is detailed in the following. Let R
be the image for segmentation, and let H be a The regions should satisfy the following conditions:
(1) Conditions (1) and (5) ensure that the image is divided into
N
connected regions. Condition (2) guarantees thatN
connected regions are non-overlapping regions. Condition (3) determines the homogeneity of the region, and condition (4) assures the heterogeneity between the region and its adjacent region.Many segmentation strategies have been proposed in recent years (e.g., region growing method, edge-based technique, etc.) [17]-[21].In this paper, we adopt a marker-based watershed algorithm to segment the image which can reduce over-segmentation in traditional watershed algorithm. Marks are flat regions composed of a set of pixels with low gradient values. Each mark indicates the presence of an object. There are three main steps in the marker-based watershed approach. These steps are detailed in the following. 1) Extraction of marker image. Each pixel segmentation. False marks can be discarded adopting minimum size constraint.
3) Segmentation by marker-based watershed algorithm.Meyer proposed a direct marker-based watershed algorithm by immersion, depending on the priority queues [22],[23].The higher priority of a pixel is, the lower is the gradient value. This algorithm can be summarized as follows: (a) labeling the markers and initialization of the priority queues, (b) region growing. A pixel p is extracted from the end of the highest priority queue. The neighbor pixels of p which are still outside the queue are put into the queue according to the gradient value, however, when the gradient value is lower than the priority of p, this neighbor is put into the queue with the same priority of pixel p. If pixel p has in its neighborhood one and only one labeled region, it is aggregated to this region and if pixel p is a neighbor of two regions with different labels, p is a boundary pixel and gets a special label.
For a more detailed description of the marker-based watershed approach we refer the readers to [22]. In order to get a segmentation map shared by two considered images, we generate a new image by combining two multispectral images. The bands of new image are composed of bands from two images. Marker-based watershed image segmentation technique for the new image is adopted.
3. OBJECT-ORIENTED CHANGE DETE- CTION TECHNIQUE BY COMPOUND CLASSIFICATION CONSIDERING SPAT- IOTEMPORAL RELATIONSHIP
same area on the ground. Two images are divided into
N
disjoint objects after image segmentation. Let1 the possible sets of classification results in the image att2 ,whereTq { ( ),T k kq 1, 2, ...,N},withT kq( ) .
According to the Bayesian formulation, the optimal sets of classification results
C
t andT
h that minimize the classification error can be derived by using the following decision rule:1 2
Formula (2) is equivalent to the formula (3).
1 2
to simplify the problem, we make two assumptions. 1)The feature vectors
X
1 only depends on theclassification results
C
p,and the feature vectorsX
2only depends on the classification results
T
q.Thus feature vectorsX
1,given the classification resultsp
C
andp X
(
2/
T
q)
is the conditional probabilityof feature vectors
X
2,given the classification resultsq
T
.where
U
(.)
is the Gibbs energy function and Z is a of spatial-contextual information in the process. The higher is the adjacent probability of the two objects, constant, the following formula can obtain:1
We can transform (12) into (13) using log function.
1 2
represents the temporal dependence information between the time
t
1 andt
2,and the probability ofland-cover adjacency probability P C k( p( ) /Cp( ))j
which describes the spatial-contextual information at time
t
1.training sets of two images. In the Gaussian case, the mean vector
and the covariance matrix
are used to estimate the conditional probabilities. The parameters
and
of each land-cover class can abstract from corresponding training sets.3.3 Land-cover class transition and adjacency matrixes
The probabilities of land-cover class transitions which represent the temporal dependence information between two times establish the following
m n
column
j
in the matrix denotes the probability of anobject belongs to land-cover class
j at timet
2,onthe condition that it belongs to land-cover class
iat time
t
1.The conditional probabilities of the land-cover class adjacency which represent the spatial-contextual information at the time
t
1 compose the followingcolumn
j
in the matrix represents the probability ofan object belongs to land-cover class
j at time1
t
,on the condition that it is adjacent to the land-cover class
i at the same time.In order to estimate all the probabilities in matrix T
and A, training sets are required. The training sets should satisfy the following conditions:1)training sets should correspond to the same area on the ground at the two times;2)training sets should contain all the probabilities of the land-cover class transitions and adjacencies [11]. In practical terms, it’s impossible to select the training sets to satisfy above mentioned conditions.
Different places at different times with different land policies formulated by local government leads to different matrix T and A, for example, in the period of the urbanization and city constructions, the probability of farmland transferred to the building is higher than it transferred to the lake. As a result, historical dataset
can’t be used to get current land-cover class transition and adjacency matrixes accurately.
Consequently, we estimate the probabilities in matrix
T and A from the whole image. 3.4 Iterated conditional mode for compound classification
The number of all possible classification results at the two times is
(
)
Nmn
. It’s impossible to find optimal(ICM) technique [25]. According to ICM, the land-cover classes of the current couple of objects at the two times is determined by the land-cover classes of the other couples of objects and the feature vectors of all couples of objects. ICM technique is realized according to the following steps.
1) Initial classifications of the two images using ML approach independently.
2) Compute the land-cover class transitions and adjacencies matrixes depend on the initial classifications.
3) Update the classification results of the two images which verify (13), for all couples of objects at two times.
4) Repeat 2)-3) until the convergence.
3.5 Change detection and change type recognition
The optimal compound classification results
C
t andh
T
at the two times can be obtained usingaforementioned technique.
C k
t( )
andT k
h( )
arethe classification results of k-th object at the two times. Change detection and change type recognition are implemented by comparing
C k
t( )
withT k
h( )
.If( )
t
C k
is not the same land-cover class asT k
h( )
,the object has been changed from
C k
t( )
toT k
h( )
,otherwise it has no change.
4. EXPERIMENTAL RESULTS AND DISCUSSIONS
4.1 Data set description
The study area is located in the Wuhan city in the center of China. Two images with the same area of 758×623 pixels are acquired by QuickBird satellite in 2002(time t1) and 2005(time t2). The QuickBird imagery is made of four multispectral bands with a spatial resolution of 2.44m: the red band, the green band, the blue band, and the near infrared band and one panchromatic band with a spatial resolution of 0.61m.The bands selected for change detection are four multispectral bands with a spatial resolution of 2m after resampling. The dataset used in the experiments is shown in Figure 2 .
(a) (b )
Figure 2. Change detection imagery acquired in (a) 2002 and (b) 2005(758×623 pixels, with the spatial resolution of 2m).
The number of objects extracted from image segmentation by marker-based watershed method is 625. Figure 3 shows the image segmentation results. 4.2 Classification results
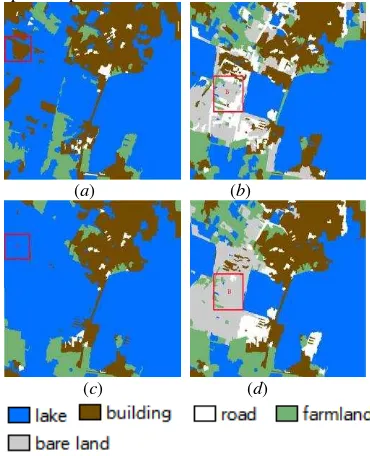
There are four classes in the image acquired in 2002 and five classes in the image acquired in 2005. Therefore we selected four classes: lake, building,
Figure 3. Image segmentation results(black lines denotes the boundary of the objects). road, farmland at time t1 and five classes: lake, building, road, farmland, bare land at time t2. Because of the complexity of the remote sensing imagery, subclasses with different spectral information exist in one land-cover class, i.e., the lake contains many subclasses with different sediment concentration and chlorophyll content. This problem will reduce the accuracy of the image classification. In order to solve this problem, training sets containing all subclasses should be selected.
Figure 4 shows the classification results at the two times. The object belongs to the lake on the ground truth involved in red rectangle A is classified to the building in Figure 4(a) using ML method, while it is classified to the lake in Figure 4(c) using the proposed approach. The reason is that this object has similar spectral features as the building, but it’s more likely to belong to the lake, considering the spatial-contextual information that the object adjacent to it belongs to the lake.
Many objects belong to bare-land on the ground truth involved in red rectangle B of Figure 4(b) are mistakenly classified as the road since the road and bare-land both have strong reflectivity. However, these objects are classified correctly in Figure 4(d) because the objects belong to the lake at time t1are more likely to the lake at time t1 are more likely to transform into buildings than the road considering temporal dependence.
(a) (b)
(c) (d)
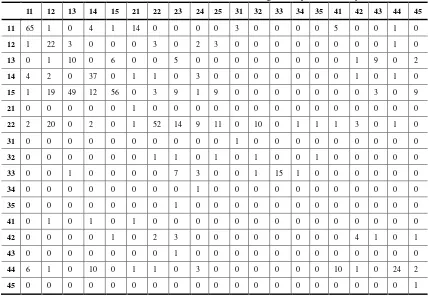
using ML method;(c) classification maps in the imagery acquired in 2002 using the proposed approach.(d) classification maps in the imagery acquired in 2005 using the proposed approach. The land-cover class transition and adjacency matrixes after four iterations are shown in Table 1 and 2. The land cover at time t1 and t2are given by the columns and rows in Table 1. The land cover class and the adjacent class at time t1 are given by the columns and rows in Table 2.It is easy to observe in Table 1 that the lake tends to transform to other class while the building seldom converts to other class between two different times. Table 2 shows that objects have aggregation effect in space which indicates that objects are more likely adjacent to objects with the same land-cover class, for example, the probability that an object belonging to lake under the condition that the adjacent object belongs to the lake is as high as 0.72. However the probability that an object belonging to building under the condition that the adjacent object belongs to the road is 0.68 which is very high. The reason is that the buildings usually lie on both sides of the road in China. The error matrixes of land-cover transitions for PCC method and the proposed method were computed in Table 3 and Table 4. Land-cover transitions from the ground truth area are given in the rows in two tables, while the land-cover transitions detected by pcc method are given in the columns in Table 3 and the land-cover transitions detected by the proposed method are given in the columns in Table 4
(
ij
denotes the object transform from
iat
t
1to
j
at
t
2,i
1, 2,3, 4
,j
1, 2,3, 4,5
).Compared the two tables, we can see that the proposed approach can provide better accuracy than PCC method. In particular, the accuracy of 15(lake-bare land) and 22(building-building) was significantly improved. The reason for that can be described as follows: the building class, the road class,
Table 1.Land-cover class transition matrix adjacent class
class lake building road farm land
lake 0.72 0.18 0.02 0.08
building 0.33 0.52 0.09 0.06
road 0.17 0.68 0.13 0.02
farmland 0.37 0.15 0.01 0.47
Table 2.Land-cover class adjacency matrix and the bare land class all have strong reflectivity with high gray value, thus, a classifier only considering spectral information can’t distinguish them. Nonetheless, the probability of the lake at t1
converting to bare land at t2is high and the building is more likely adjacent to the building than the road in space.The proposed approach considering the temporal dependence information and the spatial contextual information can distinguish the above three classes and get an improved accuracy.
11 12 13 14 15 21 22 23 24 25 31 32 33 34 35 41 42 43 44 45
11 65 1 0 4 1 14 0 0 0 0 3 0 0 0 0 5 0 0 1 0
12 1 22 3 0 0 0 3 0 2 3 0 0 0 0 0 0 0 0 1 0
13 0 1 10 0 6 0 0 5 0 0 0 0 0 0 0 0 1 9 0 2
14 4 2 0 37 0 1 1 0 3 0 0 0 0 0 0 0 1 0 1 0
15 1 19 49 12 56 0 3 9 1 9 0 0 0 0 0 0 0 3 0 9
21 0 0 0 0 0 1 0 0 0 0 0 0 0 0 0 0 0 0 0 0
22 2 20 0 2 0 1 52 14 9 11 0 10 0 1 1 1 3 0 1 0
31 0 0 0 0 0 0 0 0 0 0 1 0 0 0 0 0 0 0 0 0
32 0 0 0 0 0 0 1 1 0 1 0 1 0 0 1 0 0 0 0 0
33 0 0 1 0 0 0 0 7 3 0 0 1 15 1 0 0 0 0 0 0
34 0 0 0 0 0 0 0 0 1 0 0 0 0 0 0 0 0 0 0 0
35 0 0 0 0 0 0 0 1 0 0 0 0 0 0 0 0 0 0 0 0
41 0 1 0 1 0 1 0 0 0 0 0 0 0 0 0 0 0 0 0 0
42 0 0 0 0 1 0 2 3 0 0 0 0 0 0 0 0 4 1 0 1
43 0 0 0 0 0 0 0 1 0 0 0 0 0 0 0 0 0 0 0 0
44 6 1 0 10 0 1 1 0 3 0 0 0 0 0 0 10 1 0 24 2
45 0 0 0 0 0 0 0 0 0 0 0 0 0 0 0 0 0 0 0 1
Table 3.Error matrix of the land-cover transitions of the objects by pcc algorithm 1
t
t
2 lake building road farm landbare land
lake 0.25 0.12 0.22 0.16 0.25
building 0.00 0.91 0.07 0.02 0.00
road 0.03 0.09 0.83 0.06 0.00
11 12 13 14 15 21 22 23 24 25 31 32 33 34 35 41 42 43 44 45
11 89 0 0 2 0 0 0 0 0 0 0 0 0 0 0 0 0 0 3 0
12 0 20 2 0 5 0 7 0 0 0 0 0 0 0 0 0 0 0 1 0
13 0 0 33 0 1 0 0 0 0 0 0 0 0 0 0 0 0 0 0 0
14 2 0 0 47 1 0 0 0 0 0 0 0 0 0 0 0 0 0 0 0
15 0 0 5 0 166 0 0 0 0 0 0 0 0 0 0 0 0 0 0 0
21 0 0 0 0 0 1 0 0 0 0 0 0 0 0 0 0 0 0 0 0
22 0 1 1 2 0 0 120 0 0 0 0 0 1 0 0 0 0 0 3 0
31 0 0 0 0 0 0 0 0 0 0 1 0 0 0 0 0 0 0 0 0
32 0 0 0 0 0 0 4 0 0 0 0 1 0 0 0 0 0 0 0 0
33 0 0 3 0 0 0 4 0 0 0 0 0 20 0 0 0 0 0 1 0
34 0 0 0 0 0 0 0 0 0 0 0 0 0 0 0 0 0 0 1 0
35 0 0 0 0 1 0 0 0 0 0 0 0 0 0 0 0 0 0 0 0
41 0 0 0 0 0 0 1 0 0 0 0 0 0 0 0 0 0 0 2 0
42 0 0 2 0 1 0 5 0 0 0 0 0 0 0 0 0 0 0 4 0
43 0 0 1 0 0 0 0 0 0 0 0 0 0 0 0 0 0 0 0 0
44 0 0 0 4 0 0 0 0 0 0 0 0 0 0 0 0 0 0 55 0
45 0 0 0 0 0 0 0 0 0 0 0 0 0 0 0 0 0 0 1 0
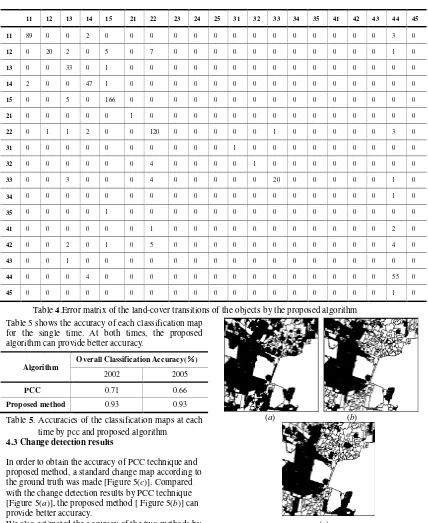
Table 4.Error matrix of the land-cover transitions of the objects by the proposed algorithm Table 5 shows the accuracy of each classification map
for the single time. At both times, the proposed algorithm can provide better accuracy.
Table 5. Accuracies of the classification maps at each time by pcc and proposed algorithm
4.3 Change detection results
In order to obtain the accuracy of PCC technique and proposed method, a standard change map according to the ground truth was made [Figure 5(c)]. Compared with the change detection results by PCC technique [Figure 5(a)], the proposed method [ Figure 5(b)] can provide better accuracy.
We also estimated the accuracy of the two methods by false alarms and missed alarms in Table 6. Compared with the PCC technique, the proposed method can reduce the false alarms dramatically. But the proposed method increased the missed alarms to 28. However,
it can provide better overall accuracies which was
reduced from 160 to 41 respectively.
(a) (b)
(c)
Figure 5. Change detection results(black areas denote the changed areas): (a) PCC technique with 440 changed objects and 185 unchanged objects;(b) proposed method with 301 changed objects and 324 unchanged objects; and (c) ground truth with 316 changed objects and 309 unchanged objects.
Table 6. Change detection results by the two methods
5. CONCLUSIONS
An object-oriented change detection approach consid- ering spatiotemporal relationship in multi-temporal remote-sensing images has been proposed in this
paper. The approach adopts the marker-based watershed algorithm to obtain objects. Change detection technique based on object can effectively suppress the salt and pepper noise in remote sensing imagery. The object-oriented compound classification which takes into account the spatiotemporal relationship between the two times is presented. The probabilities of land-cover class transitions are employed to describe the temporal dependence information and the Markov Random Field (MRF) model is utilized to represent the spatial-contextual Algorithm Overall Classification Accuracy(
%)
2002 2005
PCC 0.71 0.66
Proposed method 0.93 0.93
Algorithm alarms False Missed alarms Overall Error
PCC 142 18 160
information. Land-cover class transition matrix and adjacency matrix are computed through the compound classification results at the two times. ICM technique is adopted to get the optimal compound classification results. Change detection is achieved by comparing classification results between the two times.
The method proposed in this paper is a supervised technique. A training set is acquired by each of the multitemporal images. Thus, this method is not sensitive to atmospheric conditions and sensor calibration.
Experimental results on the QuickBird imagery show the effectiveness of the proposed method. The accuracies of the classification maps are increased. Thus the overall error of change detection is reduced. Compared with the PCC method, the proposed method can provide better accuracy for change detection.
As future developments of this paper, we plan to do as follows: 1) further analysis of the two assumptions and 2) introduce the texture information and shape information of objects into the proposed method.
ACKNOWLEDGMENT Supported by the Geographic National Condition Monitoring Engineering Research Center of Sichuan Province (GC201506) and the science and technology plan of sichuan bureau of surveying, mapping and geo information(J2014ZC12, J2014ZC16)
REFERENCE
[1] Singh A,1989.Digital change detection techniques using remotely sensed data. Int.J.Remote Sensing,10(6),pp.989 -1003.
[2] Teng S P, Chen Y K ,and Cheng K S,2008.Hypothesis- test-based land cover change detection using multi- temporal satellite images-A comparative study. Advances in Space Research,41,pp.1744-1754.
[3] Bruzzone L, Fernàndez P D, 2000.Automatic analysis of the difference image for unsupervised change detection. IEEE Trans.Geosci.Remote Sensing, 38, pp.1171–1182. [4] Bruzzone L, Fernàndez P D, 2002. An adaptive semipara
metric and context-Based approach to unsupervised change detection in multitemporal remote-sensing images.IEEE Transaction on image processing,11(4), pp. 452-466.
[5] Fung T, 1990.An assessment of TM imagery for land -cover change detection. IEEE Trans. Geosci. Remote Sensing, 28(12), pp. 681-684.
[6] Malila,William A,1980.Change vector analysis:an approach for detecting forest changes with landsat. Machine Processing of Remotely Sensed Data Symposium,pp.326-335.
[7] Chen J, Chen X H, Cui X H,and Chen J,2011.Change vector analysis in posterior probability space: a new method for land cover change detection. IEEE Geo- science and Remote Sensing Letters, 8(2), pp. 317- 321. [8] He C Y, Wei A N,and Shi P J,et al,2011.Detecting land-use/ land-cover change in rural-urban fringe areas using extended change-vector analysis.International Journal of Applied Earth Observation and Geo-
information, 13,pp.572–585.
[9] Bovolo F, Bruzzone L, 2007. A Theoretical Framework for Unsupervised Change Detection Based on Change Vector Analysis in the Polar Domain. IEEE Trans.Geosci. Remote Sensing, 5(1),pp.218-236,
[10]Varshney A, Arora M K and Ghosh J K,2012.Median change vector analysis algorithm for land-use land-cover change detection from remote-sensing data,Remote Sensing Letters, 3(7),pp.605-614.
[11] Bruzzone L, Serpico S B, 1997. An iterative technique for the detection of landcover transitionsin multi temporal remote-sensing images. IEEE Trans. Geosci. Remote Sensing, 35(4),pp.858-867.
[12] Bovolo F, Bruzzone L, 2009. A multilevel parcel-based approach to change detection in very high resolution multite-mporal images. IEEE Geoscience and Remote Sensing Letters,6,pp.33–37.
[13] L.Bruzzone and D.F.Prieto, “An adaptive parcel-based technique for unsupervised change detection,” Int.J. Remote Sensing,vol.21, no.4,pp.817–822,Mar 2000. [14] Tang Y Q, Zhang L P, Huang X, 2011. Object-oritented
change detection based on the Kolmogorov-Simirnov test using high-resolution multispectral imagery .Int.J. Remote Sensing, 32(20),pp.5719-5740.
[15] Im J, Jensen J R,and Tullis J A,2008.Object-based change detection using correlation image analysis and image segmentation. Int.J.Remote Sensing,29(2), pp. 399-423.
[16] Walter V, 2004. Object-based classification of remote sensing data for change detection.ISPRS Journal of Photogrammetry and Remote Sensing,58,pp.225-238, [17] Gao H, Siu W C, Hou C H, 2001. Improved techniques
for automatic image segmentation.IEEE Transactions on Circuits and Systems for Video Technology, 11(12), pp. 1273-1280,
[18] Salembier P, Pardas M,1994. Hierarchica morphological segmentation for image sequence coding. IEEE Transa- actions on Image Processing,3(5),pp.639-651. [19] Li D R, Zhang G F, Wu Z C, and et al, 2010. An edge
embedded marker-based watershed algorithm for high spatial resolution remote sensing image segmentation. IEEE Transactions on Image Processing,19(10), pp.50 -57.
[20] Paul R H, Canagarajah C N, David R B, 2003. Image segmentation using a texture gradient based watershed transform.IEEE Transactions on Image Processing 12
(12),pp.1618-1633.
[21] Haris K, Fstratiadis S N E, Maglaveras N, and et al, 19- 98. Hybrid image segmentation using watersheds and fast region merging.IEEE Trans on image processing,7 (12), pp.1684-1699.
[22] Meyer F, 1992. Color Image Segmentation. IEEE Inter- national Conference on Image Processing and Its Appl- ications, Maastricht, Netherlands.
[23] Gao H, .Lin W S, Xue P.and Siu W C, 2006. Marker- based image segmentation relying on disjoint set union. Signal Processing: Image Communication, 21,pp.100 - 112.
[24] Dubes R C,Jain A K,1989.Random field models in image analysis. Journal of applied statistics,16, pp.131 -163.