Inefficiency of insulin therapy to correct apolipoprotein A-I
metabolic abnormalities in non-insulin-dependent diabetes mellitus
Laurence Duvillard *, Fre´de´ric Pont, Emmanuel Florentin, Philippe Gambert,
Bruno Verge`s
INSERM U498-Me´tabolisme des lipoprote´ines humaines et interactions 6asculaires,Faculte´ de Me´decine,21033 Dijon, France
Received 21 May 1999; received in revised form 25 October 1999; accepted 5 November 1999
Abstract
Non-insulin-dependent diabetes mellitus (NIDDM) is associated with low high density lipoprotein (HDL) cholesterol and apoA-I, related to an increased apoA-I fractional catabolic rate. This stable isotope kinetic experiment, usingL-[1-13C] leucine,
was designed to study the effect of insulin therapy on HDL apoA-I and A-II metabolism in poorly controlled NIDDM patients. A kinetic study was performed in five control subjects and in six NIDDM patients before and two months after the introduction of insulin therapy. ApoA-I and A-II were modelled using a monoexponential function. Insulin treatment was able to correct neither the low HDL apoA-I concentration observed in NIDDM patients (1.1490.19 vs. 1.1690.12 g l−1 (controls:
1.3390.14)), nor the HDL apoA-I hypercatabolism (0.3990.11 vs. 0.3490.05 pool d−1, (controls: 0.2390.01, PB 0.01)).
HDL apoA-I production rate was increased in NIDDM patients compared to control subjects and was not modified by insulin (0.4590.12 vs. 0.3990.08 g d−1 l−1, (controls: 0.3190.04, PB 0.05)). HDL apoA-II kinetic parameters were initially not
significantly different between NIDDM patients and control subjects, and were not modified by insulin. The decreased insulin sensitivity, assessed by the insulin suppressive test, was not modified by insulin therapy in NIDDM patients. HDL apoA-I fractional catabolic rate was significantly correlated to HDL triglyceride/cholesteryl ester and triglyceride/protein ratios, which were significantly higher in NIDDM patients than in controls and were not modified by insulin therapy. The persistence of insulin resistance and of high neutral lipid exchanges between triglyceride rich lipoproteins and HDL in insulin-treated NIDDM patients probably explain the inefficiency of insulin therapy to correct HDL apoA-I metabolic abnormalities. © 2000 Elsevier Science Ireland Ltd. All rights reserved.
Keywords:Non-insulin-dependent diabetes mellitus; Insulin; Apolipoprotein A-I; Apolipoprotein A-II; Stable isotope; Kinetic study
www.elsevier.com/locate/atherosclerosis
1. Introduction
Atherosclerosis is the first cause of morbidity and mortality among non insulin dependent diabetes melli-tus (NIDDM) patients. These patients generally exhibit high triglyceride level and low high-density lipoprotein (HDL) cholesterol concentration, especially HDL2 cholesterol [1]. Apolipoprotein A-I, the main apolipo-protein of HDL particles, tends also to be decreased in NIDDM patients, and the diminution of plasma HDL
cholesterol and/or apoA-I in these patients has been associated with an increased risk of macrovascular dis-ease [2 – 4]. The decrdis-ease of apoA-I plasma pool size observed in NIDDM subjects has been related to a major increase of its fractional catabolic rate (FCR), whereas the moderate rise of its production rate (PR) is not sufficient to compensate the hypercatabolism [5,6]. The same apoA-I metabolism abnormalities have been described in subjects with impaired glucose tolerance [7]. In these studies, apoA-I FCR was strongly corre-lated with plasma triglycerides, plasma insulin concen-tration and fasting plasma glucose, indicating that hypertriglyceridaemia, insulin resistance and hypergly-caemia are likely to be responsible for apoA-I hyper-catabolism in NIDDM or glucose intolerance.
* Corresponding author. Present address: Laboratoire de Biochimie des Lipoprote´ines, Hoˆpital du Bocage, BP 1542, 21034 Dijon, France. Tel.: +33-3-80293825; fax:+33-3-80293661.
E-mail address: [email protected] (L. Duvillard).
NIDDM patients with poor metabolic control de-spite diet and antidiabetic oral therapy are often treated by insulin. Insulin therapy generally improves gly-caemic control. Moreover it induces an important de-crease of hypertriglyceridaemia and has been demonstrated to make apoB-containing lipoprotein metabolism more physiological [8]. Unlike hypertriglyc-eridaemia, HDL cholesterol level is moderately im-proved, or not improved at all on insulin therapy [9 – 11]. The reasons for the persistence of low HDL cholesterol level on insulin therapy are not elucidated. To our knowledge the metabolism of HDL particles has not been investigated in insulin-treated NIDDM patients. The lack of modification of HDL cholesterol and apo A-I plasma concentrations may indicate that the metabolism of HDL particles is unchanged by insulin therapy, but also that insulin may induce oppo-site modifications on production and catabolism of these particles.
In order to get further insight into the persistence of low HDL cholesterol concentration in insulin-treated NIDDM patients, we compared the kinetic of apolipo-proteins A-I and A-II, the two main apolipoapolipo-proteins of HDL particles, in NIDDM patients before and 2 months after the introduction of insulin therapy. ApoA-I and A-II were endogenously labelled withL
-[1-13C] leucine, a stable isotope, and sample isotopic
en-richment was quantified by gas chromatography/combustion/isotope ratio mass spec-trometry, the most precise and most accurate technique known at present [12]. In this article, we report that insulin therapy is unable to correct apoA-I hyper-catabolism in NIDDM patients, and by analyzing the evolution on insulin therapy of factors likely to be involved in apoA-I hypercatabolism, we elucidated the reasons for its persistence in insulin-treated NIDDM patients.
2. Subjects and methods
2.1. Subjects
Six NIDDM patients and five healthy normolipi-daemic subjects with normal glucose tolerance were studied. All subjects underwent physical examination and laboratory tests for exclusion of hepatic, renal and thyroid abnormalities. Control subjects did not take any medication. At their entry in the study, NIDDM patients were treated by oral antidiabetic therapy (both sulfonylureas (glibenclamide 15 mg day−1) and met-formin (2550 mg day−1) in all patients). They were not taking any drug that could affect lipid metabolism. Insulin treatment was introduced in NIDDM patients after the first kinetic experiment. It consisted in 2 daily injections of intermediate acting human insulin at a dose of 0.26 – 1 U kg−1day−1. The patients performed three times daily capillary glucose monitoring. They were educated in order to adapt insulin doses according to capillary blood glucose level. The goal was to obtain a fasting glycaemic level between 4.5 and 8.25 mmol l−1
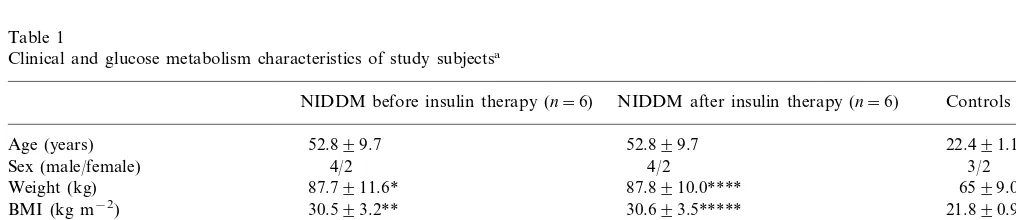
. The patients were asked to increase, by two units, their insulin dose when fasting glycaemia was above 8.25 mmol l−1 and to reduce it by two units, when fasting glycaemia was below 4.5 mmol l−1. Physical and biochemical characteristics of controls and NIDDM subjects are shown in Table 1. The experimen-tal protocol was approved by the ethics committee of the Dijon University Hospital, and written informed consent was obtained from each subject before the study.
2.2. Experimental protocol
Two kinetic studies were performed in each NIDDM patient: the first before the introduction of insulin therapy and the second 2 months later.
Table 1
Clinical and glucose metabolism characteristics of study subjectsa
NIDDM before insulin therapy (n=6) NIDDM after insulin therapy (n=6) Controls (n=5)
Age (years) 52.899.7 52.899.7 22.491.1
3/2
Sex (male/female) 4/2 4/2
87.8910.0**** 87.7911.6*
Weight (kg) 6599.0
30.593.2**
BMI (kg m−2) 30.693.5***** 21.890.9
Fasting blood glucose (mmol l−1) 11.9391.89** 8.1691.11***,***** 4.3890.28 7.891.4***
9.391.5 HbA1c (%)
6.1891.15 10.8397.63
Fasting insulin (mUI l−1)
13.2192.33
SSPG (mmol l−1) 10.8295.83
aValues are mean9SD. *PB0.05.
**PB0.01 NIDDM before insulin therapy versus controls (Mann–Whitney U test). ***PB0.05 NIDDM after versus before insulin therapy (Wilcoxon matched pairs test). ****PB0.05.
The day before the kinetic experiment, insulin resis-tance was estimated in NIDDM subjects by the insulin suppressive test, as explained in Ref. [13]. Shortly, insulin-stimulated glucose uptake was estimated by measuring the steady state plasma glucose (SSPG) con-centrations achieved during the last 60 min of a 180-min continuous infusion of somatostatin, insulin and glucose. Somatostatin, in this test, is used to suppress endogenous insulin production, and insulin and glucose are infused at a dose of 0.8 mU kg−1min−1and 6 mg kg−1
min−1
, respectively. Normal subjects have SSPG below 6.6 mmol l−1
[13].
The kinetic study was performed in the fed state. Food intake, with a leucine poor diet (1700 kcal day−1
, 55% carbohydrates, 39% fats and 7% proteins), was fractionated in small portions which were provided every 2 h, starting 6 h prior to the tracer infusion, up to the end of the study, in order to avoid important variations in apolipoprotein plasma concentration, as previously performed by other groups [8,14]. The en-dogenous labelling of apolipoproteins A-I, A-II and B-100 was carried out by administration of L-[1-13C]
leucine (99 atom%; Eurisotop, Saint Aubin, France), dissolved in 0.9% NaCl solution. Each subject received intravenously a primed infusion of 0.7 mg kg−1
of tracer immediately followed by a 16 h constant infusion of 0.7 mg kg−1
h−1
. Blood samples were drawn in tubes without anticoagulant but with a gel separator (Becton Dickinson, Meylan, France) at 0, 0.25, 0.75, 1, 1.5, 2, 3, 4, 6, 8, 10, 12, 14, 15 and 16 h after the primed infusion. Serum was separated by centrifugation for 10 min at 4°C and 3000×g. Sodium azide and aprotinin were added to serum at final concentration of 500 and 17 mg l−1, respectively.
2.3. Analytical procedure
2.3.1. Isolation of apolipoproteins
VLDL (density (d)B1.006 g ml−1
) and HDL (1.070BdB1.21) were isolated from plasma by se-quential flotation ultracentrifugation, using a 50.4 rotor in a L7 apparatus (Beckman Instruments, Palo Alto, USA). HDL fractions were then dialyzed against a 10 mmol l−1 ammonium bicarbonate buffer pH 8.2 con-taining 0.01% EDTA and 0.013% sodium azide. VLDL and HDL fractions were delipidated 1 h at −20°C using ten volumes of diethylether-ethanol 3:1. Apolipo-proteins were isolated by preparative discontinuous sodium dodecylsulfate (SDS)-polyacrylamide gel elec-trophoresis on a 3 and 15% gel. The delipidated apoA-I and A-II containing material was solubilized in 0.05 M Tris buffer pH 8.6, containing 3% SDS and 10% glyc-erol and applied to a 3-mm thick vertical slab gel. The apoB-100 buffer contained 3% mercaptoethanol in ad-dition. After staining with Coomassie blue R-250, apolipoproteins were cut from the gel and hydrolyzed
in 6 N HCl for 16 h at 110°C under nitrogen vacuum. Samples were then centrifuged to remove polyacry-lamide. Supernatants were lyophilized in a Speed Vac (Savant Instrument, Farmingdale, New York, USA). Lyophilized samples were dissolved in 50% acetic acid, applied to an AG-50W-X8 200-400 mesh cation ex-change column (Bio-Rad, Richmond, CA), and amino acids were recovered by elution with 4 N NH4OH and lyophilized.
2.3.2. Determination of leucine enrichment by gas
chromatography/combustion/isotope ratio mass
spectrometry (GC/C/IRMS)
Amino acids were converted to N-acetyl O-propyl esters and were analyzed on a Finnigan Mat Delta C isotope ratio mass spectrometer (Finnigan Mat, Bre-men, Germany) coupled to a HP 5890 series II gas chromatograph (Hewlett Packard). The GC was equipped with a split/splitless injector and fitted with a BPX5 capillary column (30 m, 0.32 mm internal diame-ter, 25 mm film thickness, S.G.E., Ringwood Vic., Aus-tralia) and a 2 m retention gap (RGK-1, SGE). Carrier gas was helium and the column head pressure was set at 14 PSI. Injector temperature was 250°C for leucine analysis. The splitless mode injection was adopted. The solvent purging valve was opened 0.6 min after injec-tion. The column was held isothermal, at 50°C for 1 min after injection, then the temperature was pro-grammed at 20°C min−1 up to 135°C, at 2°C min−1 from 135 to 149°C, at 15°C min−1from 149 to 250°C, and was held for 5 min at 290°C. The operating condi-tions of the ion source were as follows: source chamber pressure 1.4×10⁻⁶ mbar, ionising energy 80 eV, ion accelerating voltage 3 kV. Isotope abundance was ex-pressed relatively to pulse peaks of reference gas. Data were analyzed using the supplier software (Finnigan ISODAT).
13C leucine enrichment was initially expressed in delta
‰ and converted in tracer/tracee ratio prior modelling [15 – 17].
2.4. Modelling
majority of apo A-I and A-II are synthesized by the liver, as demonstrated by Ikewaki et al. [18]. In the steady state, the fractional catabolic rate equals the fractional synthetic rate [19].
Because NIDDM patients were obese, the apoA-I and A-II production rates were calculated by multiply-ing the apoA-I and A-II concentrations by the respec-tive FCR of these apolipoproteins. Thus, data were normalized to the plasma volume of each subject.
2.5. Analytical methods
2.5.1. Cholesteryl ester transfer protein (CETP) acti6ity and mass assays
CETP activity in total human plasma was evaluated by measuring the rate of transfer of radiolabeled cholesteryl esters (CE) from [3H]CE-HDL
3 toward the apoB-containing lipoprotein plasma fraction according to the procedure previously described [20]. Briefly, mix-tures containing 25 ml of plasma, [3H]CE-HDL3 (2.5 nmol of cholesterol), and iodoacetate (75 nmol) in a final volume of 50 ml were incubated for 3 h at 37°C. Then, mixtures were ultracentrifuged at a density of 1.07 g ml−1. The recovereddB1.07 and d\1.07 frac-tions were mixed with scintillation fluid (OptiPhase Hisafe 3, Pharmacia), and radioactivity was counted for 5 min. Results were calculated as net percentages of total radiolabeled CEs transferred from the density\ 1.07 g ml−1 to the densityB1.07 g ml−1 fractions, after deduction of the transfer occuring with control sample incubated at 4°C.
CETP mass concentrations were measured by using a competitive enzyme-linked immunosorbent assay on a Biomek 2000 (Beckman Instrument). CETP mass con-centration values were determined in quadruplicate from a calibration curve obtained with a frozen plasma standard [21].
Plasma glucose concentrations were measured by an enzymatic method (glucose oxidase) on a Vitros 750 analyzer (Johnson & Johnson Clinical Diagnostics, Rochester, NY). HbA1c was measured with ion ex-change high performance liquid chromatography (Bio-Rad, Richmond, CA). Serum insulin concentrations were determined by radioimmunoassay (CIS Bio Inter-national, Gif sur Yvette, France). Total and HDL cholesterol, free cholesterol, triglyceride (TG) and apolipoprotein concentrations were measured in a Cobas Fara analyzer (Roche, Basel, Switzerland). Con-centrations of total, free and HDL cholesterol were measured enzymatically (Boehringer Mannheim, Mannheim, Germany), after a magnesium phospho-tungstate precipitation for HDL cholesterol. Triglyce-rides were quantified with an enzymatic method (Roche). ApoB concentrations were measured by im-munoturbidimetry (Boehringer Mannheim). ApoA-I and apoA-II concentrations were determined by
im-munoturbidimetry with anti apoA-I and A-II antibod-ies purchased from Boehringer Mannheim. ApoA-I and apoA-II standards were purchased from Immuno AG (Vienna, Austria). CE was calculated as the difference between total and free cholesterol.
2.6. Statistical analysis
Results are expressed as means9SD. Statistical cal-culations were performed using the SPSS software package. Control and diabetic groups were compared using the non parametric Mann – Whitney U-test. Dia-betics before and after insulin therapy were compared using the non parametric Wilcoxon matched-pairs test. Correlation coefficients were calculated by the Spear-man test. P-values less than 0.05 were considered to be statistically significant.
3. Results
3.1. Metabolic parameters
Clinical and glucose metabolism characteristics are presented in Table 1. The NIDDM patients were sig-nificantly overweight compared to controls (BMI=
30.593.2 vs. 21.890.9 kg m−2
,PB0.01) and did not change their weight on insulin therapy (BMI=30.69 3.5 vs. 30.593.2 kg m−2). Insulin therapy significantly improved glycaemic control in NIDDM patients, as assessed by fasting blood glucose concentration (8.169 1.11 vs. 11.9391.89 mmol l−1; PB0.05) and HbA1c (7.891.4 vs. 9.391.5%; PB0.05). Insulin sensitivity was evaluated in NIDDM patients by calculating the SSPG value during the insulin suppressive test. Two month-insulin treatment did not significantly improve insulin sensitivity in our NIDDM patients (SSPG value: 10.8295.83 vs. 13.2192.23 mmol l−1 (normal value B6.6 mmol l−1
)).
3.2. Plasma lipids
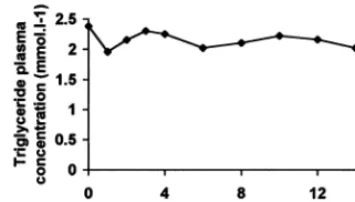
At the beginning of the study, we checked in one NIDDM patient that plasma triglyceride concentration was in steady state during the kinetic study. In this patient, the coefficient of variation of triglyceridaemia calculated from plasma triglyceride concentrations mea-sured throughout the kinetic study was 6% (Fig. 1). Afterwards, in other subjects, plasma triglyceride con-centration in the fed state was calculated as the mean value of 4 triglyceride measurements (at time 0, 4, 8 and 12 h).
Fig. 1. Evolution of plasma triglyceride concentration in one NIDDM patient during the kinetic experiment. The coefficient of variation for this parameter throughout the study was 6%.
Fig. 2. Kinetic curves of VLDL apoB-100 obtained during a primed constant infusion ofL-[1-13C]leucine. [13C] leucine enrichment values are expressed as percentage of plateau. Squares and triangles repre-sent experimental values for one control subject and one NIDDM patient, respectively. The curves were obtained by monoexponential modelling.
0.9090.23 mmol l−1
, respectively;PB0.01) (Table 2). On insulin therapy, plasma triglycerides fell by 35% in the fasting state (2.0890.65 mmol l−1, PB0.05) and by 24% in the fed state (2.9691,08 mmol l−1, not significant). Nevertheless, plasma triglycerides remained higher in NIDDM than in healthy subjects, both in the fasting and in the fed state (PB0.01). Total plasma cholesterol concentration was initially comparable be-tween patients and controls, and was not modified by insulin treatment in NIDDM patients. HDL cholesterol concentration was reduced in NIDDM patients before insulin therapy (0.9790.20 vs. 1.6490.31 mmol l−1) and remained unchanged on insulin therapy (0.979 0.26 vs. 0.9790.20 mmol l−1). Before insulin treat-ment, CETP mass was not significantly different in NIDDM patients and controls (2.1290.46 vs. 2.499 0.19 mg l−1), whereas CETP activity was increased, although not significantly, in NIDDM patients (33913 vs. 2593%). Insulin therapy modified neither CETP activity in NIDDM patients (30914 vs. 33913%), nor CETP mass (2.0590.63 vs. 2.1290.46 mg l−1).
HDL particles were triglyceride-enriched in NIDDM patients compared to control subjects, as assessed by the HDL TG/protein ratio (0.1790.03 vs. 0.1190.02, PB0.01) and by the HDL TG/CE ratio (0.2790.09 vs. 0.1290.03, PB0.01). Insulin therapy did not modify these two ratios in NIDDM patients (Table 2).
3.3. ApoA-I and A-II kinetic parameters
VLDL apoB-100 kinetic curves are shown in Fig. 2 for both a NIDDM patient and a control subject. HDL apoA-I and A-II kinetic curves are, respectively, shown in Figs. 3 and 4 for a NIDDM patient before and after the introduction of insulin therapy, and for a control subject. Absolute tracer/tracee ratio value at the plateau is not the same in two different subjects, despite
Table 2
Plasma lipid parameters of study subjectsa
NIDDM before insulin therapy NIDDM after insulin therapy Controls
(n=6) (n=5)
(n=6)
3.1892.35** 0.6090.18
Fasting triglycerides (mmol l−1) 2.0890.65***,*****
0.9090.23 3.8792.10**
Triglycerides in the fed state (mmol l−1) 2.9691.08***** 5.6492.10
Total cholesterol (mmol l−1) 5.7492.23 4.6490.97
1.1590.50*,**** 0.7690.11
ApoB (g l−1) 1.2290.62*
HDL cholesterol (mmol l−1) 0.9790.20** 0.9790.26***** 1.6490.31
HDL TG/protein ratio 0.1790.03** 0.1890.02***** 0.1190.02
0.1290.03 0.2290.07*****
HDL TG/CE ratio 0.2790.09**
2.0590.63
CETP mass (mg l−1) 2.1290.46 2.4990.19
2592 30914
33913 CETP activity (% transfer)
aValues are mean9SD. For the calculation of HDL TG/protein and HDL TG/CE ratios, protein, TG and CE values are, respectively, expressed as g l−1, mmol l−1and mmol l−1.
*PB0.05.
**PB0.01 NIDDM before insulin therapy versus controls (Mann–Whitney U test). ***PB0.05 NIDDM after versus before insulin therapy (Wilcoxon matched pairs test). ****PB0.05.
Fig. 3. Kinetic curves of HDL apoA-I obtained during a primed constant infusion ofL-[1-13C]leucine. [13C] leucine enrichment values are expressed as percentage of VLDL apoB-100 plateau. Symbols represent experimental values in one control subject (squares) and in one NIDDM patient before (closed triangles) and after the introduc-tion of insulin treatment (open triangles). The curves were obtained by monoexponential modelling.
values as percentage of VLDL apoB-100 plateau which is presumed to represent apoA-I plateau.
Before the introduction of insulin therapy, HDL apoA-I concentration was decreased by 13% in NIDDM patients compared to controls, but this differ-ence was not significant (1.1690.12 vs. 1.3390.14 g l−1) (Table 3). In NIDDM patients, HDL apoA-I FCR was accelerated by 70% (0.3990.11 vs. 0.2390.01 pool d−1, PB0.01). This increase of HDL apoA-I FCR remained statistically significant after adjustment for age. ApoA-I PR was increased by 45% (0.4590.12 vs. 0.3190.04 g d−1
l−1
, PB0.05). Before the intro-duction of insulin therapy, HDL apoA-II concentra-tion, FCR and PR were similar in NIDDM patients and controls, even after adjustment for age (0.2990.05 vs. 0.3090.04 g l−1; 0.2390.06 vs. 0.1990.02 pool d−1; 0.06590.019 vs. 0.05690.009 g d−1 l−1, respectively).
Insulin therapy did not induce any significant modifi-cation of HDL apoA-I and apoA-II concentration, FCR and PR in NIDDM patients (Table 3).
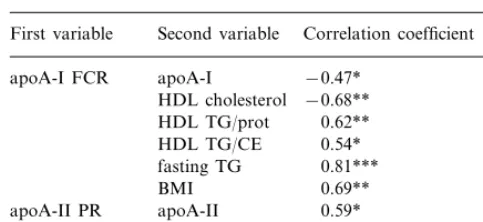
HDL apoA-I FCR was significantly correlated with apoA-I concentration (r= −0.47, PB0.05), HDL cholesterol concentration (r= −0.68, PB0.01), HDL TG/protein ratio (r=0.62, PB0.01), HDL TG/CE ratio (r=0.54, PB0.05), fasting TG (0.81, PB0.001) and BMI (r=0.69,PB0.01) (Table 4).
4. Discussion
Low HDL cholesterol and apoA-I levels are charac-teristic of the dyslipidaemia observed in NIDDM and have been related to an increased catabolic rate of apoA-I. This study was designed to explore the effects of insulin treatment, introduced in NIDDM patients because of a poor glycaemic control, on the kinetic of HDL apoA-I and A-II. We demonstrated that insulin therapy is unable to correct HDL apoA-I metabolic abnormalities.
Fig. 4. Kinetic curves of HDL apoA-II obtained during a primed constant infusion ofL-[1-13C]leucine. [13C] leucine enrichment values
are expressed as percentage of VLDL apoB-100 plateau. Symbols represent experimental values in one control subject (squares) and in one NIDDM patient before (closed triangles) and after the introduc-tion of insulin treatment (open triangles). The curves were obtained by monoexponential modelling.
the administration of the same dose of tracer (in mg kg−1 of body weight). Thus, in order to compare rigourously and precisely the kinetic curves between two different subjects, we expressed tracer/tracee ratio
Table 3
Kinetic parameters of HDL apoA-I and apoA-II in study subjectsa
NIDDM before insulin therapy (n=6) NIDDM after insulin therapy (n=6) Controls (n=5)
ApoA-I concentration (g l−1) 1.1690.12 1.1490.19 1.3390.14
0.2390.01
0.3990.11** 0.3490.05****
ApoA-I FCR (d−1)
0.3190.04
0.4590.12* 0.3990.08***
ApoA-I PR (g d−1l−1)
0.3090.04 0.2690.06
ApoA-II concentration (g l−1) 0.2990.05
0.1990.02
0.2390.06 0.2490.06
ApoA-II FCR (d−1)
0.06590.019 0.05690.009
ApoA-II PR (g d−1l−1) 0.06090.020
aValues are mean9SD. *PB0.05.
**PB0.01 NIDDM before insulin therapy versus controls (Mann–Whitney U test). ***PB0.05.
Table 4
Spearman correlation coefficients between HDL apoA-I and A-II kinetic parameters and other lipid and clinical parametersa
Second variable
aValues are mean9SD. *PB0.05.
**PB0.01. ***PB0.001.
sensitivity in insulin-treated NIDDM patients, the regi-men used was intensive insulin therapy achieving nor-mal or near nornor-mal fasting blood glucose and HbA1c levels [25,26]. In our study, we did not want to treat our NIDDM patients with intensive insulin treatment but with insulin regimen commonly used in NIDDM sub-jects. We know, from the UKPDS, that complete nor-malization of fasting blood glucose and HbA1c levels is most of the time not achieved with insulin therapy in NIDDM patients [27]. In the present study, we ob-tained a decrease of fasting blood glucose and HbA1c levels to a level comparable to that generally obtained in insulin-treated NIDDM patients [9,11]. Hypertriglyc-eridaemia in the fasting and postprandial state was also decreased by 35 and 24%, respectively, as previously reported [9,11].
Two-month insulin treatment had no influence on HDL apoA-II metabolism and was unable to improve the HDL apoA-I metabolism in NIDDM patients.
Low HDL cholesterol concentration and HDL apoA-I hypercatabolism have been found in insulin resistant and android obese patients, without glucose intolerance. Thus, HDL metabolism abnormalities con-stitute early defects in NIDDM patients, and precede the appearance of hyperglycaemia by several years [28 – 30]. They could be due more to insulin resistance itself than to hyperglycaemia. The fact that the significant improvement of glycaemic control observed in insulin-treated NIDDM patients in our study was not accom-panied by a decrease of HDL apoA-I catabolism reinforces this idea.
Brinton et al. reported that 70% of the variability of apoA-I fractional catabolic rate was due to variability in HDL size, which is partially determined by triglyce-ride level [30]. Indeed, the elevation of triglycetriglyce-ride level increases the exchanges of triglyceride and cholesteryl ester molecules between triglyceride-rich lipoproteins and HDL, via the cholesterol ester transfer protein (CETP), leading to triglyceride-enriched and choles-terol-depleted HDL particles [31]. The transferred triglyceride molecules are subsequently hydrolyzed by hepatic lipase (LH), leading to lipid-poor HDL. Such HDL are thermodynamically unstable and present structural modifications of apoA-I, which facilitates both its dissociation from the surface of HDL par-ticules [32,33], and its renal glomerular filtration [34]. In our study, the increase of CETP activity observed in NIDDM patients before the introduction of insulin therapy was not statistically significant. Nevertheless, the significantly higher triglyceride/protein and higher triglyceride/cholesteryl ester ratios in the HDL particles of the studied NIDDM patients, compared to control subjects, indicate that the exchanges of neutral lipids were increased in these patients. Moreover, Bagdade et al. [35] and Jones et al. [36], studying groups of larger size than ours, found an increased endogenous CETP HDL apoA-I and A-II turnover rates were studied by
a 16 hour primed-constant infusion ofL-[1-13C]leucine.
While this short-term endogenous labelling of apolipo-proteins does not enable us to distinguish between a fast and a slow turning-over plasma pool for apoA-I, as previously done by Fisher et al. [22], this approach is a reasonable method for determining I and apoA-II turn-over rates and is now widely used [5,7,23]. We have chosen to study the metabolism of apoA-I and apoA-II in the postprandial state, since this state is the most frequent for humans during a 24 h period. More-over, many data suggest that atherosclerosis could be partially a postprandial phenomenon [24]. The daily food intake was divided in small portions taken by the subjects every 2 h, as previously performed by several groups [8,14].
Before the introduction of insulin therapy, the NIDDM patients, compared to normolipidaemic healthy control subjects, presented a significantly re-duced HDL cholesterol level, a low apoA-I plasma concentration (although the difference was not statisti-cally significant) and both an increased apoA-I frac-tional catabolic rate and an increased production rate. These results confirm those previously reported [5,6]. On the contrary, we observed no major modifications of II metabolism in NIDDM, since HDL apoA-II concentration, fractional catabolic rate and produc-tion rates were not significantly different in NIDDM patients and control subjects. To our knowledge, apoA-II metabolism has never been studied in NIDDM, but our results are similar to those observed in glucose intolerant subjects, who presented an accelerated HDL apoA-I turn-over rate, without modification of HDL apoA-II metabolic parameters [7].
activity in NIDDM patients. The intensity of neutral lipid exchanges was probably not decreased by insulin therapy, since neither the triglyceride/protein ratio nor the triglyceride/cholesteryl ester ratio in the HDL parti-cles was modified. Hypertriglyceridaemia was improved by insulin, nevertheless the decrease was insufficient to diminish neutral lipid exchanges between triglyceride-rich lipoprotein and HDL. Indeed, CETP activity is correlated with triglyceride plasma level in nor-motriglyceridaemic subjects, whereas CETP mass be-comes the rate-limiting factor in hypertriglyceridaemic subjects [37]. Caixas et al. demonstrated that insulin therapy was able to make LDL less dense only when triglyceride level fell below 1.63 mmol l−1
[38]. In our study, triglyceride level remained above this threshold in insulin-treated NIDDM patients and the persistence of maximal neutral lipid exchanges is consistent with the observations reported by Caixas et al. [38]. The lack of improvement of apoA-I hypercatabolism on insulin therapy can probably be explained, at least partially, by the persistence of an elevated in vivo CETP activity in NIDDM patients.
In conclusion, NIDDM patients present low HDL cholesterol and apoA-I concentrations, related to an important acceleration of HDL apoA-I catabolic rate and an only moderate increase of apoA-I synthetic rate. Although insulin therapy improves hyperglycaemia and hypertriglyceridaemia, it is not able to correct these HDL apoA-I metabolic abnormalities. The persistence of insulin resistance and of an elevated CETP activity likely due to a still too high plasma triglyceride level, probably explains the inefficiency of insulin therapy to correct HDL apoA-I hypercatabolism in NIDDM patients.
Acknowledgements
We are indebted to Ve´ronique Jost of the pharma-ceutical department for preparation of13
C-leucine, Ce´-cile Gibassier for invaluable dietetary assistance and the study subjects for participating. The technical assistance of Dominique de Baudus, Elisabeth Niot and Liliane Princep is greatly acknowledged. The careful reading of this manuscript by Dr Christian Lallemant was greatly appreciated. This investigation was supported by the Universite´ de Bourgogne, the Conseil Re´gional de Bourgogne, and the Institut National de la Sante´ et de la Recherche Me´dicale (INSERM).
References
[1] Taskinen MR. Quantitative and qualitative lipoprotein abnor-malities in diabetes mellitus. Diabetes Suppl 2 1992;41:12 – 7.
[2] Laakso M, Lehto S, Penttila¨ I, Pyo¨ra¨la¨ K. Lipids and lipo-proteins predicting coronary heart disease mortality and morbid-ity in patients with non-insulin-dependent diabetes. Circulation 1993;88:1421 – 30.
[3] O’Brien T, Nguyen TT, Hallaway BJ, Hodge D, Bailey K, Kottke BA. HDL subparticles and coronary artery disease in NIDDM. Atherosclerosis 1996;121:285 – 91.
[4] Syva¨nne M, Kahri J, Virtanen KS, Taskinen MR. HDL contain-ing apolipoproteins A-I and A-II (LpA-I:LpA-II) as markers of coronary artery disease in men with non-insulin-dependent dia-betes mellitus. Circulation 1995;92:364 – 70.
[5] Fre´nais R, Ouguerram K, Maugeais C, Mahot P, Mauge`re P, Krempf M, Magot T. High density lipoprotein apolipoprotein A-I kinetics in NIDDM: a stable isotope kinetic study. Dia-betologia 1997;40:578 – 83.
[6] Golay A, Zech L, Shi MZ, Chiou YAM, Reaven GM, Chen YDI. High density lipoprotein (HDL) metabolism in non insulin dependent diabetes mellitus: measurement of HDL turnover using tritiated HDL. J Clin Endocrinol Metab 1987;65:512 – 8. [7] Pietzsch J, Julius U, Nitzsche S, Hanefeld M. In vivo evidence
for increased apolipoprotein A-I catabolism in subjects with impaired glucose tolerance. Diabetes 1998;47:1928 – 34. [8] Taskinen MR, Packard CJ, Sheperd J. Effect of insulin therapy
on metabolic fate of apolipoprotein B-containing lipoproteins in NIDDM. Diabetes 1990;39:1017 – 27.
[9] Taskinen MR, Kuusi T, Helve E, Nikkila¨ EA, Yki-Ja¨rvinen H. Insulin therapy induces antiatherogenic changes of serum lipo-proteins in non insulin-dependent diabetes. Arteriosclerosis 1988;8:168 – 77.
[10] Paisey R, Elkeles RS, Hambley J, Magill P. The effects of chlorpropamide and insulin on serum lipids, lipoproteins and fractional triglyceride removal. Diabetologia 1978;15:81 – 5. [11] Agardh CD, Nilsson-Ehle P, Schersten B. Improvement of the
plasma lipoprotein pattern after institution of insulin treatment in diabetes mellitus. Diabetes Care 1982;5:322 – 5.
[12] Pont F, Duvillard L, Maugeais C, Athias A, Perse´gol L, Gam-bert P, Verge`s B. Isotope ratio mass spectrometry, compared with conventional mass spectrometry in kinetic studies at low and high enrichment levels: application to lipoprotein kinetics. Anal Biochem 1997;248:277 – 87.
[13] Shen DC, Shien SM, Fuh MMT, Wu DA, Chen YDI, Reaven GM. Resistance to insulin-stimulated-glucose uptake in patients with hypertension. J Clin Endocrinol Metab 1988;66:580 – 3. [14] Verge`s B, Rader D, Schaefer J, Zech L, Kindt M, Fairwell T,
Gambert P, Brewer HB. In vivo metabolism of apolipoprotein A-IV in severe hypertriglyceridemia: a combined radiotracer and stable isotope kinetic study. J Lipid Res 1994;35:2280 – 91. [15] Pont F, Duvillard L, Verge`s B, Gambert P. Development of
compartmental models in stable isotope experiments: application to lipoprotein metabolism. Arterioscler Thromb Vasc Biol 1998;18:853 – 60.
[16] Cobelli C, Toffolo G, Foster DM. Tracer-to-tracee ratio for analysis of stable isotope tracer data: link with radioactive kinetic formalism. Am J Physiol 1992;262:E968 – 75.
[17] Cobelli C, Toffolo G, Bier DM, Nosadini R. Models to interpret kinetic data in stable isotope tracer studies. Am J Physiol 1987;253:E551 – 64.
[18] Ikewaki K, Rader DJ, Schaefer JR, Fairwell T, Zech LA, Brewer HB. Evaluation of apoA-I kinetics in humans using simulta-neous endogenous stable isotope and exogenous radiotracer methods. J Lipid Res 1993;34:2207 – 15.
[19] Foster DM, Barett PHR, Toffolo G, Beltz W, Cobelli C. Esti-mating the fractional synthetic rate of plasma apolipoproteins and lipids from stable isotope data. J Lipid Res 1993;34:2193 – 205.
of lipoprotein-bound NEFAs in enhancing the specific activity of plasma CETP in the nephrotic syndrome. Arterioscl Thromb Vasc Biol 1997;17:2559 – 67.
[21] Guyard-Dangremont V, Lagrost L, Gambert P, Lallemant C. Competitive enzyme-linked immunosorbent assay of the human cholesteryl ester transfer protein (CETP). Clin Chim Acta 1994;231:147 – 60.
[22] Fisher WR, Venkatakrishnan V, Zech LA, Hall CM, Kilgore LL, Stacpoole PW, Diffenderfer MR, Friday KE, Sumner AE, Marsh JB. Kinetic evidence for both a fast and a slow secretory pathway for apolipoprotein A-I in humans. J Lipid Res 1995;36:1618 – 28.
[23] Batal R, Tremblay M, Krimbou L, Mamer O, Davignon J, Genest J, Cohn JS. Familial HDL deficiency characterized by hypercatabolism of mature apoA-I but not proapoA-I. Arte-rioscl Thromb Vasc Biol 1998;18:655 – 64.
[24] Zilversmit DB. Atherogenesis: a postprandial phenomenon. Cir-culation 1979;60:473 – 85.
[25] Firth RG, Bell PM, Rizza RA. Effects of tolazamide and exoge-nous insulin on insulin action in patients with non-insulin-depen-dent diabetes mellitus. N Engl J Med 1986;314:1280 – 6. [26] Yki-Ya¨rvinen H, Nikkila E, Eero H, Taskinen MR. Clinical
benefits and mechanisms of a sustained response to intermittent insulin therapy in type 2 diabetic patients with secondary drug failure. Am J Med 1988;84:185 – 92.
[27] UK Prospective Diabetes Study (UKPDS) Group. Lancet 1998;352:837 – 853.
[28] Terry RB, Yurgalevitch S, Thompson PD. High-density apolipo-protein A-I and A-II kinetics in relation to regional adiposity. Metabolism 1992;41:1386 – 92.
[29] Brinton EA, Eisenberg S, Breslow JL. Increased apo A-I and apo A-II fractional catabolic rate in patients with low high density lipoprotein-cholesterol levels with or without hyper-triglyceridemia. J Clin Invest 1991;87:536 – 44.
[30] Brinton EA, Eisenberg S, Breslow JL. Human HDL cholesterol levels are determined by apoA-I fractional catabolic rate, which
correlates inversely with estimates of HDL particle size: effect of gender, hepatic and lipoprotein lipases, triglyceride and insulin levels, and body fat distribution. Arterioscl Thromb 1994;14:707 – 20.
[31] Lagrost L. The role of cholesteryl ester transfer protein and phospholipid transfer protein in the remodeling of plasma high density lipoproteins. Trends Cardiovasc Med 1997;7:218 – 24. [32] Sparks DL, Davidson WS, Lund-Katz S, Phillips MC. Effect of
the neutral lipid content of high density lipoprotein on apolipo-protein A-I structure and particle stability. J Biol Chem 1995;270:26910 – 7.
[33] Braschi S, Neville TAM, Vohl MC, Sparks DL. Apolipoprotein A-I charge and conformation regulate the clearance of reconsti-tuted high density lipoprotein in vivo. J Lipid Res 1999;40:522 – 32.
[34] Horowitz BS, Goldberg IJ, Merab J, Vanni TM, Ramakrishnan R, Ginsberg HN. Increased plasma and renal clearance of an exchangeable pool of apolipoprotein A-I in subjects with low levels of high density lipoprotein cholesterol. J Clin Invest 1993;91:1743 – 52.
[35] Bagdade JD, Lane JT, Subbaiah PV, Otto ME, Ritter MC. Accelerated cholesteryl ester transfer in non insulin-dependent diabetes mellitus. Atherosclerosis 1993;104:69 – 77.
[36] Jones RJ, Owens D, Brennan C, Collins PB, Johnson AH, Tomkin GH. Increased esterification of cholesterol and transfer of cholesteryl ester to apo B-containing lipoproteins in type 2 diabetes: relationship to serum lipoproteins A-I and A-II. Atherosclerosis 1996;119:151 – 7.
[37] Mann CJ, Yen FT, Grant AM, Bihain BE. Mechanism of plasma cholesteryl ester in hypertriglyceridemia. J Clin Invest 1991;88:2059 – 66.
[38] Caixas A, Ordonez-Llanos J, de Leiva A, Payes A, Homs R, Perez A. Optimization of glycemic control by insulin therapy decreases the proportion of small dense LDL particles in diabetic patients. Diabetes 1997;46:1207 – 13.