Quantification of human plasma phospholipid transfer protein
(PLTP): relationship between PLTP mass and phospholipid
transfer activity
Jarkko Huuskonen, Minna Ekstro¨m, Esa Tahvanainen, Anu Vainio, Jari Metso,
Pirkko Pussinen, Christian Ehnholm, Vesa M. Olkkonen, Matti Jauhiainen *
Department of Biochemistry,National Public Health Institute,Mannerheimintie 166,FIN-00300 Helsinki, Finland
Received 4 June 1999; received in revised form 20 September 1999; accepted 8 October 1999
Abstract
A sensitive sandwich-type enzyme-linked immunosorbent assay (ELISA) for human plasma phospholipid transfer protein (PLTP) has been developed using a monoclonal capture antibody and a polyclonal detection antibody. The ELISA allows for the accurate quantification of PLTP in the range of 25 – 250 ng PLTP/assay. Using the ELISA, the mean plasma PLTP concentration in a Finnish population sample (n=159) was determined to be 15.695.1 mg/l, the values ranging from 2.30 to 33.4 mg/l. PLTP mass correlated positively with HDL-cholesterol (r=0.36,PB0.001), apoA-I (r=0.37,PB0.001), apoA-II (r=0.20,PB0.05), Lp(A-I) (r=0.26, P=0.001) and Lp(A-I/A-II) particles (r=0.34, PB0.001), and negatively with body mass index (BMI) (r= −0.28,PB0.001) and serum triacylglycerol (TG) concentration (r= −0.34,PB0.001). PLTP mass did not correlate with phospholipid transfer activity as measured with a radiometric assay. The specific activity of PLTP, i.e. phospholipid transfer activity divided by PLTP mass, correlated positively with plasma TG concentration (r=0.568, PB0.001), BMI (r=0.45,
PB0.001), apoB (r=0.45, PB0.001), total cholesterol (r=0.42, PB0.001), LDL-cholesterol (r=0.34, PB0.001) and age (r=0.36, PB0.001), and negatively with HDL-cholesterol (r= −0.33, PB0.001), Lp(A-I) (r= −0.21, PB0.01) as well as Lp(A-I/A-II) particles (r= −0.32,PB0.001). When both PLTP mass and phospholipid transfer activity were adjusted for plasma TG concentration, a significant positive correlation was revealed (partial correlation,r=0.31,PB0.001). The results suggest that PLTP mass and phospholipid transfer activity are strongly modulated by plasma lipoprotein composition: PLTP mass correlates positively with parameters reflecting plasma high density lipoprotein (HDL) levels, but the protein appears to be most active in subjects displaying high TG concentration. © 2000 Elsevier Science Ireland Ltd. All rights reserved.
Keywords:High density lipoprotein metabolism; Plasma lipids; Specific activity; Triacylglycerol
www.elsevier.com/locate/atherosclerosis
1. Introduction
The observation that high density lipoproteins (HDL) have powerful antiatherogenic properties has stimulated research into this lipoprotein fraction [1]. The mechanism of the protection is unknown but may
be due to the involvement of HDL in the process of reverse cholesterol transport (RCT), whereby choles-terol is transported from extrahepatic tissues to the liver for excretion from the body. The circulating HDL are heterogeneous, comprising a number of subpopula-tions of particles of distinct size, charge, composition and function. There is evidence that some HDL sub-populations are better than others in protecting against atherosclerosis [1]. HDL are continuously remodelled in plasma through the action of enzymes and lipid transfer proteins [2].
The human plasma phospholipid transfer protein (PLTP) plays an important role in the regulation of plasma HDL levels and governs the distribution of Abbre6iations: BMI, body mass index; CETP, cholesteryl ester
transfer protein; HDL, high density lipoprotein; HL, hepatic lipase; mAb, monoclonal antibody; PL, phospholipid; PLTP, phospholipid transfer protein; SDS – PAGE, sodium dodecyl sulfate polyacrylamide gel electrophoresis; TG, triacylglycerol.
* Corresponding author. Tel.: +358-9-47448467; fax: + 358-9-47448281.
E-mail address:[email protected] (M. Jauhiainen)
HDL subpopulations. It was initially characterized as a protein facilitating the transfer of phospholipids be-tween LDL and HDL [3] or from phospholipid vesicles to HDL [4]. Later, it was shown that PLTP can induce HDL conversion, a process which remodels a homoge-neous HDL fraction into populations of large and small HDL particles [5,6]. The small lipid poor particles are similar to preb-HDL, the initial acceptors of mem-brane cholesterol from peripheral cells in the reverse cholesterol transport process. Recent in vivo studies employing adenoviral overexpression of human PLTP or human PLTP transgenic mice have shown that PLTP has profound effects on plasma HDL. Adenovi-ral overexpression of PLTP resulted in a dramatic decrease in HDL levels, while preb-HDL levels were substantially elevated. In human PLTP transgenic mice, the HDL-cholesterol/non-HDL cholesterol ratio in-creased significantly. Furthermore, after the human PLTP transgene mice were cross-bred with human apoA-I transgenics, there was an increase in HDL phospholipids and in preb-mobile HDL [7 – 10]. The connections of plasma PLTP activity or tissue PLTP expression levels with specific clinical states have been addressed only to a very limited extent. Increased PLTP activity has been reported to be associated with insulin resistance in type II diabetic patients [11]. Upregulation of PLTP expression is detected in emphysematous lungs and in cultured alveolar epithelial cells upon experimen-tally induced hypoxia [12]. Furthermore, in a study with alcoholic patients, high alcohol consumption was associated with increased plasma PLTP activity [13]. In a mouse model, PLTP activity was reported to be increased by a high-cholesterol diet and decreased upon injection of lipopolysaccharide [14].
Until now most studies have assessed only the phos-pholipid transfer activity of PLTP in clinical specimens. Measurement of plasma PLTP activity using either the endogenous [8] or exogenous [4] assays may be affected by differences in the composition of the plasma sam-ples. Further, there may be factors other than PLTP that facilitate phospholipid transfer in these activity assays: phospholipid exchange/transfer activity has also been attributed to plasma lipopolysaccharide binding protein (LBP) [15], soluble CD14 [15], and cholesteryl ester transfer protein (CETP) [16]. It is therefore crucial for our understanding of plasma phospholipid (PL) transfer processes, their regulation, and their physiolog-ical implications that PLTP mass in plasma is also determined.
In the present study we describe an enzyme-linked immunosorbent assay (ELISA) for the measurement of PLTP mass, based on the use of a monoclonal capture antibody and a polyclonal detection antibody. The ELISA was used to assay PLTP mass in plasma of 159 normal Finnish individuals. The relationships between plasma PLTP mass, phospholipid transfer activity, and
various lipoprotein parameters suggest that in healthy individuals phospholipid transfer activity is strongly modulated by the plasma lipid/lipoprotein composition. The method provides a novel tool to elucidate the mechanisms by which PLTP regulates plasma HDL levels and subpopulation distribution.
2. Materials and methods
2.1. Standardization of the ELISA
2.1.1. Purification of human plasma PLTP
2.2. Measurement of phospholipid transfer acti6ity
Phospholipid transfer activity was measured using a radiometric method [4]. Phosphatidylcholine (PC) lipo-somes were prepared essentially as described [4]. The liposome preparation contained 10 mmol of egg PC, 1 mCi of [14C]dipalmitoyl PC, and 20 nmol of butylated hydroxytoluene. Each assay contained HDL3as accep-tor (250 mg protein), donor liposomes (150 nmol of labelled liposomes), serum/plasma sample (4ml of sam-ple diluted 1:10 with TBS, 1 mM EDTA), in a final volume of 400ml. The assays were carried out in 1.5-ml Eppendorf tubes which were incubated at 37°C for 1.5 h. Under these conditions the assay was linear within the range of plasma phospholipid transfer activity ob-served in the study subjects. In each series, the samples were analyzed in duplicate. Each series also contained duplicate blank tubes without sample and duplicate control plasma samples that were stored at −70°C (control samples did not lose PL transfer activity even after prolonged storage for 1 – 2 years at this tempera-ture). For each new sample series, a new plasma control sample was thawed. All the other details of the assay have been described [20]. Control samples were used to monitor the repeatability of the assay within and be-tween the series. The intra-assay precision was 9.4% (n=11) and the interassay precision 12% (n=50).
2.3. The anti-PLTP antibodies
For production of the polyclonal PLTP antibody R176, a cDNA segment encoding the C-terminal amino acid residues 425 – 493 of PLTP was expressed in Es
-cherichia coli from the pGAT-4 vector (a kind gift of Dr Johan Pera¨nen, Institute of Biotechnology, Univer-sity of Helsinki) as a His6-glutathione-S-transferase (GST) fusion. The insoluble recombinant protein was isolated by preparative SDS – PAGE after enrichment using the inclusion body purification protocol of Lin and Cheng [21]. The protein was used for subcutaneous immunization of New Zealand White rabbits mixed with complete (first injection) or incomplete (subse-quent injections) Freund’s adjuvant. The IgG fraction of the antiserum was isolated using Protein A-Sep-harose CL 4B (Pharmacia) according to the manufac-turer’s instructions, dialyzed at 4°C against phosphate-buffered saline (PBS), and stored in aliquots at −80°C.
The monoclonal antibody, JH59, against PLTP was produced as follows. Full-length human PLTP was produced in E. coli as a thioredoxin fusion protein using the ThioFusion expression system (Invitrogen). The predominantly insoluble protein was purified by preparative SDS – PAGE and used for subcutaneous immunization of BALB/c mice. After an intraperitoneal booster, the mice were sacrificed and hybridomas were
generated [22] using the P2-NS1-Ag4-1 myeloma fusion partner [23]. Culture supernatants were tested for PLTP antibody by Western blotting, and the positive cultures were cloned three times by limiting dilution. The mono-clonal hybridoma cells were passaged in Pristane-primed BALB/c mice for ascitic fluid production, and the monoclonal IgG antibody was isolated using protein G-Sepharose CL 4B columns (Pharmacia) ac-cording to the manufacturer’s instructions. The IgG was dialyzed against PBS at 4°C and stored in aliquots at −80°C.
2.4. The sandwich ELISA for PLTP mass determination
stan-dard dilution series was present in duplicate on every single ELISA plate.
2.5. Other methods
Total cholesterol and HDL cholesterol (after precipi-tation of b-lipoproteins with dextran sulphate-magne-sium chloride) were determined enzymatically (CHOD-PAP method) using the reagents from Boehringer Mannheim, Mannheim, Germany [24]. Tri-acylglycerol concentration was determined with the fully enzymatic method of Wahlefeld [25]. Apolipo-proteins (apo) A-I, A-II and B were quantified by immunoturbidometry [26]. LDL cholesterol was calcu-lated according to the formula of Friedewald [27]. Concentrations of Lp(A-I) and Lp(A-I/A-II) particles were measured by rocket immunoelectrophoresis using commercial reagents (Sebia, Paris, France). In Western blot analysis, human plasma samples (1 ml of 1:10 diluted plasma per well) were subjected to SDS – PAGE analysis on 12.5% homogeneous polyacrylamide gels under reducing conditions, whereafter the proteins were transferred onto nitrocellulose sheets. After anti-PLTP antibody treatment, the blots were visualized using the Enhanced ChemiLuminescence detection system (Amersham).
2.6. The study population
The study subjects, n=159, were from a large Finnish cross-sectional study (FINRISK) [28]. They represented men and women in four age groups from 25 to 65 years in 10-year intervals. The participants of the FINRISK study were randomly selected from the inhabitants of North Karelia, the Kuopio province, and Southwestern Finland, thus closely representing the Finnish population. Among the study subjects, 86.2% were moderate drinkers, 8.8% drank so much they felt intoxicated at least once per week and 5% did not use alcohol. Of the subjects, 51% were regular tobacco users, 15% were occasional smokers, and 34% had never smoked. Among women, 12.3% used oral contra-ceptives, 1.4% used intrauterine devices delivering hor-mones, 19.2% used estrogen for menopause symptoms, and 1.4% were gravid. Diabetes (type 1 or 2) had been diagnosed in 2.5% of the participants. Blood samples from the study subjects were collected in non-fasting state. All participants have given informed consent and the study has been approved by an ethics committee.
2.7. Statistical analyses
Statistical testing was performed using the Statistical Package for Social Sciences (SPSS) version 7.5 (SPSS, Chicago, USA). The dependence of serum PLTP mass or phospholipid transfer activity on gender was tested
by analysis of variance (ANOVA). The correlation of PLTP mass, phospholipid transfer activity and specific activity with age, body mass index (BMI), serum cholesterol, triacylglycerol, HDL cholesterol, apoB, apoA-I, apoA-II, apoA-I in Lp(A-I) or Lp(A-I/A-II) particles, and serum gamma glutamyl transferase (S-GT) was analyzed with unadjusted values.
3. Results
3.1. De6elopment of an ELISA for determination of
PLTP mass
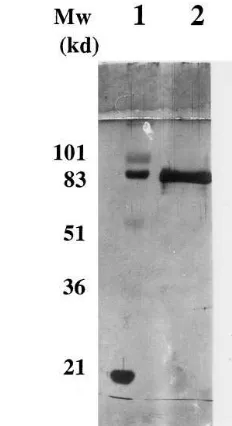
The two antibodies selected for the PLTP ELISA, the monoclonal antibody JH59 used as capture antibody and the rabbit polyclonal antibody R176 used as detec-tion antibody, have been characterized previously using PLTP derived from a stably transfected HeLa cell line [29,30]. The immunoreactivity of the capture mAb (JH59) as well as the polyclonal detection antibody (R176) was further tested with human plasma samples. In Western blots visualized using the sensitive En-hanced Chemiluminescence method, both antibodies detected a major 80-kDa PLTP band and only minor immunoreactivity with more slowly migrating protein bands was observed, probably representing aggregated PLTP (Fig. 1).
For calibration of the ELISA, PLTP was purified about 6000-fold from human plasma. The purified PLTP, when subjected to SDS – PAGE and visualized by silver staining, showed one main 80-kDa protein band (Fig. 2). The 80-kDa band represented 90.1% of the total protein in the preparation as determined by gel scanning using the Bioimage System (Millipore). The protein concentration of this primary PLTP stan-dard was assayed using the Lowry method with BSA as standard. Typically, purified PLTP preparations con-tained from 40 to 60 mg/ml PLTP protein.
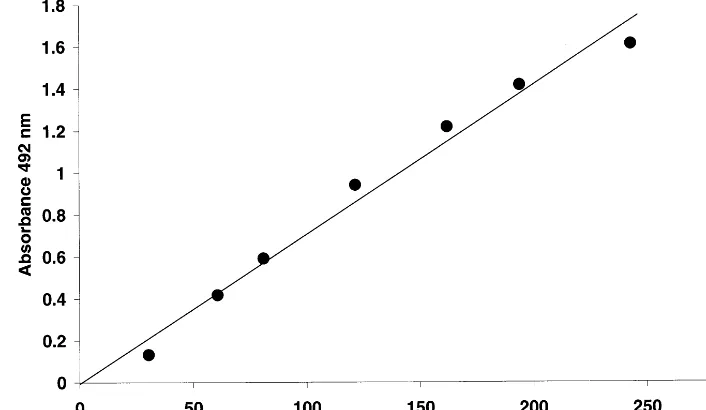
To obtain a standard curve for the PLTP-ELISA, dilutions of the primary standard were made in PBS-0.1% Tween 20 and used to create standard curves in the range of 25 – 250 ng PLTP protein per well. As shown in Fig. 3, the ELISA is linear over the entire range used and is suitable for the quantification of PLTP levels as low as 0.125 mg/l. The reproducibility of the ELISA was good. Between runs (n=3) each primary standard point differed on average 4.3% from the mean value.
Fig. 2. Electrophoretic analysis of purified plasma PLTP used as primary standard in ELISA. PLTP was purified from plasma as described in Section 2. To characterize the preparation and assess purity, 0.63-mg (lane 2) and 0.23-mg (lane 3) aliquots were subjected to SDS – PAGE using 12.5% gels. The protein bands were visualized either by silver staining (lane 2) or by immunoblotting using the monoclonal antibody JH59 (lane 3). Lane 1 shows molecular weight standards.
Fig. 1. Western blot analysis of human plasma with anti-PLTP antibodies. Plasma samples (1 ml/well of 1:10 diluted plasma) and purified PLTP were subjected to SDS – PAGE analysis on 12.5% polyacrylamide gels under reductive conditions whereafter the proteins were transferred onto nitrocellulose sheets. After antibody treatment, the blots were visualized using the Enhanced Chemilu-minescence method (Amersham). Lane A: immunoblot with the monoclonal antibody JH59 (the ELISA capture antibody); lane B: immunoblot with the polyclonal antibody R176 (the ELISA detection antibody); lane C: immunoblot of a purified plasma PLTP with JH59 as a control.
to minimize a possible bias caused by differences in the lipid/lipoprotein composition of the specimens.
3.2. Use of the ELISA for determination of PLTP concentration in plasma
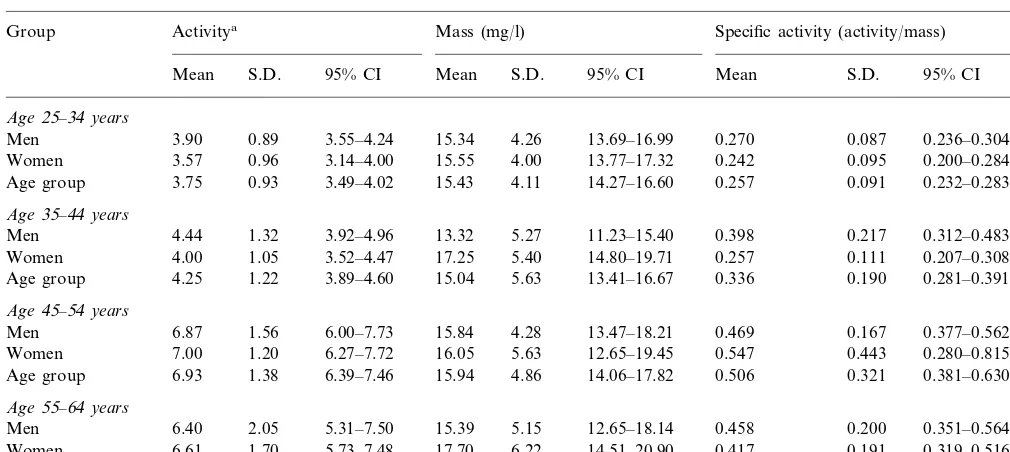
Having established the ELISA method, PLTP con-centrations were determined in human plasma samples obtained from 159 Finnish normolipidemic individuals. PLTP mass and phospholipid transfer activity values as well as calculated specific activities for different age groups of women and men are shown in Table 1. The mean PLTP mass in the study subjects was 15.695.1 (9S.D.) mg/l (range 2.3 – 33.4 mg/l). No difference in the phospholipid transfer activity, mass or specific ac-tivity in plasma could be observed between genders.
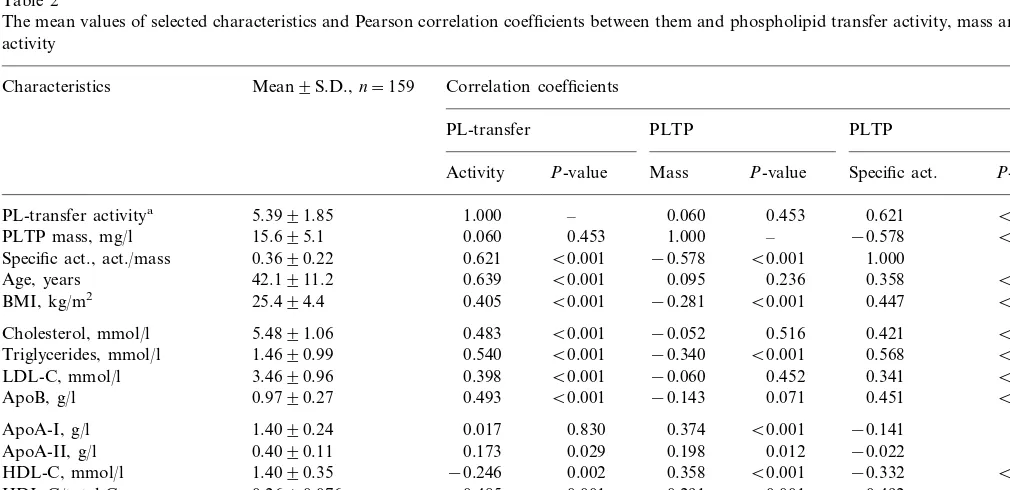
We have previously reported the plasma phospho-lipid transfer activity level of the subjects and the correlation of phospholipid transfer activity with vari-ous lipoprotein parameters [20]. The present ELISA method allowed us to extend the study to the relation-ships of PLTP mass and specific activity with plasma lipid parameters (Table 2). PLTP mass correlated posi-tively with HDL-cholesterol (r=0.36, PB0.001), apoA-I (r=0.37, PB0.001), apoA-II (r=0.20, PB
0.05), Lp(A-I) (r=0.26, P=0.001) and Lp(A-I/A-II) particles (r=0.34,PB0.001), and negatively with BMI (r= −0.28,PB0.001) and serum triacylglycerol (TG) concentration (r= −0.34, PB0.001). The specific ac-concentrations in specimens applied on ELISA plates
Fig. 3. Calibration of the ELISA for determination of PLTP mass. The ELISA was performed as described in Section 2. The standard curve was formed by serial dilution of purified PLTP. For the ELISA the monoclonal antibody JH59 was used as a capture antibody and the polyclonal R176 antibody as detection antibody. The standard points shown are the mean of three independent measurements after subtracting the background signals. Each standard point differed on average by B5% between different ELISA runs.
tivity of PLTP, i.e. phospholipid transfer activity di-vided by PLTP mass, correlated positively with plasma TG concentration (r=0.568,PB0.001), BMI (r=0.45,
PB0.001), apoB (r=0.45,PB0.001), total cholesterol (r=0.42, PB0.001), LDL-cholesterol (r=0.34, PB
0.001) and age (r=0.36, PB0.001), and negatively with HDL-cholesterol (r= −0.33,PB0.001), Lp(A-I) (r= −0.21, PB0.01) as well as Lp(A-I/A-II) particles (r= −0.32, PB0.001). Phospholipid transfer activity but not mass correlated positively with plasma gamma-GT activity (r=0.35,PB0.001). There were no statis-tically significant differences in PLTP mass or phospholipid transfer activity due to alcohol, tobacco, or hormone usage, or between individuals having dia-betes and healthy subjects.
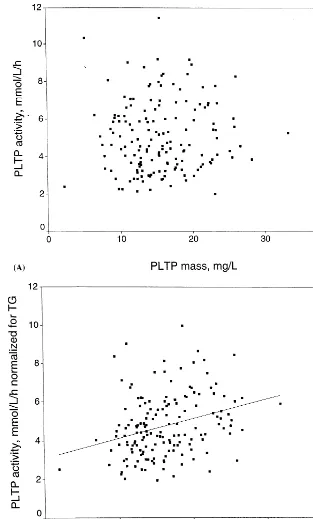
Surprisingly, there was no significant correlation be-tween plasma PLTP mass and phospholipid transfer activity values measured in sera from the population sample (correlation coefficient,r=0.06,P=0.453; Fig. 4A). However, both phospholipid transfer activity and PLTP mass correlated significantly with the plasma triacylglycerol concentration: phospholipid transfer ac-tivity displayed a positive correlation while PLTP mass showed a negative correlation with TG levels. When plasma TG concentration was included as a covariate in the analysis, a significant positive correlation be-tween phospholipid transfer activity and mass was re-vealed (partial correlation coefficient, r=0.31,
PB0.001; Fig. 4B). To exclude the possibility that differences in plasma TG concentration could cause a bias in either the PL transfer assay or the mass determi-nation, purified VLDL was added in different amounts
in the plasma (the secondary standard) to obtain final TG concentrations from 0.43 to 7.0 mmol/l. No signifi-cant effect of the TG addition was observed on the plasma PL transfer activity (Fig. 5A) or the PLTP mass quantitated with the present ELISA method (Fig. 5B). Also Intralipid was used to study the effect of TG on both assays; TG concentrations up to 20 mmol/l did not affect the activity or mass determinations. Other lipoprotein classes (LDL, HDL), when added to the plasma in different amounts (the highest final concen-tration per incubation, 15 mmol/l), showed no signifi-cant effect on these assays (data not shown).
4. Discussion
The plasma phospholipid transfer protein, PLTP, plays a major role in lipid transfer between lipoproteins and in modulating the size and composition of HDL particles. Until now, most studies concerning the physi-ological role of PLTP have quantitated PLTP based on phospholipid transfer activity from liposomes to HDL. However, in order to increase our understanding of the role of PLTP in lipoprotein metabolism, mass analysis of PLTP is a necessity. Therefore, the ELISA described is a valuable aid in studies concerning the physiological role of PLTP.
Table 1
Phospholipid transfer activity, mass and specific activity in different age groups of men and women
Mass (mg/l)
Group Activitya Specific activity (activity/mass) n
S.D. 95% CI Mean S.D. 95% CI
Mean Mean S.D. 95% CI
Age25–34years
0.89 3.55–4.24 15.34 4.26 13.69–16.99
Men 3.90 0.270 0.087 0.236–0.304 28
0.96 3.14–4.00 15.55 4.00 13.77–17.32
3.57 0.242
Women 0.095 0.200–0.284 22
Age group 3.75 0.93 3.49–4.02 15.43 4.11 14.27–16.60 0.257 0.091 0.232–0.283 50
Age35–44years
Men 4.44 1.32 3.92–4.96 13.32 5.27 11.23–15.40 0.398 0.217 0.312–0.483 27 1.05 3.52–4.47 17.25 5.40 14.80–19.71
Women 4.00 0.257 0.111 0.207–0.308 21
1.22 3.89–4.60 15.04 5.63 13.41–16.67
4.25 0.336
Age group 0.190 0.281–0.391 48
Age45–54years
1.56 6.00–7.73
Men 6.87 15.84 4.28 13.47–18.21 0.469 0.167 0.377–0.562 15
1.20 6.27–7.72 16.05 5.63 12.65–19.45
7.00 0.547
Women 0.443 0.280–0.815 13
6.93
Age group 1.38 6.39–7.46 15.94 4.86 14.06–17.82 0.506 0.321 0.381–0.630 28
Age55–64years
2.05 5.31–7.50 15.39 5.15 12.65–18.14
6.40 0.458
Men 0.200 0.351–0.564 16
6.61
Women 1.70 5.73–7.48 17.70 6.22 14.51–20.90 0.417 0.191 0.319–0.516 17 1.86 5.85–7.17 16.58 5.76 14.54–18.63 0.437 0.193 0.369–0.506 33 Age group 6.51
aPhospholipid transfer activity is expressed asmmol phospholipid transferred/ml per h.
shown that it recognizes PLTP bound to HDL [30]. The assay takes advantage of the high specificity and low background of the monoclonal JH59. The polyclonal rabbit antibody, R176, used for detection was also highly specific [29]. Here the specificity of these anti-bodies was further demonstrated by Western blot anal-ysis using a crude human plasma fraction. The bound detection antibody R176 was visualized using a specific peroxidase-coupled goat anti-rabbit IgG. The primary standard used in the ELISA was highly purified PLTP from fresh human plasma. The one band representing PLTP represented more than 90% of the protein and no degradation products were visible. The ELISA was very sensitive. Already at a level of 25 ng/well the PLTP-ELISA gave a signal about twofold higher than the background, making the assay suitable for the measure-ment of PLTP levels as low as 0.125 mg/l. As no matrix effects could be observed when this standard was di-luted in horse plasma, we used normolipidemic human plasma as a secondary standard. With this the ELISA showed excellent linearity up to 1.25 mg/l and low and stable background values. The reproducibility of the assay was good with intra- and inter-assay variations of 4.3 and 8.6%, respectively. However, one has to bear in mind that the absolute mass values obtained using this type of immunoassay are affected by the calibration procedures, especially the source and purification scheme of the primary standard, as well as the specific antibody reagents used in the assay.
We used the ELISA to determine PLTP concentra-tions in a Finnish population sample. The PLTP con-centration in 159 adult subjects ranged from 2.3 to 33.4
mg/l, the mean being 15.695.1 mg/l. A generally ac-cepted view is that enzyme activity reflects enzyme mass. Unexpectedly, no statistically significant correla-tion between PLTP mass and phospholipid transfer activity was detected in the study population when unadjusted values were used. A lack of association between the immunoreactive PLTP levels and PL trans-fer activity would suggest the presence of inactive or non-functional protein, or that other factors in serum modulate the phospholipid transfer activity/mass rela-tionship. PLTP mass correlated positively with parame-ters reflecting plasma HDL levels and negatively with those connected to plasma TG status. On the other hand, correlations of PLTP specific activity displayed a reversed pattern. Of the variables studied, serum TG concentration best explains the individual differences in the specific activity of PLTP. These differences were shown not to be caused by high TG concentration-in-duced bias in either the PL transfer or PLTP mass assays. After adjustment of serum phospholipid trans-fer activity and PLTP mass using the TG values, a significant correlation between the phospholipid trans-fer activity and mass was revealed. These findings sug-gest that PLTP mass and phospholipid transfer activity reflect individual variation in the metabolism of HDL and apoB-containing lipoproteins.
to differences in (i) the assay principle, direct versus competitive ELISA; (ii) the antibodies used; and (iii) purification and storage of the primary standard. A further discrepancy between the two studies was that Desrumaux et al. [31] observed a direct correlation between plasma PLTP mass and phospholipid transfer activity in fasting samples of 30 normolipidemic healthy subjects. In the present study the subjects were in non-fasting state, which causes large variation in plasma TG levels. The correlation was, however, re-vealed when TG concentration in each subject was included as a covariate in the statistical analysis. The use of non-fasting plasma samples was in this case extremely useful, since it allowed us to note the rela-tionship between plasma TG levels and PLTP. It has been proposed that a major role of plasma PLTP is to facilitate the transfer of surface remnant phospholipids during lipolysis from TG-rich lipoproteins to HDL. Recent analysis of mice with no PLTP gene expression provides strong support for this notion [32]. In the light of these findings, association between TG concentration and PLTP seems highly relevant from the physiological point of view. The association of triglycerides with the function of PLTP is highly interesting. It was recently suggested that the regulation of phospholipid transfer activity is linked by an unknown mechanism to plasma triacylglycerol and free fatty acid levels [11,33]. Fur-thermore, we have demonstrated that the HDL conver-sion activity of PLTP is enhanced when the amount of
TG in the substrate HDL particles is increased [34]. These observations are in agreement with the present data and suggest that serum TG levels strongly affect phospholipid transfer activity. The negative correlation observed between the PLTP mass and TG levels may be due to the fact that increase in TG is associated with a decrease in serum HDL cholesterol, which may cause lowering of PLTP mass in the circulation. The negative correlation between plasma triglycerides and HDL level has been suggested to be due to increase in cholesterol ester-triacylglycerol exchange between VLDL and HDL by CETP [35,36]. This exchange is considered to in-crease the susceptibility of HDL2 to the action of hepatic lipase and, consequently, to accelerate the con-version of HDL2 to small size HDL3 resulting in an overall drop in HDL levels [37,38]. The in vitro studies by Clay et al. [39] have demonstrated that triacylglyc-erol enrichment of HDL causes a marked loss of apoA-I from the HDL fraction when it is incubated with hepatic lipase (HL). On the other hand, in the study by Speijer et al. [40] human plasma was fractionated by gel filtration and phospholipid transfer activity co-eluted with the HDL2 subfraction. These data, together with the present results, suggest that plasma PLTP levels are reduced concomitantly with a decrease in HDL2.
As compared to lecithin-cholesterol acyltransferase (LCAT) [41] and CETP [42 – 44], whose specific activity in the circulation appears to be relatively constant, the marked differences observed in the specific activity of
Table 2
The mean values of selected characteristics and Pearson correlation coefficients between them and phospholipid transfer activity, mass and specific activity
Mean9S.D.,n=159 Correlation coefficients Characteristics
PL-transfer activitya 5.3991.85 1.000 –
−0.578 B0.001 –
PLTP mass, mg/l 15.695.1 0.060 0.453 1.000
−0.578 B0.001 1.000
Specific act., act./mass 0.3690.22 0.621 B0.001 –
0.236 0.358
Age, years 42.1911.2 0.639 B0.001 0.095 B0.001
B0.001 0.447
−0.281
BMI, kg/m2 25.494.4 0.405 B0.001 B0.001
0.516 0.421
Cholesterol, mmol/l 5.4891.06 0.483 B0.001 −0.052 B0.001
B0.001 0.568
B0.001 Triglycerides, mmol/l 1.4690.99 0.540 B0.001 −0.340
−0.060 0.452 0.341
LDL-C, mmol/l 3.4690.96 0.398 B0.001 B0.001
B0.001 0.451
ApoB, g/l 0.9790.27 0.493 B0.001 −0.143 0.071
0.374 B0.001 −0.141
ApoA-I, g/l 1.4090.24 0.017 0.830 0.077
0.012 −0.022
ApoA-II, g/l 0.4090.11 0.173 0.029 0.198 0.784
−0.332
B0.001 B0.001
HDL-C, mmol/l 1.4090.35 −0.246 0.002 0.358
−0.492 B0.001 HDL-C/total-C 0.2690.076 −0.485 B0.001 0.291 B0.001
0.007
Gamma-GT, U/l 28.4932.6 0.351 B0.001 B0.001
Fig. 4. Effect of serum triacylglycerol levels on the correlation between plasma phospholipid transfer activity and mass among 159 study subjects. Panel A: the PLTP mass in the study population plotted against the phospholipid transfer activity (unadjusted values). Panel B: correlation between phospholipid transfer activity and mass values normalized for the plasma triacylglycerol concentrations.
PLTP between subjects are highly interesting and most probably of physiological importance. The reason for this TG-dependent variation in PLTP specific activity is at present not known, but it may involve changes in the association of PLTP with specific lipoprotein subfrac-tions, leading to potentiation of the phospholipid trans-fer activity. For instance, increased TG content in HDL core may cause the release of PLTP from particle
Fig. 5. Effect of triacylglycerol concentration on performance of the phospholipid transfer and PLTP mass assays. Purified VLDL was added in different amounts to a normolipidemic plasma specimen, followed by a 15-min preincubation at room temperature. There-after, the phospholipid transfer activity (panel A) and PLTP mass (panel B) of the plasma were determined as specified in Section 2. The x-axis displays the final TG concentration. The activity and mass values iny-axis (mean9S.D.,n=3) are given in %, the 100% values corresponding to 4800 nmol phospholipid transferred/ml per h and 10.2mg PLTP/ml measured for the specimen without VLDL addition.
References
[1] Gordon DJ, Rifkind BM. High density lipoprotein — the clinical implications of recent studies. N Engl J Med 1989;321:1311 – 6.
[2] Navab M, Hama SY, Hough GB, Hedrick CC, Sorensen R, La Du BN, et al. High density lipoprotein associated enzymes: their role in vascular biology. Curr Opin Lipidol 1998;9:449 – 56. [3] Tollefson JH, Liu A, Albers JJ. Isolation and characterization of
a phospholipid transfer protein (LTP-II) from human plasma. J Lipid Res 1988;29:1593 – 602.
[4] Damen J, Regts J, Scherphof G. Transfer of [14C]phosphatidylcholine between liposomes and human plasma
high density lipoprotein. Partial purification of a transfer-stimu-lating plasma factor using a rapid transfer assay. Biochim Bio-phys Acta 1982;712:444 – 52.
[5] Jauhiainen M, Metso J, Pahlman R, Blomqvist S, van Tol A, Ehnholm C. Human plasma phospholipid transfer protein causes high density lipoprotein conversion. J Biol Chem 1993;268:4032 – 6.
[6] Tu A-Y, Nishida HI, Nishida T. High density lipoprotein con-version mediated by human plasma phospholipid transfer protein. J Biol Chem 1993;268:23098 – 105.
[7] Albers JJ, Tu A-Y, Paigen B, Chen H, Cheung MC, Marcovina SM. Transgenic mice expressing human phospholipid transfer protein have increased HDL/non-HDL cholesterol ratio. Int J Clin Lab Res 1996;26:262 – 7.
[8] Jiang X-C, Francone O, Bruce C, Milne R, Mar J, Walsh A, et al. Increased preb-high density lipoprotein, apolipoprotein A-I, and phospholipid in mice expressing the human phospholipid transfer protein and human apolipoprotein A-I transgenes. J Clin Invest 1996;96:2373 – 80.
[9] Fo¨ger B, Santamarina-Fojo S, Shamburek RD, Parrot CL, Talley GD, Brewer HB Jr. Plasma phospholipid transfer protein-adenovirus-mediated overexpression in mice leads to decreased plasma high density lipoprotein (HDL) and enhanced hepatic uptake of phospholipids and cholesteryl esters from HDL. J Biol Chem 1997;272:27393 – 400.
[10] Ehnholm S, van Dijk W, van’t Hof B, van der Zee A, Olkkonen VM, Jauhiainen M, et al. Adenovirus mediated overexpression of human phospholipid transfer protein alters plasma HDL levels in mice. J Lipid Res 1998;39:1248 – 53.
[11] Riemens SC, van Tol A, Sluiter WJ, Dullaart RPF. Plasma phospholipid transfer protein activity is related to insulin resis-tance and altered free fatty acid and triglycerides: impaired acute lowering by insulin in obese type II diabetic patients. Diabetolo-gia 1998;41:929 – 34.
[12] Jiang X-C, D’Armiento J, Mallampalli RK, Mar J, Yan S-F, Lin M. Expression of plasma phospholipid transfer protein mRNA in normal and emphysematous lungs and regulation by hypoxia. J Biol Chem 1998;273:15714 – 8.
[13] Lagrost L, Athias A, Herbeth B, Guyard-Dangremont V, Artur Y, Paille F, et al. Opposite effects of cholesteryl ester transfer protein and phospholipid transfer protein on the size distribution of plasma high density lipoproteins. Physiological relevance in alcoholic patients. J Biol Chem 1996;271:19058 – 65.
[14] Jiang X, Bruce C. Regulation of murine plasma phospholipid transfer protein activity and mRNA levels by lipopolysaccharide and high cholesterol diet. J Biol Chem 1995;270:17133 – 8. [15] Yu B, Hailman E, Wright SD. Lipopolysaccharide binding
protein and soluble CD14 catalyze exchange of phospholipids. J Clin Invest 1997;99:315 – 24.
[16] Lagrost L, Athias A, Gambert P, Lallemant C. Comparative study of phospholipid transfer activities mediated by cholesteryl ester transfer protein and phospholipid transfer protein. J Lipid Res 1994;35:825 – 35.
Acknowledgements
[17] Havel RJ, Eder HA, Bragdon JR. The distribution and chemi-cal composition of ultracentrifugally separated lipoproteins in human plasma. J Clin Invest 1955;34:1345 – 53.
[18] Ohnishi T, Yokoyama S, Yamamoto A. Rapid purification of human plasma lipid transfer proteins. J Lipid Res 1990;31:397 – 406.
[19] Lowry OH, Rosebrough NJ, Farr AL, Randall RJ. Protein measurement with the Folin phenol reagent. J Biol Chem 1951;193:265 – 75.
[20] Tahvanainen E, Jauhiainen M, Funke H, Vartiainen E, Sund-vall J, Ehnholm C. Serum phospholipid transfer protein activity and genetic variation of the PLTP gene. Atherosclerosis 1999;146:107 – 16.
[21] Lin K-H, Cheng S-Y. An efficient method to purify active eu-karyotic proteins from the inclusion bodies in Escherichia coli. Biotechniques 1991;11:748 – 51.
[22] Gefter ML, Margulies DH, Scharff MD. A simple method for polyethylene glycol promoted hybridization of mouse myeloma cells. Somatic Cell Genet 1977;3:231 – 6.
[23] Ko¨hler G, Howe SC, Milstein C. Fusion between immunoglob-ulin-secreting and non-secreting myeloma cell lines. Eur J Im-munol 1976;6:292 – 5.
[24] Ro¨schlau P, Bernt E, Gruber W. Enzymatische bestimmung des gesamtcholesterins im serum. Z Klin Chem Klin Biochem 1974;12:226 – 30.
[25] Wahlefeld AW. Triglycerides: determination after enzymatic hy-drolysis. In: Bergmeyer HU, editor. Methods of Enzymatic Analysis. New York: Academic Press, 1974:18 – 31.
[26] Riepponen P, Marniemi J, Rautaoja T. Determination of apolipoproteins A-I and B in serum. Scand J Clin Lab Invest 1987;47:739 – 44.
[27] Friedewald WT, Levy RI, Fredrickson DS. Estimation of the concentration of low-density lipoprotein cholesterol in plasma without use of the preparative ultracentrifuge. Clin Chem 1972;18:499 – 502.
[28] Vartiainen E, Puska P, Jousilahti P, Korhonen HJ, Tuomilehto J, Nissinen A. Twenty-year trends in coronary risk factors in North Karelia and in other areas of Finland. Int J Epidemiol 1994;23:495 – 504.
[29] Huuskonen J, Jauhiainen M, Ehnholm C, Olkkonen VM. Biosynthesis and secretion of human plasma phospholipid transfer protein. J Lipid Res 1998;39:2021 – 30.
[30] Huuskonen J, Wohlfahrt G, Jauhiainen M, Ehnholm C, Tele-man O, Olkkonen VM. Structure and phospholipid transfer ac-tivity of human PLTP: analysis by molecular modelling and site-directed mutagenesis. J Lipid Res 1999;40:1123 – 30. [31] Desrumaux C, Athias A, Bessede G, Verges B, Farnier M,
Persegol L, et al. Mass concentration of plasma phospholipid transfer protein in normolipidemic, type IIa hyperlipidemic, type IIb hyperlipidemic, and non-insulin-dependent diabetic subjects as measured by a specific ELISA. Arterioscler Thromb Vasc Biol 1999;19:266 – 75.
[32] Jiang X-C, Bruce C, Mar J, Lin M, Ji Y, Francone OL, et al. Targeted mutation of plasma phospholipid transfer protein gene markedly reduces high-density lipoprotein levels. J Clin Invest 1999;103:907 – 14.
[33] Van Tol A, Ligtenberg JJM, Riemens SC, van Haeften TW, Reitsma WD, Dullaart RPF. Lowering of plasma phospholipid transfer protein activity by acute hyperglycaemia-induced hyper-insulinaemia in healthy men. Scand J Clin Lab Invest 1997;57:147 – 58.
[34] Rye K-A, Jauhiainen M, Barter PJ, Ehnholm C. Triglyceride-enrichment of high density lipoproteins enhances their remod-elling by phospholipid transfer protein. J Lipid Res 1998;39:613 – 22.
[35] Albers JJ, Tollefson JH, Chen C-H, Steinmetz A. Isolation and characterization of human plasma lipid transfer proteins. Arte-riosclerosis 1984;4:49 – 58.
[36] Tall A. Plasma lipid transfer proteins. Annu Rev Biochem 1995;64:235 – 57.
[37] Patsch JR, Prasad S, Gotto AM Jr., Bengtsson-Olivecrona G. Postprandial lipemia. A key for the conversion of high density lipoprotein2 into high density lipoprotein3 by hepatic lipase. J
Clin Invest 1984;74:2017 – 23.
[38] Patsch JR, Prasad S, Gotto AM Jr., Patsch W. High density lipoprotein2: relationship of the plasma levels of this lipoprotein
species to its composition, to the magnitude of postprandial lipemia, and to the activities of lipoprotein lipase and hepatic lipase. J Clin Invest 1987;80:341 – 7.
[39] Clay MA, Newnham HH, Barter PJ. Hepatic lipase promotes a loss of apolipoprotein A-I from triglyceride-enriched human high density lipoproteins during incubation in vitro. Arterioscler Thromb 1991;11:415 – 22.
[40] Speijer H, Groener JEM, van Ramhorst E, van Tol A. Different locations of cholesteryl ester transfer protein and phospholipid transfer protein activities in plasma. Atherosclerosis 1991;90:159 – 68.
[41] Albers JJ, Chen CH, Adolphson JL. Lecithin-cholesterol acyl-transferase (LCAT) mass; its relationship to LCAT activity and cholesterol esterification rate. J Lipid Res 1991;22:1206 – 13.
[42] Marcel YL, McPherson R, Hogue M, Czarnecka H, Zawadzki Z, Weech PK, et al. Distribution and concentration of cholesteryl ester transfer protein in plasma of normolipemic subjects. J Clin Invest 1990;85:10 – 7.
[43] McPherson R, Mann CJ, Tall AR, Hogue M, Martin L, Milne RW, et al. Plasma concentrations of cholesteryl ester transfer protein in hyperlipoproteinemia. Arterioscler Thromb 1991;11:797 – 804.
[44] Clark RW, Moberly JB, Bamberger MJ. Low level quantifica-tion of cholesteryl ester transfer protein in plasma subfracquantifica-tions and cell culture media by monoclonal antibody-based im-munoassay. J Lipid Res 1995;36:876 – 89.