Structure Pattern of Volcanic Degradation Landform
of Citarik Sub-Catchment Based on Lineaments
And Drainage Basin Morphometric
By:Edi Tri Haryanto, Adi Hardiyono, Iyan Haryanto, Undang Mardiana
Faculty of Engineering Geology, Padjadjaran University. Jln. Raya Bandung-Sumedang Km 21, Jatinangor Telp./Fax. (022) 7796545 Kode Pos 45363, e-mail : [email protected]
Website :http://ftgeologi.unpad.ac.id
ABSTRACT
Citarik Catchment Area, one of the main sub-catchments of Upper Citarum River Basin, found not any line structural symbol on geological maps, although some indications i.e, drainage pattern from topographical maps and linements of mountain ridges and valley based on DEM depicted clearly. Therefore the initial study to uderstand the tectonic venomena through the analysis of structure pattern, based on chatchments morphometric data and lineaments generated from Topographic Map and DEM of Global Mapper Open sources data and fieldwork has been conducted . The results could be inferred that the first order stream has three different dominant which is trending NW-SE, NNE-SSWand NE-SW, WE. The second order lineaments which still in line with the first orde catchments seems that the existence has been controlled beside by joint structure, has also been influenced directly by fault structures. Based on third order lineament, the main stress direction can generate patterns of E-W trending structure with a type of thrust fault and a normal fault, whereas the NW-SE direction and a NE-SW forming ahorizontal fault. Fault structure with a N-S direction are generally normal fault type.
Keywords : catchment- order, volcanic-degradation-landform, structure-pattern.
I. Introduction
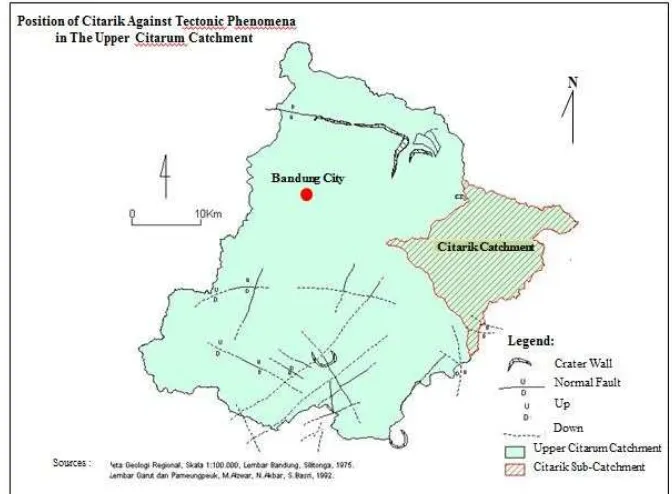
Based on Regional Geological Map of Bandung and other adjacent sheets, there are many tectonic activities indicated by line faults symbols spread out the area of Upper Citarum River Basin or popularly mentioned as “Bandung Basin” or “Cekungan Bandung”( figure 1). The most popular fault among the local geologists in this area is Lembang Fault located in the north of Bandung City, and many others fault based on map scattered from the west to the southeastern part of the southern slope of Bandung Basin. Curiously, there was not found any fault line symbols in the map in Citarik Catchment Area one of the main sub-catchments of Upper Citarum River Basin, , although some indications i.e, drainage pattern from topographical maps and linements of mountains ridges and valley based on DEM from Global Mapper data depicted clear enough.
Joints have a close connection with the tectonic structure (Harding, T. P. 1974). Joint is defined as fractures with little or no a shift ; shifting of joint structure generaly can only be observed under a microscope (Ramsay, 1987), meaning that megaskopis difficult to observe a
shift (Billing, 1972). Rock cracks or joints can be influenced by either fault structures or master joints. Stream can be ascertained controlled by joints system. Therefore the initial study based on analyzing drainage basin lineaments of Citarik Sub-catchments from maps and field work was conducted.
Figure 1. Tectonic Setting of Citarik Catchment Area in the Upper Citarum Catchment Area or River Basin
II. Objectives
The objectives of study were to understand general structure pattern and tectonic fenomena on Volcanic Fluvial Degradation Landform of Citarik Sub-Catchment using characteristic of river catchments morphometric and lineaments analysis approach.
III. Methodology
Methodology used to analyse structure pattern of Volcanic Degradation Landform of Citarik Sub-Catchment were mainly Geographical Information System (GIS) techniques. For obtaining basin morphometric data and lineaments measured from digital topographic maps and Digital Elevation Model (DEM) from open sources Global Mapper programs. Constructing Rossette and Pole Diagram for analyzing joints direction, and fieldwork for obtaining joints data in the field.
IV. Location
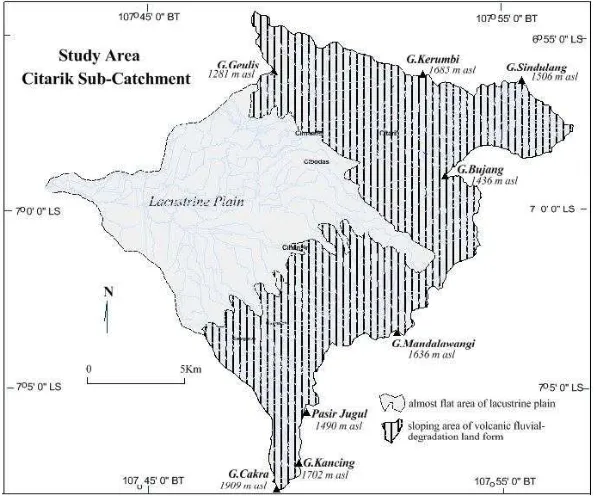
Citarik Catchment Area are located in the most eastern part of Upper Citarum Catchment. It has an area of about 265 sq km, geographicaly spreaded between longitude 107o42’7”E and
area is about 25 km to the east direction. The study area is included in the district of Sumedang and Bandung, West-Java Province and the analysis was concentrated in slope zone of volcanic fluvial degradation landform of Upper Citarum Catchment Area. Topographic situation of the area is pressented in figure 2.
Figure 2. Topographic situation of study area
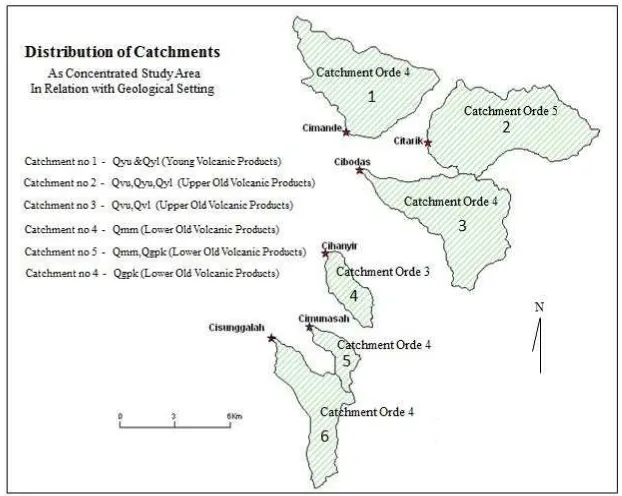
Based on Regional Geological Map, scale of 1 to 100,000 Bandung sheet (Silitonga, 1975), Garut and Pameumpeuk sheets (Alzwar et. al, 1992) belonged to geologic formation of : plain of lacustrine deposit and sloping area insisted by several valleys/basins of volcanic fluvial degradation land form consisting of the Young and the Old Undifferentiated Volcanic Product (figure 3).
Study area concentrated was analysis in some catchments area in relation with geological setting. Based on Strahler’s river ordering system, there were 6 (six) catchments consisting of 1 (one) of five order catchment and 5 (five) of fore order catchments(figure 4).
Figure 4. Distribution of Catchments as Concentrated Study Area in relation with Geological Setting
V. Result of Study
5.1. Catchment Areal Morphometry and lineaments
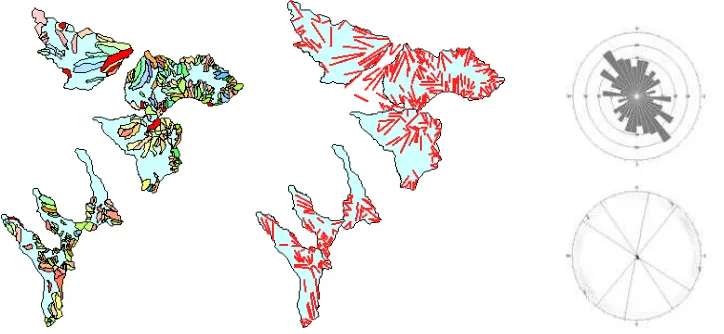
Figure 5. Delineated first order Catchments on the left, lineaments of first orde catchments in the middle, and dominance of lineaments directions on the right.
Figure 6. Delineated second order Catchments on the left, lineaments of second order in the middle, and dominance of lineaments directions of second order on the right .
5.2. Regional Tectonic Analysis
Bandung Basin is inter-mountane basin because of its location lies between the volcanoes, a structural formations such as depression, surrounded by a height of Quaternary volcanoes. Tectonic background that controls the formation of the basin, initiated by compressional tectonic structures that produce fold thrust belt at the Tertiary sedimentary rocks are now the position covered by quarternary volcanic materials(Haryanto, 2014). This tectonic activity peaked in the Late Tertiary (Martodjojo, 1984). As a result of these events, Bandung and surrounding areas become the top of the Java geantiklin zone. After the compression forces on the island of Java gradually diminish, as the equilibrium compensation formation of a number of normal faults or depression occurred. In the geometry of the structural formations named as antiklinal collapse basin, under the influence of extensional tectonics. In line with the on going extensional tectonic, volcanic activities also takes place that happens on a large scale, so that by the time it generated a lot of volcanic material and most of Tertiary sedimentary rocks covered by these volvanic materials.
In Bandung and the surrounding area, some of the existence of an ancient volcanic eruption centers form one lane lineaments with the northeast-southwest direction, so that the inferred its presence controlled by fault structures (Figure 8). Straightness of the structure in this region, also occurs in the vocanic material. This shows tectonic activity continued until the End of Pleistocene, even supposedly still active until now.
In general, based on regional geological structure, the Bandung area is surrounded by a regional fault, which is in the northern part traversed by Cimandiri and Lembang Fault, in the east by Citanduy Fault and in the south by Jampang Fault (figure 8). Throughout the regional fault, indirectly affect the geological conditions in Bandung and the surrounding area. From the analysis of DEM and field trips, the structural lineaments is not only known caused by a fault structure. Some lineament structures in the study area cut young volcanic rocks (field data figure 9), thus affecting the shape of the topography and drainage patterns. Theoretically joints structure can reach hundreds of meters, and can affect the landform.
Drainage pattern and catchments direction can be used as guidance existence of fault structures and joints structures, because both the geological structure is weak zone / destroyed that easily weathered and eroded by flowing water. In a relatively long time, the crack area as a forerunner to the formation of river channel. On the basis of this concept, the determination of local structural lineaments can be done based on interpretation of river catchments pattern or catchments direction, as depicted in above figure 5,6,and 7 .
Drainage pattern in the area of young volcanic are generaly radier, this indicates the drainage pattern is not only controlled by the structure of the cracks, but is also influenced by the geometry of a volvano that is conical shaped.
Figure 8. Lane lineaments that form ancient volcanic eruption centers in Bandung and the surrounding area (Katili and Sudradjat, 1984, modified).
5.3. Discussion
First Order catchments
The first order catctments in the figure 5 above has the largest frequency compare with other river or catchments order and has a range direction. Associated with the pattern of structural lineaments in Figure 2 (second order), lineaments of first order seems to be part of the structural lineament direction of north-south, northwest-southeast and northeast-southwest. In rosette diagram of first order catchments, the dominant direction of the lineaments trending northwest-southeast. Through the polar diagram known that maxima point were spread, but the maxima biggest point still distinguishable, which is trending northwest-southeast (NW-SE), north northeast-south southwest (NNE-SSW), northeast-southwest (NE-SW) and west-east (WE). By compiling rosette and polar diagrams, it could be inferred that the first order stream has three different dominant directions as above.
Rock cracks or joints influenced either by the fault structures and the master joint, may be followed by secondary cracks (smaller size) that its formation can occur simultaneously. On the basis of dimension (length) first order stream can be ascertained the river was controlled by joint system.
Second order catchments
Lineaments according to the second order catchment has a smaller frequency, but still has a direction as diverse as the first order. However, based on the diagram Rosset and the size of its length which shows the consistency of the direction and the magnitude, then the existence of second order seems to had been controlled beside by joint structure, had also been influenced directly by fault structures. In Figure 6, the alignment of the structure have the same direction relative to the lineaments of the catchments as depicted in the diagram rosette and polar diagrams.
Third order catchments
Based on rosette and polar diagram, known that the frequency and direction of lineaments more influenced by the fault structure trending northwest-southeast. Structural lineaments with these direction were possibly a reactivation of an old fault that developed in Tertiary sedimentary rocks. Regionally, the pattern of faults that developed in West Java, influenced by the stress system trending north-south compression. By using the concept of triaxial stress, the main stress direction can generate patterns of east-west trending structure with a type of thrust fault and a normal fault, whereas the northwest-southeast direction and a northeast-southwest forming a horizontal fault. Fault structure with a north-south direction are generally normal fault type.
associated with the faulting proccess, the fault is to be oblique(normal horizontal) or as a pure normal fault.
VI. Conclusion
The dominant direction of the lineaments of first orde river or catchments trending northwest-southeast. Through the polar diagram shows that maxima point were spread, but the maxima biggest point still distinguishable, which is trending northwest-southeast (NW-SE), north northeast-south southwest (NNE-SSW), northeast-southwest (NE-SW) and west-east (WE). Then it could be inferred that the first order stream has three different dominant directions as shown above.
Based on the directions of lineaments which still in line with the first orde catchments directions and with magnitude or the length increase, so it seems that the existence of second order catchments has been controlled beside by joint structure, has also been influenced directly by fault structures.
Using the concept of triaxial stress, the main stress direction can generate patterns of east-west trending structure with a type of thrust fault and a normal fault, whereas the northeast-west- northwest-southeast direction and a northeast-southwest forming a horizontal fault. Fault structure with a north-south direction are generally normal fault type. Barat (1208-6), Skala 1 : 250.000. Pusat Penelitian dan Pengembangan Geologi, Bandung.
Billing, M.P., 1990. Structure Geology. Prentice Hall of India, Private Ltd, New Delhi.
Chorley, R.J., 1969. Introduction to Physical Hydrology. Printed in Great Britain by Richard Clay (The Chaucer Press), Ltd Bungay Sulffolk SBN 416 68810 I.
Chorley, R.J., 1969. Introduction to Fluvial Processes. Printed in Great Britain by Richard Clay (The Chaucer Press), Ltd Bungay Sulffolk SBN 416 68820 I.
Harding, T. P. 1974. Petroleum traps associated with wrench faults, American Association of Petroleum Geologists (AAPG) Bulletin, vol. 58, no. 7, p. 1290-1304.
Haryanto, I., 2014. Evolusi Tektonik Pulau Jawa Bagian Barat Selama Kurun Waktu Kenozoikum. Disertasi UNPAD tidak dipublikasi.
Martodjojo, S. 1984. Evolusi Cekungan Bogor, Jawa Barat. Fakultas Teknik Geologi Institut Teknologi Bandung.
Ramsay, J.G., 1987. The Techniques of Modern Structural Geology. Vol.2. Fold and Fracture. Academic Press Limited. London.