THE EFFECTS OF STUDENT TEAM-ACHIEVEMENT DIVISION COOPERATIVE LEARNING AND DIRECT INSTRUCTION ON
STUDENTS’ READING COMPREHENSION LEVELS
(A Mixed Method Study at Grade VIII of a Junior High School in Serang, Banten)
Thesis
Submitted in Partial Fulfillment of the Requirements for Master’s Degree in English Education
By
Asep Suarman
1007015
GRADUATE SCHOOL
INDONESIA UNIVERSITY OF EDUCATION
APPROVAL PAGE
This thesis entitled “THE EFFECTS OF STUDENT TEAM-ACHIEVEMENT
DIVISION COOPERATIVE LEARNING AND DIRECT INSTRUCTION ON STUDENTS’ READING COMPREHENSION LEVELS(A Mixed Method Study at Grade VIII of a Junior High School in Serang, Banten) has been approved by:
Supervisor
Emi Emilia, M, Ed., Ph. D. NIP. 196609161990012000
Head of English Education Study Program,
DECLARATION
I hereby certify that this thesis entitled,” The Effects of Student Team-Achievement
Division Cooperative Learning and Direct Instruction on Students’ Reading Comprehension Levels”, is completely my own work. I am fully aware that I have quoted and paraphrased some statements and ideas from other resources, and they are properly
acknowledged in the text.
Bandung, February, 2013
THE EFFECTS OF STUDENT TEAM-ACHIEVEMENT DIVISION
COOPERATIVE LEARNING AND DIRECT INSTRUCTION ON STUDENTS’
READING COMPREHENSION LEVELS
Asep Suarman 1007015
ABSTRACT
TABLE OF CONTENTS
TITLE SHEET ... i
APPROVAL SHEET ... ii
ABSTRACT ... iii
DECLARATION ... iv
ACKNOWLEDGMENTS ... v
TABLE OF CONTENTS ... vi
LIST OF TABLES ... ix
LIST OF CHARTS ... x
LIST OF APPENDICES ... xi
CHAPTER I: INTRODUCTION 1.1 Background of the Study ... 1
1.2 Purpose of the Study ... 3
1.3 Research Question ... 3
1.4 Definition of the Terms ... 3
1.5 Significance of the Study ... 4
1.6 Structure of the Thesis ... 5
CHAPTER II: REVIEW OF THE LITERATURE 2.1 Reading Comprehension ... 6
2.1.1 Definitions of Reading Comprehension ... 6
2.1.2 Reading Comprehension Factors ... 8
2.1.3 Interactive Model or Approach of Reading Process ... 8
2.1.4 Reading Comprehension Levels ... 10
2.1.5 Reading Comprehension Skills ... 12
2.1.6 Teaching Reading Comprehension ... 15
2.1.7 Assessing Reading ... 18
2.2 Student Team Achievement Division (STAD) Cooperative Learning 19 2.2.1 Overview of Cooperative Learning ... 19
2.2.2 Principles of STAD CL ... 22
2.2.3 Procedures of STAD CL ... 23
2.2.4 Weaknesses of STAD CL ... 26
2.2.1 Definition of Direct Instruction ... 27
2.2.2 Principles of Direct Instruction ... 29
2.2.3 Procedures of Direct Instruction ... 30
2.2.4 Weaknesses of Direct Instruction... 32
2.4 Previous Study ... 33
2.5 Conclusion of the Chapter ... 34
CHAPTER III: RESEARCH METHODOLOGY 3.1 Research Setting and Participants ... 35
3.2 Research Design ... 36
3.3 Data Collection Methods ... 37
3.4.1 Pretest and Post Test of Reading Comprehension ... 37
3.4.2 Class Observation ... 39
3.4.3 Questionnaire ... 39
3.4.4 Interview ... 41
3.4 Data Analysis ... 42
3.4.1 Pretest and Post Test ... 42
3.4.2 Class Observation ... 43
3.4.3 Questionnaire ... 43
3.4.4 Interview ... 44
3.6 Conclusion of the Chapter ... 44
CHAPTER IV TEACHING PROGRAMS 4.1 Phases of Study ... 45
4.2 Preliminary Phase ... 46
4.2.1 Searching for Teaching Materials ... 46
4.2.2 Trying Out the Pretest and Posttest Items ... 50
4.2.3 Administering Pretest ... 51
4.2.4 Inducting the Teaching Programs ... 53
4.3 Teaching Programs ... 54
4.3.1 Preparation (Before Instruction) ... 55
4.3.2Pre-Reading ... 55
4.3.3 While Reading ... 57
4.4 Post Teaching Phase ... 66
4.5 Conclusion of the Chapter ... 66
CHAPTER V: FINDINGS AND DISCUSSION OF DATA FROM TESTS, QUESTIONNAIRE AND INTERVIEW 5.1 Data from Tests……… 69
5.1.1 The Effect of the Teaching Programs on Reading Comprehension.. 69
5.1.2 The Effect of the Teaching Programs on Literal Comprehension Levels…..……… 72
5.1.3 The Effect of the Teaching Programs on Inferential Comprehension Levels……… 75
5.1.4 The Effect of the Teaching Programs on Evaluative Comprehension Levels……… 79
5.1.5 Summary of Discussion of Data from Tests ……… 82
5.2. Data from Questionnaire ……… 85
5.2.1 The Effect of STAD CL or DI on the Students’ Literal Comprehension Levels……….. 85
5.2.2 The Effect of STAD CL or DI on the Students’ Inferential Comprehension Level …….……….. 90
5.2.3 The Effect of STAD CL or DI on the Students’ Evaluative Comprehension Level……….. . 93
5.2.4 Summary of Discussion of Data from Questionnaire ……….. 97
5.3 Data from Interview……….. 99
5.3.1 The Students’ Responses toward STAD CL and DI……… 99
5.3.2 The Effect of STAD CL and DI on Literal Comprehension Level… 103 5.3.3 The Effect of STAD CL and DI on Inferential Comprehension ……105 5.3.4 The Effect of STAD CL and DI on Evaluative Comprehension ……108
5.3.5 Summary of Discussion of Data from Interview ………. 112
5.4 Conclusion of the Chapter ………
112
CHAPTER VI: THE CONCLUSION, LIMITATIONS AND IDEAS OF FUTURE RESEARCH 6.1 Conclusion ………. 113
6.2 Limitation of the Study………... 116
6.3 Ideas for Future Research .………. 118
BIBLIOGRAPHY ……….. 119
LIST OF TABLES
Table 2.1: Comprehension Levels and Skills ……… 14
Table 3.2: Research Design ……… 37
Table 4.3: The Phases of the Teaching Programs ………... 45
Table 4.4: Texts in the Teaching Programs ………. 47
Table 4.5: The Investigated Comprehension Levels and Skills ………... 49
Table 4.6: The Result of ANATESV.4 Analysis on the Try-Out Version of Both Pretest and Post Items ……… 50
Table 4.7: Descriptive Statistics of the Result of Pre-Test ……… 51
Table 4.8: Independent Samples Test of Pretest Scores of Class A, B and D …. 52 Table 4.9: The Mean Score of Quizzes ……… 64
Table 4.10: The Comparison of the Teaching programs ……… 66
Table 5.11: Descriptive Statistics of Reading Comprehension Post Test Scores of both STAD CL and DI Groups ……… 69
Table 5.12: Independent Samples t-Test of the Reading Comprehension Scores of STAD CL and DI Groups ………. 71
Table 5.13: Descriptive Statistics of the Pretest and Posttest Scores on Literal Comprehension Level of STAD CL and DI Groups ………. 72
Table 5.14: Independent Samples t-Test of the Pretest and Post Test Scores on Literal Comprehension Level between STAD CL and DI Groups………. 74
Table 5.15: Descriptive Statistics of the Pretest and Posttest Scores on Inferential Comprehension Level of STAD CL and DI Groups ……… 75
Table 5.16: Independent Samples t-Test of the Pretest Scores on Inferential Comprehension Level between STAD CL and DI Groups ..… 77
Table 5.17: Descriptive Statistics of the Pretest and Posttest Scores on Evaluative Comprehension Level of STAD CL and DI Groups ………... 79
Table 5.18: Independent Samples t-Test of the Pretest and the Post Test Scores on Evaluative Comprehension Level between STAD CL and DI Groups …... 81
Table 5.19: The Comparison of Questionnaire Response between STAD CL and DI Groups on Literal Comprehension ……… 86
Table 5.20: The Comparison of Questionnaire Responses between STAD CL and DI Groups on Inferential Comprehension ……… 91
List of Charts
Chart 4.1: The Comparison of the Mean Scores and the Standard Deviation
between STAD CL and DI groups ………. 65
Chart 5.2 The Tendency of Mean Score of All Comprehension Levels ………… 82
List of Appendices
1. a. The Items of Pre-Test (Try-Out Version) b. The Items of Pre-Test (Pre-test Version) 2. a. The Items of Post-Test (Try-Out Version)
b. The Items of Post-Test (Pre-test Version) 3. a. An Example of Quiz Items
b. ANATES V.4 Analysis on Quiz #3
4. a. Observation Guidelines in STAD CL Group b. Observation Guidelines of DI Group
5. a. Condensed Observation Field note in the STAD CL Group b. Condensed Observation Field note in the DI Group
6. a. Questionnaire for STAD CL Group (not random) b. Questionnaire for DI Group (not random)
c. Questionnaire In Bahasa Indonesia for STAD CL Group (Random ) d. Questionnaire In Bahasa Indonesia for DI Group (Random )
7. The Microsoft Excel Analysis on the Result of Questionnaire Try Out. 8. a. STAD CL group Interview Guidelines
b. DI group Interview Guidelines
9. a. The Result of Questionnaire in STAD CL Group b. The Result of Questionnaire in DI Group
10.Reading texts for the Teaching Programs
11.a. An Example of Lesson Plans for STAD CL Group b. An Example of Lesson Plans for DI Group
12.a. ANATES V.4 Analysis on Pretest Items (Try-Out Version). b. ANATES V.4 Analysis on Post Test Items (Try-Out Version). 13.a. The Mark list of DI group
b. The Quiz Score Sheet of STAD CL group c. The Team Summary Sheet of STAD CL group 14.a. The Example of Certificate of Super Team
b. The Example of Certificate of The Best Student
15.a. The Comparison of Pretest and Post Test Scores on Literal Comprehension b. The Comparison of Pretest and Post Test Scores on Inferential Comprehension c. The Comparison of Pretest and Post Test Scores on Evaluative Comprehension 16. a. Condensed Version of Data from STAD CL group Interview
CHAPTER I: INTRODUCTION
This introductory chapter discusses the background and states the purposes of the
study and research questions. It further describes the significance of the study. Finally, it
outlines the structure of this thesis as a whole.
1.1 Background of the Study
Reading is a very important skill for both our life in general and language
learning in particular. For our life, it enables us to access written worlds of ideas (Hood et
al. 1996 p. 33), feelings as well as knowledge of the ages and vision of the future
(Alderson, 2000, p. x). It also facilitates us to gain access to science in various field of
study and to sense others’ feeling, attitude or behavior and to know what happened in the
past or what may happen in the future. For language learning, it can improve other general
language skills and help to think in the target language, enlarge vocabulary and improve
writing skill (Mikulecky and Jeffries, 1996 p. 1).
The importance of reading can be seen from the fact that the main part of national
examination in junior and senior high schools was to do with reading skill. It is to measure
students’ reading competence as being targeted by the national content standard (see
Depdiknas, 2005).
Various questions on English national exam are intended to assess students’
reading comprehension. The questions commonly deal with assessing the students’ skills
in getting explicit and implicit information, guessing words/phrase/clause meaning in
context, identifying main idea, communicative purpose of the text and the coda from a
story (BSNP, 2011; Hood et al. 1996 p. 44, see also Depdiknas, 2011). Such questions
basically are to inspect the students’ understanding or comprehension as a reflection of
their mind (Dorn and Soffos, 2005 p.2) after reading; as the essential goal (Brassell and
Rasinski 2008, p. 11) and as the product of reading (Alderson, 2000 p.5). Thus, the
difference of students’ comprehension levels is hopefully revealed through such questions. Some theorists assert that comprehension has some levels. Some academics
applied/assimilative/critical/evaluative levels (Heilman, 1961; Alexander, 1989 p. 125;
Muhamad, 1999; Alderson, 2000; Berry, 2005; Brasell & Rasinski, 2008 p. 17; Cuesta
College, 2011; see also Gunning, 2010). Others add two other levels: reorganization and
appreciation comprehension levels (Clymer 1968 in Pettit and Cockriel, 1974; Burnes,
1985 in Setiadi, 2010 p. 92; Brown, 1995; RIC Publication Staff, 1996; Snow, 2003;
Briskin, 2005). These levels of comprehension vary among readers.
Teaching reading comprehension levels with their own strategies or skills is quite
demanding for English teachers. Although comprehension can be taught directly (Fielding
and Pearson, 1994), its teaching requires teachers to be well-informed, creative, and
innovative (Depdiknas, 2007) about theories, approaches, methods, models, media or
findings. On the top of that, the teachers are required to have opportunities to experiment
the various approaches, models or methods (Arends and Kilcher, 2010).
Two of the models to teach reading are Student Teams-Achievement Division as
a cooperative learning (STAD CL) model (Slavin, 1989; 1995) and Direct Instruction (DI)
as a competitive model (Adams & Engelmann, 1996 in Kozloff, 2003; Moore, 2008;
Kozloff et al., 2001; Lang and Evan, 2006). Cooperative learning (CL) is a teaching
technique and philosophy employing small groups (Killen, 1998 p. 82; Jhonson et al.,
1993 p. 3 in McCafferty et al. 2006 p. 3; Lie 2004 p. 28) so that learners work together to
maximize their own and their peer’s learning and receive rewards based on their group’s
performance (Olsen and Kagan 1992; Richards and Rodgers, 2001 p. 192; Sach et al.,
2003). Competitive model is a teaching model wherein students individually compete to
be rewarded as the winner of the competition (Lie, 2004 p. 23-24).
Previous findings show that both STAD CL and DI have their own benefits for
teaching reading comprehension. On one hand, STAD CL can improve reading
comprehension (Slavin, 1995; Jhonson et. al, 2000; Wichadee 2005; Norman, 2005;
Jalilifar 2010) and achievement (Jhonson et al, 2000). On the other hand, DI is a good
model for teaching reading comprehension providing students specific skills or strategies
that are necessary for reading proficiency (Moore, 2008; Gregory et al., 2005; Kozloff,
2003); could raise student achievement in reading (Iver, et al. 2003) and was an
Considering the benefits of STAD Cooperative Learning and Direct Instruction
above, this study attempts to shed light on the effects of STAD CL and DI on students’
reading comprehension in general and comprehension levels in particular.
1.2 The Purpose of the Study
This study is intended to investigate how STAD cooperative learning (STAD CL)
and Direct Instruction (DI) are implemented in a classroom, to find out which instruction
is more effective in improving reading comprehension in general and comprehension
levels in particular, and what the students’ responses are to STAD CL or DI.
1.3 Research Questions
Based on the purposes of the research above, this study attempts to answer the
following research questions:
1. How cooperative learning (STAD CL) and direct instruction (DI) are implemented in
the classrooms?
2. Which instruction, STAD CL or DI, is more effective in improving the students’
reading comprehension?
3. Which instruction, STAD CL or DI, is more effective in improving each of the
students’ reading comprehension level?
4. What are the students’ responses to STAD CL or DI?
1.4Definition of the terms
There are many terms used in this study, so to add precision to this study
(Cresswell, 1994 p. 106; 2003 pp. 142-3), it is necessary to clarify the terms. Below are
listed the operational definition of the used terms.
- Reading is defined as the interaction between a reader and a text to combine information from the reader’s background knowledge, his/her purpose and the text to
build meaning (Mikulecky, 1990 p. 2; Anderson in Nunan, 2003; Snow, 2002, p. 2 see
also Alexander, 1989).
- Reading comprehension is the process of simultaneously extracting and constructing meaning through interaction and involvement with written language (Snow, 2002 p.
xiii). In this study, the term reading and reading comprehension are treated
- Comprehension levels are the levels of understanding about the author’s intended message of a text (Haris et al. 1981 in Setiadi, 2010 p. 88). In this case, only three
levels are investigated: literal, inferential and evaluative (Alexander, 1989 p. 125;
Muhamad, 1999; Berry, 2005; Brasell & Rasinski, 2008 p. 87).
- Student Team Achievement Division (STAD) in this study refers to the cooperative learning models consisting of class presentation, teams, quizzes, individual
improvement and team recognition (Slavin, 1995 p. 71).
- Cooperative Learning (CL) in this study refers to a teaching procedures employing small team so that learners work together to maximize their own and their peer’s
learning and receive rewards based on their team’s performance (Killen, 1998 p. 82;
Jhonson et al., 1993 in McCafferty et al. 2006 p. 3; Olsen and Kagan 1992; Richards
and Rodgers, 2001 p. 192; Sach et al., 2003).
- Direct Instruction (DI) refers to a pattern of teaching that consists of the teacher’s explaining a new concept or skill to students, having them test their understanding
under teacher direction in controlled practice, guided practice and independent practice
(Binder & Watkins, 1990; Killen, 1998 p. 2; Stein et al., 1998; Kozloff, 2003 Joyce,
2011).
- Responses in this study refer the students’ opinion about the effect of STAD CL or DI on their reading skills in each comprehension level and when they were facilitated by
the instructions.
1.5 Significance of Study
This study is expected to provide its significance at least in three points of view,
referring to Creswell (1994 p. 111; 2003 p. 149).
Theoretically, this study may add empirical support to existing theories, literature
and scholarly research findings of STAD cooperative learning and direct instruction (DI)
in teaching reading comprehension.
Practically, the results of this study may help to clarify the benefits of applying
STAD CL and DI in teaching reading so that more teachers can replicate the study and
apply the CL or DI in their daily teaching to improve students’ comprehension.
Professionally, this study may encourage the teachers in the research site or in the
regency to apply STAD CL and DI in their teaching; and promote the theory-based
1.6 Structure of Thesis
This thesis is organized into six chapters. Chapter I presents the background, the
purpose, the research questions, significance of the study and the structure of the thesis.
Chapter II discusses theoretical reviews on reading comprehension, STAD Cooperative
Learning and Direct Instruction with their recent research finding. Chapter III describes
the methodology for collecting and analyzing the data, including design, participants, data
collection techniques, and data analysis. Chapter IV discusses the teaching programs as
the implementation of both STAD CL and DI with the result of observation and quizzes.
Chapter V presents the findings and discussion of the obtained data from tests,
questionnaire and interview. Finally, Chapter VI presents the conclusions and limitation of
CHAPTER III: RESEARCH METHOD
The previous chapter has described the theoretical background of the study. It
discusses literature review about reading comprehension, comprehension levels, STAD
Cooperative Learning (STAD CL) and Direct Instruction (DI) along with the principles,
procedures and their weaknesses.
This chapter provides the information about the methodology of the research
including the research questions, the setting and participants of the study, the design, data
collection methods and data analysis. The conclusion ends this chapter.
3.1 Research Setting and Participants
This research was undertaken in a junior high school in Serang Regency, Banten
Province. This site made the research more feasible and suitable in terms of time, mobility
and skills (McMillan and Schumacher 2001 p. 432). Firstly, it was located in the same
town as the researcher. This could ease the researcher in managing time and cost in
running the study. Secondly, based on the researcher’ previous observation, the English teacher had the necessary skill to implement the teaching procedures. Thirdly, the
researcher had good access to the site, since the researcher was one of teaching personnel
in the site.
The participants of the study were 64 students of eight graders which were
divided into two groups each of which consist of 32 students. They were selected based on
the historical factors and pre-existing ability (Hatch and Farhady, 1982 p. 7; Mc.Millan
and Schumacher, 2001 pp. 186-7). In terms of historical factors, to follow Hatch and
Farhady, the students in both groups had relatively the same language learning experience.
Previously, they had been studying English for more than 1.5 year the same teacher and
the same materials. No one of them had ever joined any English course. In such a time
span and experience, they were assumed to have adequate knowledge background which is
beneficial for their reading (Alderson, 1999). This condition helped the researcher
assumed that the participants had similar prior knowledge (Hatch and Farhady, 1982 p.7).
In addition, they were also chosen based on the homogeneity of pre-existing
were statistically homogenous, no significant difference on their pretest scores. In other
words, the two groups have approximately similar pre-existing reading comprehension
ability (Hatch and Larazaton, 1991 pp. 261-3). The selected groups, then, were assigned as
experimental and control groups by flipping a coin (Hatch and Farhady, 1982 p. 19).
3.2 Research Design
This study employed triangulation mixed method design (Creswell, 2003 p. 213;
2008 pp. 558-9 see also Mc.Millan and Schumacher, 2001 p. 542; Darlington and Scott,
2002 p. 123). The design was the combination between two designs: quasi-experimental
and survey designs (Hatch and Farhady, 1982; Mc.Millan and Schumacher, 2001 pp.
32-4). The quasi-experimental design was employed since this study compared the causal
effect of the independent variables: STAD CL and DI, on the dependent one: reading
comprehension levels (Mc.Millan and Schumacher, 2001 pp. 342; Hatch and Farhady,
1982; Vellutino, and Schatschneider, 2011 p. 157). With this design, this study was more
practical to do as it was not nec essary to assign students randomly (Hatch and Farhady,
1982 pp. 24 see also Vellutino, and Schatschneider, 2011 p. 169; Cresswell, 2008 p. 313).
During the teaching programs (see Chapter IV), an observation was conducted to provide
additional evidence for the study (Cowie in Heigham and Crocker, 2009, p. 168) and to
have better understanding of what was going on in the implementation of the teaching
programs. Meanwhile, the survey design, wherein the researcher elicited the students’ opinion about the effects of STAD CL or Di on their comprehension levels, was carried
out after the programs to provide better understanding of the findings (Creswell, 2008 p. 552) and to elicit students’ opinion about the effect of the teaching programs on their comprehension levels.
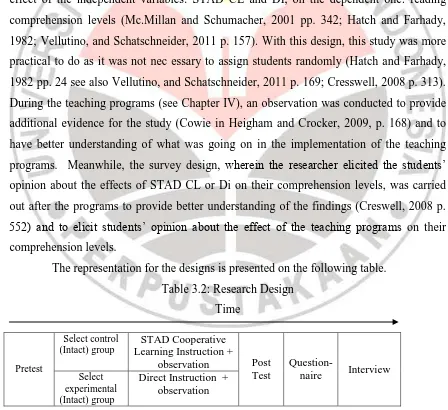
The representation for the designs is presented on the following table.
Table 3.2: Research Design
Time
Pretest
Select control (Intact) group
STAD Cooperative Learning Instruction +
observation Post Test
Question-naire Interview
Select experimental (Intact) group
Direct Instruction + observation
Table 3.2 above shows a pretest (see Section 3.3.1) preceded the research, then
experimental and control groups were selected on the basis of the pretest. After that, the
teaching programs (see chapter IV) were conducted. After the programs ended, a post test
(see Section 3.3.1), questionnaire (see Section 3.3.2) and interview (see Section 3.3.4)
were administered.
3.3. Data Collection Methods
This section discusses data collection methods including pretest and post-tests,
observation, questionnaire and interview.
3.3.1 Pretest and Posttests of Reading Comprehension
As mentioned in the research design (see Section 3.1), to gather the data about the students’ achievement in reading comprehension, a pencil and paper tests (Mc.Millan and Schumacher, 2001 pp. 250-7) were administered. The tests were pretest, posttest and
quizzes. The pretest (see Appendix 1a and 1b for the items) was aimed to see and compare
the existing ability of the groups involved in the study. It was done before the teaching
programs were conducted. The posttest (see Appendix 2a and 2b) was conducted after all
teaching programs were done. It was conducted to see the effect of the teaching programs
on the students’ comprehension levels. In addition, in the end of every treatment, a quiz
(see Appendix 3a,b for the example of the items) was also administered to assess the
students’ comprehension of the text learned.
In the tests, multiple choice items were chosen for several considerations. Firstly,
they are suitable items for testing reading as receptive skill (Brown, 2005 p. 47). Secondly,
they are selected due to its objectivity and its practicality. Multiple choice items are more
objective since there will be less scoring mistakes than other test formats (Brown, 29).
They are also easy to administer and can be scored quickly (Brown, 2005 p. 47). It can be
administered and scored in shorter time than that of other formats. It has simplicity in
analyzing the test validity and the test reliability (Brown, 2001 p. 386; 2004 p. 20).
Some test items were taken from available reading tests and some others were
constructed by the researcher. They were adopted from the items of previous national
examinations (Balitbang – Kemendiknas, UN, 2011) or its try out. The selection and the construction of the items were based on the comprehension levels to measure and their
The items were segmented into three sections, according to comprehension
levels: literal, inferential and evaluative (see Section 2.1.5). For literal level, the test items
required students to scan for specific information; read for detailed explicit information;
guess the meaning of unfamiliar word from context, and identify or locate information.
For inferential comprehension, test items were related to identifying or reading for main
ideas and pronominal reference; reading for implicit meaning; outlining logical
organization of text and drawing inferences in the content. For evaluative comprehension,
test items were to assess students’ ability in recognizing a writer’s purpose, attitude, tone and emotion in the text and identifying the characteristics of characters; and analyzing the
(generic) structure of the text (see Section 2.1.5 for detail).
The test consisted of thirty items with two genres of texts: recount and narrative
(see Martin and Rose, 2008; Anderson and Anderson, 1997). These genres were also as
the material in the teaching programs (see Chapter IV). They were chosen since they had potential to challenge all levels of students’ comprehension, according to Barret Taxonomy of reading comprehension levels (www.campbellps.det.wa.edu.au; Clymer
1968 in Hudson, 2007 and Pettit and Cockriel, 1974; Berry, 2005). The pretest items
included two recounts, about unforgettable experience and holiday, and two narratives
about folktale and legend. The posttest ones were also composed of five texts: two
recounts about lost dog and unforgettable experience, and three narrative texts about fables
and legend.
To enhance the validity of the test items, some efforts were made. To maintain the
content validity (Hatch and Farhady, 1982 pp. 250-5; Hughes, 2003 p. 26: Brown, 2005 p.
221), the construction of the test items were referred to reading comprehension levels,
basic competence of the content standard (Depdiknas, 2006) as well as graduation criteria
of English national examination of Junior High School (Depdiknas, 2011). To support the
face validity, the items were constructed in such a way that they had similar length of
options; the same number of options and similar organization (Hughes, 2003 p. 33). At
last, to uphold the criterion validity (Hughes, 2003 p. 27), the results of the (pre- and post)
tests were compared with those of the previous tests.
To ensure the reliability and the difficulty levels, the test items were tried-out and
subsequently modified (Hatch and Farhady, 1982 p. 253). The items were tried out to
another group of students not involved in the study. This try-out was intended to see bad
50% of medium and 25% of difficult items (Hughes, 2003; Brown, 2005; Arikunto, 2009,
p.207). There were 40 items on the try-out but only 30 items were selected for the tests.
The selection was based on difficulty and comprehension levels. Further discussion of the
try-out of the items is discussed in Chapter IV Section 4.2.2.
3.3.2 Class Observation
Observation was carried out to provide additional evidence for the study (Cowie
in Heigham and Crocker, 2009, p. 168) and to get to know first-hand information about
social process in a naturally occurring context (Silverman, 1993). In this case, the
researcher acted as a participant observer (Creswell, 2001 p. 222; see also Cowie in
Heigham and Crocker, 2009 p. 166) wherein he got involved in helping the teacher plan
the teaching programs, prepare reading texts, implement the procedures of the programs
and evaluate them. This observation aimed to have better understanding of what was going
on in the implementation of the teaching programs and how the teacher as well as students
participated in the activities.
To provide sharper focus of data collection (Nunan, 1992 p. 98), in this study, the
researcher applied structured observation wherein specific categories to observe had been
determined previously (Mc.Millan and Schumacher, 2001 pp.40-1; see also Nunan, 1992
p. 96). The categories included the principles and the procedures of the teaching programs.
The observation sheet for STAD CL group (see appendix 4a) were adapted from
Furtwengler (1992; see also Leighton in Cooper, 1990 pp. 330-331). It contained some
indicators of effective cooperative learning related to classroom organization, classroom
management, presentation content, group facilitation, monitoring and lesson summary. In
the meantime, the observation sheet for DI group (see appendix 4b) were adapted from
observational guideline of direct instruction from education.byu.edu. It included direct
instruction procedures consisting of the indicators of opening, modeling, guided practice,
independent practice and closing phases.
When the observation was being conducted, the researcher also made field notes
(see Appendix 5a and 5b, for the example). The notes about what the teacher as well as the
students did in the teaching programs.
3.3.3 Questionnaire
After all the teaching programs were done, a questionnaire (see Appendix 6a -
anonymity of respondents (Mc.Millan and Schumacher, 2001 p.257). In this study, the questionnaire surveyed the students’ opinion about the effect of STAD CL or DI on their comprehension levels. It was aimed to provide a numeric information, data or trend about the students’ opinions on the teaching programs (Mc.Millan and Schumacher, 2001 p. 304; Cresswell, 2008 p. 61; 2002 pp. 154; 1994 pp. 127-130). The questionnaires were
distributed to both groups after the posttest.
The questionnaire was developed following the guideline from Oppenheim (1982);
Barbie (1998) in Mc Millan and Schumacher (2001 p. 258) and Dornyei (2002). The items
were arranged in Likert Scale, in the four gradations starting from ‘strongly agree’, ‘agree, ‘disagree’ and ‘strongly disagree’ (Mc.Millan and Schumacher, 2001 p.262; Dornyei, 2002 p. 27; Creswell, 2008 p. 176;). The respondents were only required to check the
place on the scale that best reflect their belief or opinion about the statements (Mc.Millan
and Schumacher, 2001 p.262).
The questionnaire contained 18 statements about the reading skills related to the
three levels comprehension: literal, inferential and evaluative (see Appendix 6a and 6b).
They consisted of nine positive and nine negative ones to avoid a response set in which the
respondents mark only on side of the scale (Dornyei, 2002 p. 43). They were randomly
arranged to make sure the students’ consistency, real perception, and to prevent guessing (Sugiyono, 2005; Oppenheim, 1982). They were written in Bahasa Indonesia to make it
more comprehensible for the students and to avoid misunderstanding.
Further, to enhance the effectiveness and comprehensibility of questionnaire, it
was validated, coded and pilot-tested (Mc Millan and Schumacher, 2001 p. 267; Dornyei,
2002 pp. 53-55; Creswell, 2008 p. 402;). Before being tried out, it was validated by
having others to read and to give feedback whether it was vague or incomprehensible. It
was also coded by giving the initial of comprehension levels, the number of statements of
each level and positive (+) or negative (-) symbols. It was also pilot-tested to a group of
students not involved in the study to see their capability of completing the questionnaire
and their reaction.
In the pilot testing, it was found that generally all statements in the questionnaire
were comprehensible for the students. But, the term ‘pembelajaran langsung’ (Direct Instruction) needed describing since the students were not familiar with the terms. Then, to
follow Juliandi (2007), the result of the pilot test was statistically analyzed via Microsoft
Correlation. It was found that most statements (73%) were statistically valid to use. And,
in terms of internal consistency, the score of split-half reliability (Brown, 2005, p. 177;
Hughes, 2003, p. 40) between positive and negative statements was 0.97. It meant that the
questionnaire had good reliability. The score was close to the perfect reliability, that is,
one (1.00).
3.3.4 Interview
In addition to the previous data collections, interview was conducted to verify,
extend, elaborate or explain the data collected (Creswell, 2008 p. 552; McMillan and
Schumacher, 2001 p. 444). In this case, it was intended to elicit the students’ opinions about the effects of STAD CL or DI on their learning reading strategies. It was done after
the analysis of the posttest score.
The interview was a directive (Richard, 2003 p. 51) or structured one (Nunan,
1992 p. 149) wherein specific topics/agenda were totally predetermined (see also
McMillan and Schumacher, 2001 p. 444). Its form was focused group interview. It was to
encourage a sense of divergent opinion (Krueger and Morgan, 1993 p. 17-18 in Emilia
2005 p. 245), to collect shared understanding from several individuals of students, to take
the pressure off the participants (Darlington and Scott, 2002 p. 62) and to provide
welcoming condition so that they were not hesitant to talk (Creswell, 2008 p. 226).
Twelve students from each group were purposefully chosen (Creswell, 2008 p. 214;
McMillan and Schumacher, 2001 pp. 400-1) from low, middle and high achievers in the
post tests.
Interview guideline (see Appendix 8a and 8b) was used when interviewing. It
consisted of some questions to elicit students’ opinions about the effect of the teaching programs. The questions were related to the advantages of STAD cooperative learning
(STAD CL) or Direct Instruction (DI) for their learning and their comprehension levels.
The questions were segmented into three parts: introduction, core part and winding down
or closing (Ritchie and Lewis, 2003 p. 114). In the introduction, to follow Ritchie and
Lewis, easy, opening questions were asked. The core part included deeper and more
specific questions. Finally, suggestive questions were delivered in the closing.
The number of questions in the group interviews was at least 16 questions. They
core ones were related to their impression and experience in implementing the instructions
especially the difference between the STAD CL or DI models and those that the students
had experienced before, the facilitation of the models to their learning and to their
comprehension levels. The closing ones consisted of a question relevant to students’ suggestions on the application of the learning models in the future.
3.4 Data Analysis
In this section, data analyses are discussed. The analyses include the four data
collection techniques employed: tests, class observation, questionnaire and interview.
3.4.1 Pretest and Posttest
ANATES V.4 (version 4) and SPSS V.15 software were utilized to analyze the
result of the pretest and the posttest. ANATES V.4 (KarnoTo and Wibisono, 2003) could
automatically analyze the reliability, the level of difficulty, discrimination index and distracters’ quality of the items. It helped researcher to identify the quality of the test items quickly and appropriately. The second one, SPSS (Nie and Hull,1968) could easily
analyzed quantitative data just by clicking the menu. It was to statistically analyze the
difference of means among data through independent t-test and non-parametric test.
The procedures of analyzing the data from the tests were as follows.
1. Data Entry and the Analysis via ANATES software
Firstly, the coded names of participants, the answers and the key answers were entered
into ANATES V.4. Then, the correct answers were scored, one correct answer got one
score. The sum of correct answers was divided by the number of the items to have
percentage point. Finally, the reliability, the level of difficulty, discrimination index and distracters’ quality of the items were analyzed automatically, just by clicking the menu.
2. Independent t-test analysis via SPSS V.15
The total scores obtained from ANATES V.4 were then statistically analyzed through
the SPSS V.15 software. This analysis was intended to see which teaching program,
STAD CL or DI, is more effective in improving the students’ comprehension in general. It compared the mean scores of total scores of both groups. Since they were
two independent groups, independent t-tests were chosen (Hatch and Farhady, 1982
pp. 111-4, Hatch and Lazaraton, 1991 pp. 258-262; Kinnear and Gray, 1994 p. 86). It
normal distribution since the participants were more than 30 students (Hatch and
Farhady, 1982 p. 98).
3. SPSS independent t-test on every level of Comprehension
Further, to see the improvement of the scores of both STAD CL and DI groups on
every level of comprehension, SPSS descriptive statistics and independent t-test were
carried out. For the comparison, the students’ answers on the raw data (data mentah) of ANATES.V4 were categorized into three levels of comprehension: literal,
inferential and evaluative, each of which consisted of 10 items. Such number of items
was appropriate enough to have descriptive statistics and inferential one (Kinnear and
Gray, 1994 p. 83). This analysis was intended to compare the significance of the
difference between the mean score both groups on every level of comprehension.
Since the data was the same as mentioned previously, independent t-test was run.
Then, the result of the analysis was described adequately.
3.4.2 Class Observation
The data from observation consisted of researcher’s field notes (Creswell, 2008 p. 224) and the result of reading comprehension quizzes. The analysis of the data was
conducted during and after the data collection (Miles and Huberman, 1994 p. 10). The
obtained data then were analyzed and described adequately, all of which will be presented
in Chapter IV together with the teaching programs. Specifically the data comprised mainly
of the teacher’s activities and the students’ response on the procedure of the teaching programs. The data obtained were presented in a condensed body of information (Emilia,
2005 p. 86) (see Appendix 5a and 5 b) which will be discussed in Chapter IV, together
with the teaching programs.
3.4.3 Questionnaire
The data from the questionnaire were analyzed in several steps. Firstly, the
questions or the statements in the questionnaires were categorized into the central themes
(Alwasilah, 2000 p. 160; Cresswell, 2008 pp. 251): the levels of comprehensions. Then,
simple computation and percentage were conducted. The results were tabulated,
statistically analyzed and interpreted adequately.
In analyzing the result of the questionnaire, the scores between the positive and
negative statements were reversed (Dornyei, 2002 p.43). For positive statements, to
meanwhile for negative ones, ‘strongly agree’ was scored one and ‘strongly disagree’ was scored four (see also Creswell, 2008 p. 184). All respondents’ checks were presented in recapitulation table (see Appendix 9a and 9b). In the end, SPSS.V15 analysis: non
parametric Wilcoxon signed rank was done. The result of the analysis will be presented in
Chapter V.
3.4.4 Interview
The data from interview were analyzed through several steps. Firstly, recorded data
were transcribed. In transcribing the data, the participants were coded to protect their
privacy (Silverman, 1993). To follow Miles and Hubberman (1994 pp. 10-11), then,
inappropriate or non relevant data were reduced. After that, the data were categorized into
central themes which became the main concern of this study (Cresswell, 2008 pp.
251-261); they are the participants’ impression on STAD CL or DI and their effects on their comprehension levels. The obtained data were presented in the condensed body of
information (Emilia, 2005 p. 86) (see Appendices 16a and 16b).
3.5 Conclusion of the Chapter
This chapter has provided the information about the methodology of the research
including the setting, the participants and the designs of the study. It also discusses the
data collection techniques and analyses for the study including tests, observation,
questionnaire and interview.
The following chapter discusses the teaching procedures as the teaching programs
for the study. It describes the steps of STAD CL and Direct Instruction (DI) in teaching
CHAPTER IV: THE TEACHING PROGRAMS
The previous chapter describes the methodology of the research including the
setting, participants, design of the study, data collection and data analysis.
This chapter depicts the stages of the study, the teaching programs and the
observed students‟ responses to them. It aims to answer the first research questions: how
to implement STAD CL or DI in the classroom. It sets out the phases of the study and
compares the similarities and the dissimilarities of the teaching procedures between the
Student Team Achievement Division (STAD) Cooperative Learning and Direct
Instruction. In presenting the phases, the students‟ responses obtained from observation
sheet (see Appendices 4a and 4b) and the researcher‟s field notes (see Appendices 5a and
5b) are also included in the description.
4.1 Phases of the Study
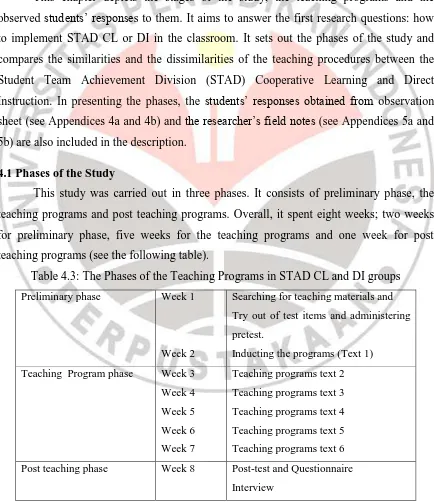
This study was carried out in three phases. It consists of preliminary phase, the
teaching programs and post teaching programs. Overall, it spent eight weeks; two weeks
for preliminary phase, five weeks for the teaching programs and one week for post
teaching programs (see the following table).
Table 4.3: The Phases of the Teaching Programs in STAD CL and DI groups
Preliminary phase Week 1
Week 2
Searching for teaching materials and
Try out of test items and administering
pretest.
Inducting the programs (Text 1)
Teaching Program phase Week 3
Week 4
Week 5
Week 6
Week 7
Teaching programs text 2
Teaching programs text 3
Teaching programs text 4
Teaching programs text 5
Teaching programs text 6
Post teaching phase Week 8 Post-test and Questionnaire
Summarized from the stages of this study
4.2 Preliminary Phase of Teaching Programs
In this phase, the researcher conducted three activities: i) searching for teaching
materials; ii) trying out the pretest items; iii) administering the pretest and iv) inducting
the teaching programs. Each activity will be delineated below.
4.2.1 Searching for Teaching Materials
The teaching materials for this study included reading texts with their practices
(see Appendix 10), quizzes (see Appendix 3) and lesson plans (see Appendices 11a and
11b). Overall, there were six reading texts utilized in this study. As mentioned before (see
Section 3.4.1), the texts consisted of two genres: recount and narrative texts (see Martin
and Rose, 2008; Anderson and Anderson, 1997). These texts, Martin and Rose describe,
comprise a series of interrelated episodes that include goal-directed actions and causally
related events. The ability to comprehend those genres can be a foundation for later
reading comprehension skills since the students have to monitor their understanding,
generate inferences, identify the key points, and understand causal relations (Paris & Paris,
2003 in Broek et al. 2009 p. 112). In addition, these genres had a potential to challenge all
levels of students‟ comprehension (Barret Taxonomy in Clymer, 1968 in Pettit and
Cockriel, 1974 p.64 in Hudson, 2002; Berry, 2005; Setiadi, 2012, see also
www.campbellps.det.wa.edu.au).
The teaching materials and their assessment in both STAD CL and DI groups were
similar. The similarities were to maintain the internal validity of the research (Hatch and
Farhady, 1982 p. 7; Hatch and Larazaton, 1991 pp. 33-41). Both groups used the same
reading texts (see Appendix 10) for the teaching and the same items for the quizzes/tests.
The texts (see Table 4.4) were selected from several resources. The selection, to
follow Hudson (2007, p. 34; see also Grabe and Stoller, 2002 p. 33; Hedgcock and Ferris,
2009 p. 29), was based on the length of the passage (the number of words), the complexity
of grammar and content familiarity. The texts were adapted from electronic book by
Widiati et. al. (2008); the text on the items of previous national examinations (Balitbang –
Kemendiknas, UN, 2011) or other resources like the internet, English fables, legend.
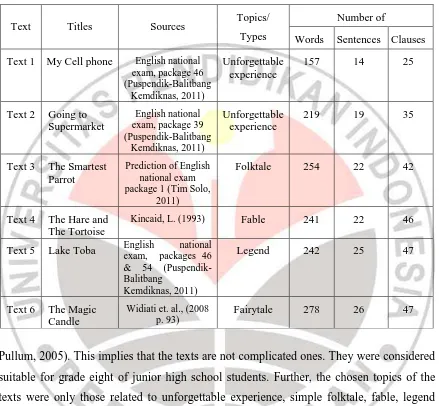
Table 4.4 below shows the profile of the texts. It presents that the selected reading
the comprehension. The number of clauses is twice as many as sentences, meaning that
most sentences consisted of simple clauses, rather than complex ones (Huddleston and
Table 4.4: Texts in the Teaching Programs
Text Titles Sources Topics/
Types
Number of
Words Sentences Clauses
Text 1 My Cell phone English national exam, package 46
Pullum, 2005). This implies that the texts are not complicated ones. They were considered
suitable for grade eight of junior high school students. Further, the chosen topics of the
texts were only those related to unforgettable experience, simple folktale, fable, legend
and fairy tale, which were considered familiar for the students and within their background
knowledge (Sadeghi, 2007 p. 199; see also Vaezi, 2006).
The examples of the texts are as follows.
The example of Recount text:
My Cell Phone
That Sunday evening I felt very tired after hanging out the whole day with my friends at the mall. As soon as I arrived home, I hung my jacket on a hanger and took a rest. About an hour I took a nap, and then I took bath.
Adapted from Puspendik - Balitbang – Kemendiknas, (UN), 2011.
The example of Narrative text:
The Hare and The Tortoise
One day, The Hare and The Tortoise were arguing in the forest.
“I could beat you in a race, any day,” The Hare said to The Tortoise. “Hmmm,” said The Tortoise.”Maybe you could.”
“I could!” said The Hare.”My legs can run much faster than yours.” “That doesn‟t mean you would win a race,” said The Tortoise “Then, we should have a race,” said The Hare.
So the race was arranged, “I will wait for you at the finishing post, “shouted The Hare to The Tortoise, and he sped off.
“May be,” said The Tortoise, and he plodded slowly after The Hare. “This is easy,” said The Hare to himself as he raced along.
After a while, The Hare stopped and looked behind him. There was no sign of The Tortoise. As it was very hot, The Hare sat under a tree, in the shade. He thought there was plenty of time, and The Tortoise would never catch up with him. The Hare closed his eyes.
After a while The Tortoise reached the tree. He saw The Hare sleeping under it. The Hare didn‟t see The Tortoise plodding by.
Later, The Hare woke up and raced off to the finishing post. He couldn‟t believe it when he saw The Tortoise
waiting for him.
“You must have cheated!” said The Hare to The Tortoise.
“Certainly not!” said The Tortoise. “While you were sleeping, I carried on the race”
Adapted from Aesop Fables
The reading texts were presented together with the exercises (see Appendix 10) to
provide students with practice and self assessment (Slavin, 1995, p. 95; see also Leighton
in Cooper, 1990 p. 328). To follow Slavin, the number of items/exercises was about ten to
fifteen items in the form of completion and short answer. As Slavin suggested, the reading
texts were distributed to every pair of students to ease their reading. They were distributed
right before the instruction. It was intended to maintain the equivalence of knowledge
background (Brown, 2001; Barnet, 1981; Vaezi, 2006; Hudson, 2002), in the sense that
the students read the texts for the first time when the teaching programs were being
implemented.
The reading texts (see Appendix 10) for both STAD CL and DI groups included
the exercises. They consisted of a text followed by several questions challenging their
literal, inferential and evaluative comprehension levels. The questions exercised and assessed the students‟ comprehension skills. As mentioned in the previous chapter, the comprehension levels and skills were to follow Barret taxonomy of comprehension
(Clymer, 1968 in Pettit and Cockriel, 1974 p. 64; in Hudson, 2002; Berry, 2005; Setiadi,
comprehension levels and skills. The selection of the skills, as mentioned in previous
chapter (see Section 2.1.5), was due to the feasibility of the study.
Further, to exercise those three levels of comprehension, the practices were
segmented into two meetings. In the first meeting, the questions were aimed to practice of
lower level reading skills to gain literal comprehension, and in the second one they were
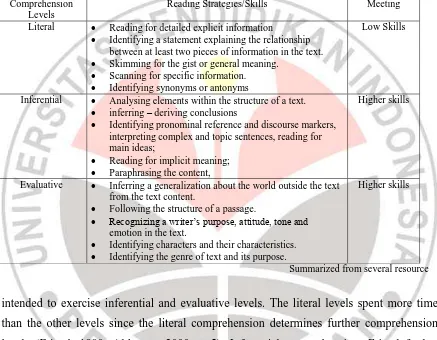
Table 4.5: The Investigated Comprehension Levels and Skills
Comprehension Levels
Reading Strategies/Skills Meeting
Literal Reading for detailed explicit information
Identifying a statement explaining the relationship between at least two pieces of information in the text.
Skimming for the gist or general meaning.
Scanning for specific information.
Identifying synonyms or antonyms
Low Skills
Inferential Analysing elements within the structure of a text.
inferring – deriving conclusions
Identifying pronominal reference and discourse markers, interpreting complex and topic sentences, reading for main ideas;
Reading for implicit meaning;
Paraphrasing the content,
Higher skills
Evaluative Inferring a generalization about the world outside the text from the text content.
Following the structure of a passage.
Recognizing a writer‟s purpose, attitude, tone and
emotion in the text.
Identifying characters and their characteristics.
Identifying the genre of text and its purpose.
Higher skills
Summarized from several resource
intended to exercise inferential and evaluative levels. The literal levels spent more time
than the other levels since the literal comprehension determines further comprehension
levels (Friend, 1980; Alderson, 2000 p. 5). Inferential comprehension, Friend further
claims, is dependent on literal one and higher order skill can only grow from competence
in the lower order skills. Literal comprehension is needed to be blended with prior
knowledge, intuition, and imagination for conjecture or to make hypotheses (Pennel,
2002) to get inferential and evaluative levels. It was also necessary to spend time more to
discuss vocabularies and grammatical expressions available on the texts to activate and
provide more background knowledge (Hudson, 2002 p. 143; Hedgcock and Ferris, 2009 p.
163; Setiadi, 2012). As Nunan (1999 p. 259) claims, what the students already know,
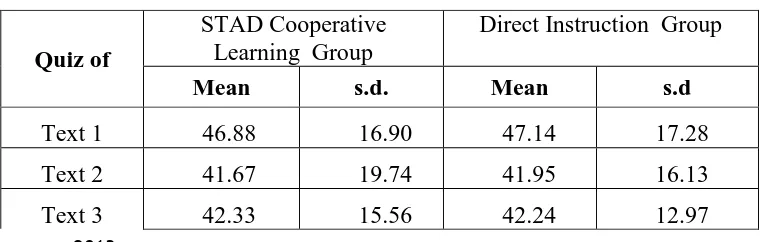
In addition, quizzes (see Appendices 3a and 3b) were also administered in the
study. The quiz, according to Slavin (1995), is a short test in the form of multiple choice
items to save the testing time. The quiz consisted of twelve items consisting of four
questions for every levels of comprehension. So, the items were 12 overall.
Above all, to provide rhythm to a course of study (Brown, 2001 p. 149) and
facilitate the participant teacher in implementing the programs, pre-established lesson
plans (see Appendices 11a and 11b) were provided. They were functioned as the
guidelines for participant teacher and students in implementing the teaching programs
(Feez and Joyze, 1998 p. 2 in Emilia, 2005 p. 115). They were made in Bahasa Indonesia
to be more comprehensible for the teacher. It covered the objectives of the lesson, the
material, the teaching procedures and evaluation (Brown, 2001 pp. 149-151; Lang and
Evans, 2006 pp. 218-220).
4.2.2 Trying Out the Pretest and Posttest Items
The try-out of the items was intended to make sure that all the test items, meet the
requirements in terms of their validity and reliability (Hatch and Lazaraton, 1991 p. 529;
Brown, 2005; Hughes, 2003). It was carried out by having another group of students, not
involved in the study, to answer test items.
After the try out (see Table 4.6) the reliability, the difficulty levels and the
discrimination index were obtained. The reliability of the pretest items (try-out version)
was 0.71 and the posttest was 0.75 indicating that both items were reliable enough to be
used in this study (Hughes, 2003 p. 39; Brown, 2005 p. 175).
As seen on Table 4.6, the difficulty levels of the pretest items (try-out version) consisted
of 32.5% difficult, 52.5% medium and 15% easy items and that of the posttest ones was
42.5% difficult, 42.5% medium and 15% easy items. These percentages meant that the
difficulty levels were balanced enough (Brown, 2005 p. 69). The discrimination index of
the items was relatively good. More than 75 % of the items exceeded 0.20 discrimination
index, which means that the items could discriminate the low and high level students
(Hughes, 2003 p. 226; Brown, 2005 p. 69). Additionally, bad distracters on several items
were modified and ten items in the tried-out version which either was too difficult or too
easy were eliminated in the test version.
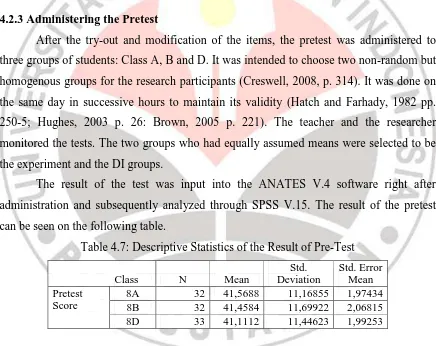
4.2.3 Administering the Pretest
After the try-out and modification of the items, the pretest was administered to
three groups of students: Class A, B and D. It was intended to choose two non-random but
homogenous groups for the research participants (Creswell, 2008, p. 314). It was done on
the same day in successive hours to maintain its validity (Hatch and Farhady, 1982 pp.
250-5; Hughes, 2003 p. 26: Brown, 2005 p. 221). The teacher and the researcher
monitored the tests. The two groups who had equally assumed means were selected to be
the experiment and the DI groups.
The result of the test was input into the ANATES V.4 software right after
administration and subsequently analyzed through SPSS V.15. The result of the pretest
can be seen on the following table.
Table 4.7: Descriptive Statistics of the Result of Pre-Test
Class N Mean
Std. Deviation
Std. Error Mean Pretest
Score
8A 32 41,5688 11,16855 1,97434
8B 32 41,4584 11,69922 2,06815
8D 33 41,1112 11,44623 1,99253
The descriptive statistics above shows that the mean score of Class A (41.56) and
B (41.66) were almost the same but the standard deviation of Class A (11.16) is quite
different from that of Class B (11.51). This means that the pre-existing ability of Class A
and B was almost the same but its variability or the range between the lowest score and the
highest one in Class B is larger than that of Class A (Hatch and Farhady, 1982 p. 57).
standard deviation (11.44) lies between that of class A or B. To see whether class A, B and
D were statistically homogeneous, an independent t-test was used (see Table 4.8).
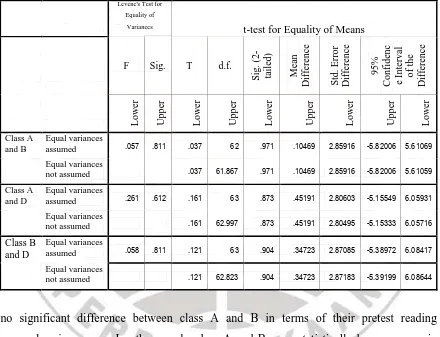
Table 4.8 below shows the result of SPSS independent t-test to see the
homogeneity of the groups or class A, B and D. It indicates that class A and B were
statistically homogeneous, but class D is not. Based on the independent t-test SPSS V.15
analysis, the null hypothesis was accepted when Class A and B were compared. The
t-value (t= -.036, d.f.=62, p= .704) was less than the alpha ( .05). This means that there was
Table 4.8: Independent Samples Test of Pretest Scores of Class A, B and D
Levene's Test for Equality of
Variances t-test for Equality of Means
rejected. There was significant difference between class D and class A or B. Thus, class A
and B were selected to be the STAD CL and DI groups.
Meanwhile, the result of pretest on every level of comprehension will be discussed
Afterward, to follow Slavin (1995 p. 74), the teacher together with the researcher,
documented and averaged the previous test scores to determine the students‟ base score. In
STAD CL group, the base scores were the basis for grouping the students (Slavin, 1995 p.
94; Leighton in Cooper, 1990 p. 320); in DI group, in contrast, they were only used for
comparing the gain between pretest and posttest.
Then, in STAD CL group, the teacher assigned students in groups/teams.
Following Slavin (1995 pp. 74-5; see also Leighton in Cooper, 1990 p. 320), the
researcher and the teacher carried out at least five steps: i) making a form of team
summary sheets for every group of students; ii) ranking students from highest to lowest in
past performance on the sheet on which previous daily test scores were the basis; iii)
dividing students by four; iv) assigning and balancing them to the team so that the group
consisted of heterogeneous performance with the average were relatively equal; and v)
filling out team summary sheet (see Appendix 13) by filling the names of the students on
each teams. This grouping, as STAD CL required, was intended to have equal „achievement division‟ wherein each team consisted of the students with various comprehension ability (Slavin 1995; Apple, 2006 p. 280; Lang and Evan, 2006 p. 422).
4.2.4 Inducting the Teaching Programs
After the groups of participants were determined, the researcher and the teacher
inducted the teaching programs to both groups. It aimed to introduce and familiarize both
the teacher and the students to apply the principles and procedures of the teaching
programs (see Chapter II) and to see potential problems that might come up during the
implementation.
In this stage, the researcher, as participant observer, observed and took part
actively in (Creswell, 2008 p. 222; Cowie in Heigham and Crocker, 2009, p. 167) helping
the teacher as well as students implement the teaching procedures in both groups. In
implementing the teaching programs, the researcher assisted the teacher in timing the
activities, reminding teachers the teaching procedures to avoid missing, getting involved in
managing the classroom and directing students to do what should they do.
On this induction of teaching programs, it was observed that the students in STAD
CL group were more enthusiastic than those in DI group. In STAD CL group, many
students asked questions to the teacher and also researcher either about the procedures of
livelier than that of DI. STAD CL seemed, as Olsen and Kagan (1992; see also Johnson
and Johnson 1989 in Sach et al. 2003; Ming, 2007) claim, promoted the interaction and
communication not only between teachers and the students, students and students, the
researcher and the teacher, and the researcher and the students. This communication and
interaction were enhanced as the teacher and the students were not familiar yet with the
procedures and the principles of either STAD CL. In DI group, the students were not
observed as enthusiastic as those in DI. This is probably because the DI steps (see Chapter
II Section 2.3.3) were not much different with what they used to do. So, the students did
not ask many questions about the procedures of the programs, instead, they did the
practices as they were required. The response to the practices in DI will be discussed in
Chapter 5 Section 5.3.
4.3 Teaching Programs
The teaching programs were conducted in the classroom of participants twice a
week in the schedule of English subject. They were scheduled twice a week, each of which
80 minutes long. This length was in accordance with the enactment of the 2006 school
based curriculum (Depdiknas, 2004).
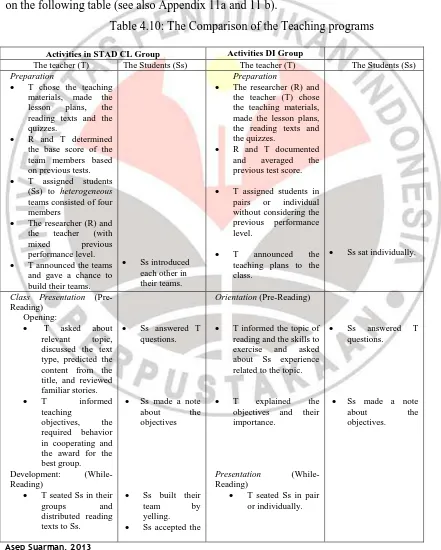
The teaching program of STAD CL and DI, as previously mentioned (see Chapter
II Section 2.2 and 2.3), had similarities and differences, which can be seen in lesson plans
(see Appendices 11a and 11b). The similarities lied on the steps in pre-reading, partly
while reading and post reading activities (Barnet, 1988a; Brown, 2001; Vaezi, 2006;
Hedgcock and Ferris, 2009). In both groups, the activities consisted of preparation, class
presentation, structured and guided practices, quiz; and individual accountability (as
described earlier in Chapter II Section 2.2.3 and 2.3.3).
The difference existed when students did the team or independent practice and the
reward or goal oriented structures (Slavin 1995 p. 16). When doing the practice, to follow
Slavin (1995 p. 77; see also Leighton in Cooper, 1990 p. 320; Apple, 2006 p. 282)
suggested, the students in the STAD CL group worked in teams, but in DI group, students
worked individually (Moore, 2008; Joyce et all, 2011; Arend and Kilcher, 2010, p. 201).
In terms of reward or goal-oriented structure, STAD CL groups applied cooperative goal
oriented structure wherein students were assessed individually and rewarded as both an
goal achievement. On the other hand, in DI group, competitive goal-oriented structure was
employed (Slavin (1995 p. 16; Lie, 2004 p. 24), wherein the students were only assessed
and rewarded as an individual. It operated competitive goal structure, wherein each individual‟s goal efforts frustrated other‟s goal attainment (Slavin, 1995 p. 16; Lie, 2004 p. 24). In other words, the reward in STAD CL group was group certificate, but in DI
group it was individual certificate (Slavin, 1995 p.80; Leighton in Cooper 1990 p. 312;
Lie, 2004).
4.3.1 Preparation (Before Instruction)
In preparation, more activities were done in STAD CL group than those in DI one.
In the former, as previously mentioned (see Section 4.2.3), the teacher grouped the
students based on their previous test scores. In the latter, there was no grouping. In STAD
CL group, the teacher announced the members of each group/team and let the students
build their team by naming their group, introducing group mates and creating team name,
logo, yell etc. (Slavin, 1995 pp. 139-140; Apple, 2006 p. 279; Jacobs, 2004). This aimed
to give team members a chance to do something fun, to get familiar with each other
(Slavin, 1995 p. 75) and a kind of warming up before cooperating. In DI group, there was
no specific preparation besides materials and the practice like in STAD CL group.
From the observation, in preparing STAD CL, the teacher had more activities to do
than that of DI. In STAD CL, the teacher needed to determine the base score and assigned
students into heterogeneous but balanced group in terms of the achievement. Then, the
teacher needed to announce the teams and let the students build their team. Meanwhile in
DI, the teacher was not required to do such activities. This indicates that applying STAD
CL is more demanding for the teacher than DI. This fact is in line with the claims that
applying STAD CL spends considerable time in preparing the students to learn; in
recording the student performance on each learning task and in calculating group
achievement scores (Killen, 1998 p. 88) and in researching a topic and creating lesson
(Solari, 2008).
Although STAD CL is more demanding for teachers, the grouping and the team
building e.g. making yell, leads to the feeling of togetherness. The students get closed to
each other in their teams, as revealed in interview that will be discussed in Section 5.3.
They looked cheerful and spirited. This fact confirms the STAD CL principle that the