THIS REPORT CONTAINS ASSESSMENTS OF COMMODITY AND TRADE ISSUES MADE BY USDA STAFF AND NOT NECESSARILY STATEMENTS OF OFFICIAL U.S. GOVERNMENT POLICY
The below average winter rainfall received in 2017 and the low dam levels (about thirty percent) in the drought stricken Western Cape, will severely impact the availability of irrigation water in the 2017/18 MY. As a result, the 2017/18 MY production and export of deciduous fruits is expected to decrease significantly.
Deciduous Fruit Production and Exports Expected to Decrease
Due to the 2017 Drought Conditions
Fresh Deciduous Fruit Annual
South Africa - Republic of
Page 2 Commodities:
Executive Summary
The 2017/18 MY apple production is forecast to decrease by six percent to 850,000 MT, due to the decrease in area harvested, limited irrigation water, lower yields and smaller fruit sizes. Exports of apples in the 2017/18 MY are forecast to decrease by five percent to 500,000 MT, based on the available production and some fruit not meeting the export quality standards.
Pear production in the 2017/18 MY is forecast to decrease by six percent to 405,000 MT, due to the decrease in area harvested, limited irrigation water, lower yields and smaller fruit sizes. This is expected to result in about a three percent decrease in the 2017/18 MY pear exports to 250,000 MT.
Post forecasts that the 2017/18 MY table grape production will decrease by fourteen percent to 287,000 MT, based on the decrease in area harvested and small fruit size in the Western Cape growing regions. This decrease was partially offset by the higher yielding new generation varieties, as well as normal production and growing conditions in the Orange River growing regions. This will result in a fifteen percent decrease in the 2017/18 MY table grape exports to 258,000 MT.
South Africa`s deciduous fruit industry is export-oriented and prioritizes exporting as much volume as they can before supplying the surplus fruit to the local market. As a result, the 2017/18 MY domestic consumption of apples, pears and table grapes will decrease based on the lower production.
South Africa only imports small quantities of deciduous fruits to fulfill a niche market or to satisfy domestic demand when supply is limited.
Apples and Pears MY – Marketing Year (January to December) Table Grapes MY – Marketing Year (October to September) MT – Metric Tons
Sources
Name Website
Hortgro http://www.hortgro.co.za
South African Table Grapes Industry (SATGI) http://www.satgi.co.za/ Global Trade Atlas (GTA) http://www.gtis.com/gta/
Grapes, Table, Fresh Pears, Fresh
Page 3 Brief Background of the South African Deciduous Fruit Industry
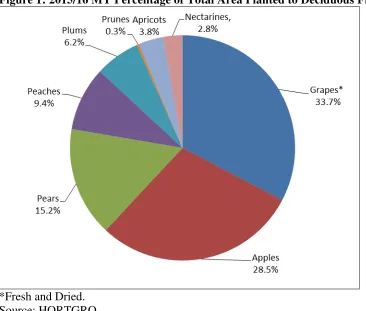
Deciduous fruit is the largest sub-sector of the South African fruit industry in terms of area planted. In the 2015/16 MY, about 79,748 hectares (ha) were planted to deciduous fruits, down from 80,738 ha in the 2014/15 MY due to the impact of the drought. Figure 1 shows that grapes (fresh and dried), apples and pears have the largest area planted and accounted for approximately 78 percent of the total area planted with deciduous fruit in the 2015/16 MY.
The Western Cape is the largest and traditional producer of deciduous fruits in South Africa. However, in the past two decades, the Northern Cape, Eastern Cape, and Limpopo provinces have become
increasingly large producers of deciduous fruit. South Africa is ranked the fourth largest apple producer and second largest pear producer in the Southern Hemisphere.
Figure 1: 2015/16 MY Percentage of Total Area Planted to Deciduous Fruits
Page 4 Apples, Fresh:
Production
The 2017/18 MY apple production is forecast to decrease by six percent to 850,000 MT, from 902,129 MT in the 2016/17 MY, due to the decrease in area harvested, limited irrigation water, lower yields and smaller fruit sizes. About eighty percent of the apple production is from the Western Cape, which is a winter rainfall region and is currently undergoing a severe drought. The below average rainfall received in 2017 and the low dam levels (about thirty percent) will severely impact the availability of irrigation water in the 2017/18 MY. In the short term, farmers are expected to prioritize irrigation of higher yielding varieties and orchards, while the remaining orchards would be irrigated just to keep the trees alive. There are also indications that some farmers could cut down some trees to reduce costs. These measures are expected to prolong the recovery of apple production once normal rainfall and weather patterns return. The 2016/17 MY apple production was revised downwards to 902,129 MT, based on updated industry statistics and the higher than expected impact of the dry conditions to fruit sizes and quality. The quality of apples in the 2016/17 MY were severely impacted by the drought conditions, as the fruit was dry, had a shorter shelf life and in some regions the ideal color was not achieved.
The Western Cape is the heartland of deciduous fruit production, with a climate similar to the Mediterranean, which is favorable for apple production. Ceres is the largest apple growing region accounting for twenty-nine percent of the area planted, followed by Groenland (twenty-seven percent), Langkloof East (eighteen percent) and Villiersdorp (fifteen percent). Harvest for South African apples typically begins at the end of January and runs through to June, with peak harvest times falling between February and April. Since 2008, the Golden Delicious cultivar has been the most planted cultivar at about twenty four percent of the area planted, followed by the Granny Smith cultivar at eighteen percent. Other cultivars which have been growing steadily are Gala (sixteen percent), Pink Lady (ten percent) and Fuji (nine percent).
Area Planted
The area planted to apples has steadily increased over the past decade as shown in Figure 2. This was driven by increased earnings from the export market and higher returns from apple farming which attracted investment into the sector. Post estimates that the area planted to apples in the 2017/18 MY will remain flat and the area harvested will decrease due to the impact of the drought.
Page 5
*Estimate.
Source: HORTGRO
Consumption
Domestic consumption of apples is forecast to decrease by three percent to 205,000 MT in the 2017/18 MY, from 210,501 MT in the 2016/17 MY. This is due to the decrease in production and depressed consumer demand because of the challenging economic environment characterized by low economic growth and high inflation. The decrease is expected to be offset by the increase in supply of apples that will not meet the export quality standards such as the ideal color, size and the shorter shelf life.
Over the past years, growth in domestic consumption has largely been driven by the increasing
preference for fresh fruit over processed fruit from a growing middle class. Apples are popular in South Africa and are widely consumed throughout the year. As a result, apples form part of the national food basket of goods monitored by the National Agricultural Marketing Council (NAMC) to track food price inflation. However, the per capita consumption of apples in South Africa is still relatively low at about 4kg, compared to other countries such as the United States (about 7kg) and Europe (about 15kg).
Exports
Page 6
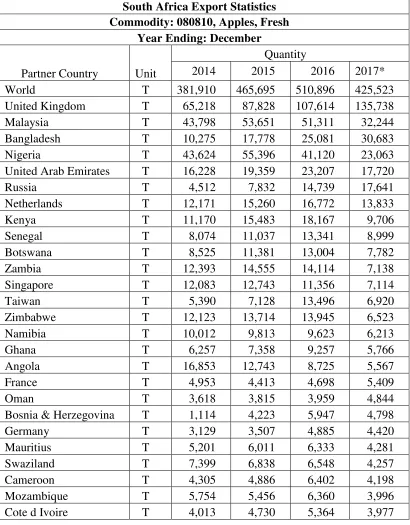
The United Kingdom is the traditional and largest single country destination for South African apple exports accounting for twenty one percent of the total exports. However, Africa is the largest regional export market accounting for about forty percent, followed by the European Union (EU) at thirty percent, and Asia at nineteen percent. Notably, South Africa has a free trade agreement with the EU. Exports to the United States are minimal due to the higher shipping costs and the challenges of maintaining the right quality and shelf life of the apples. Table 1 shows the breakdown of the major export countries for South African apples.
Table 1: South African Fresh Apple Exports
South Africa Export Statistics Commodity: 080810, Apples, Fresh
Year Ending: December
Partner Country Unit
Page 7
*Exports from January to August.Source: Global Trade Atlas (GTA)
Imports
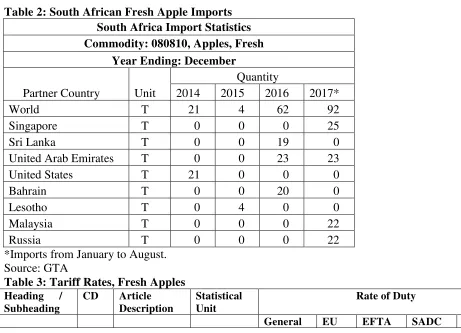
South Africa is a net exporter of apples, and only imports apples to fulfill niche markets or satisfy domestic demand when supply is limited as shown in Table 2.
Table 2: South African Fresh Apple Imports South Africa Import Statistics Commodity: 080810, Apples, Fresh
Year Ending: December
Partner Country Unit
Quantity
*Imports from January to August. Source: GTA
Page 8
0808.10 9 Apples,
fresh
kg 4% Free 4% Free 4%
Source: South African Revenue Services (SARS)
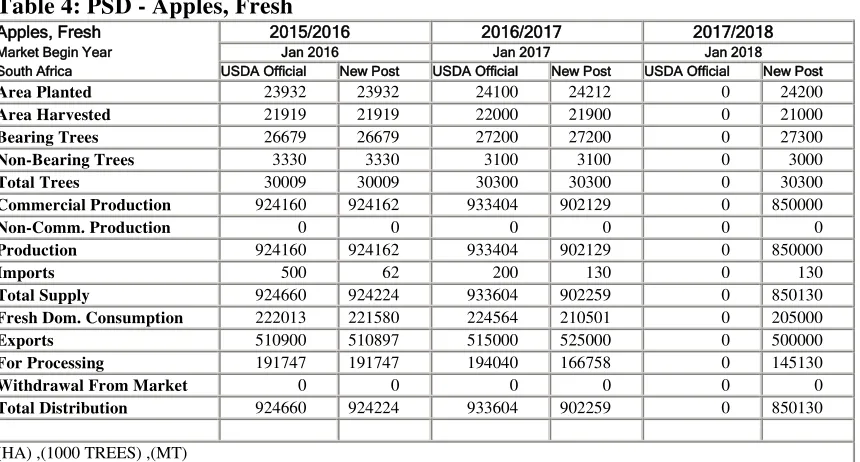
Table 4: PSD - Apples, Fresh
Apples, Fresh 2015/2016 2016/2017 2017/2018
Market Begin Year Jan 2016 Jan 2017 Jan 2018 South Africa USDA Official New Post USDA Official New Post USDA Official New Post
Area Planted 23932 23932 24100 24212 0 24200
Area Harvested 21919 21919 22000 21900 0 21000
Bearing Trees 26679 26679 27200 27200 0 27300
Non-Bearing Trees 3330 3330 3100 3100 0 3000
Total Trees 30009 30009 30300 30300 0 30300
Commercial Production 924160 924162 933404 902129 0 850000
Non-Comm. Production 0 0 0 0 0 0
Production 924160 924162 933404 902129 0 850000
Imports 500 62 200 130 0 130
Total Supply 924660 924224 933604 902259 0 850130
Fresh Dom. Consumption 222013 221580 224564 210501 0 205000
Exports 510900 510897 515000 525000 0 500000
For Processing 191747 191747 194040 166758 0 145130
Withdrawal From Market 0 0 0 0 0 0
Total Distribution 924660 924224 933604 902259 0 850130
Page 9 Pears, Fresh:
Production
Pear production in the 2017/18 MY is forecast to decrease by six percent to 405,000 MT, from 431,535 MT in 2016/17 MY, due to the decrease in area harvested, limited irrigation water, lower yields and smaller fruit sizes. Similar to apples, about seventy-nine percent of the pear production is in the Western Cape, which is a winter rainfall region and is currently undergoing a severe drought. The below average rainfall received in 2017 and the low dam levels (about thirty percent) will severely impact the
availability of irrigation water in the 2017/18 MY.
Pears grow well in areas that do not experience very high temperatures. Hence, the Western Cape is the heartland of pear production, accounting for at least seventy nine percent of the total production in South Africa. The major growing area for pears is Ceres which contributes about thirty-seven percent to the area planted, followed by Langkloof East (fourteen percent), Groenland (twelve percent),
Wolseley/Tulbagh (eleven percent), Klein Karoo (nine percent) and Villiersdorp (eight percent).
Pears are normally harvested from late December to early January. Packham's Triumph which contributes about thirty four percent to the area planted is the most popular pear variety, followed by Forelle (twenty six percent), William Bon Chretien (twenty percent) and Abate Fetel (six percent).
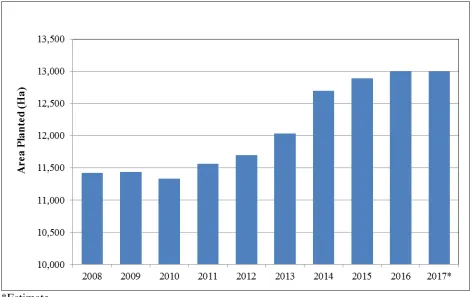
Area Planted
Figure 3 shows that the area planted for pears has increased steadily since 2010. This was driven by increased earnings from the export market and higher returns, which attracted investment into the sector similar to apples. The area planted with pears is expected to remain flat at 13,000 hectares in the
2017/18 MY, based on the impact of the drought. However, the area harvested will decrease as farmers are expected to prioritize irrigation of higher yielding varieties and orchards, while the remaining orchards would be irrigated just to keep the trees alive. There are also indications that some farmers could cut down some trees to reduce costs.
Page 10
*Estimate.
Source: HORTGRO
Consumption
Domestic consumption of pears in the 2017/18 MY is forecast to decrease by seven percent to 43,000 MT, from 46,250 MT in the 2016/17 MY, based on the decrease in production and depressed consumer demand because of the challenging economic environment characterized by low economic growth and high inflation. Pears and apples are close substitutes in the domestic market. However, the per capita consumption of pears in South Africa is still relatively lower than apples at less than 1kg, and compared to other countries such as Europe whose per capita consumption is about 4kg.
Exports
The 2017/18 MY pear exports is forecast to decrease by about three percent to 250,000 MT, from 257,000 MT in the 2016/17 MY, based on the lower production. The 2016/17 MY estimate of exports was revised upwards to 257,000 MT, due to the year-to-date exports and higher than expected volume of pears that met the export quality standards. The EU is South Africa`s traditional and leading export market accounting for about forty-nine percent of total pear exports, followed by Asia (sixteen percent), Africa (eight percent) and the Middle East (five percent). Exports to the United States are low and have been stable over the past years ranging between 800 to 1,000 MT.
Table 5: South African Fresh Pears Exports
Page 11
*Exports from January to August. Source: GTA
Page 12
As the second largest pear producer after Argentina in the Southern Hemisphere, South Africa only imports minimal quantities of pears mainly from China. Imports from China began after a 2007 agreement that allowed imports of Chinese pears into the South Africa market. The South Africa and China agreement is available on the following link:
http://www.nda.agric.za/doaDev/sideMenu/plantHealth/docs/protocol_pear_China.pdf .
Table 6: South African Fresh Pears Imports South Africa Import Statistics Commodity: 080830, Pears, Fresh
Year Ending: December
Partner Country Unit
Quantity
*Imports from January to August. Source: GTA
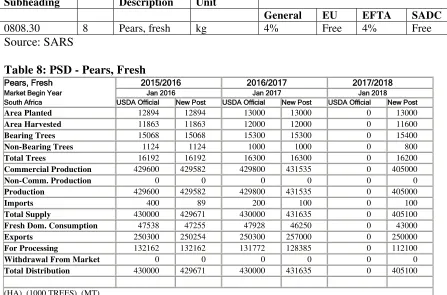
Table 7: Tariff Rates, Fresh Pears Heading /
Pears, Fresh 2015/2016 2016/2017 2017/2018
Market Begin Year Jan 2016 Jan 2017 Jan 2018 South Africa USDA Official New Post USDA Official New Post USDA Official New Post
Area Planted 12894 12894 13000 13000 0 13000
Area Harvested 11863 11863 12000 12000 0 11600
Bearing Trees 15068 15068 15300 15300 0 15400
Non-Bearing Trees 1124 1124 1000 1000 0 800
Total Trees 16192 16192 16300 16300 0 16200
Commercial Production 429600 429582 429800 431535 0 405000
Non-Comm. Production 0 0 0 0 0 0
Total Distribution 430000 429671 430000 431635 0 405100
Page 13 Table Grapes, Fresh:
Production
Post forecasts that the 2017/18 MY table grape production will decrease by fourteen percent to 287,000 MT, from 334,000 MT in the 2016/17 MY, based on the decrease in area harvested and small fruit sizes in the Western Cape growing regions. This decrease was partially offset by the higher yielding new generation varieties, as well as normal production and growing conditions in the Orange River region. Post made minor downward adjustments to the 2016/17 MY table grapes production to 334,000 MT based on final industry data. According to the industry, the medium to long term impact of the drought is expected to be less pronounced because of the climatically diverse industry, increased hectares in
production, the continued shift to higher yielding new generation varieties, and the resilience and adaptation of table grape farmers.
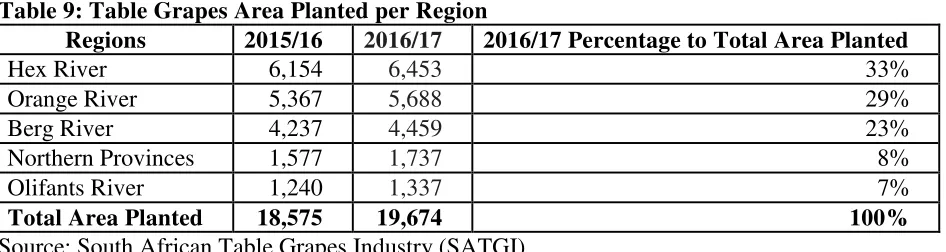
The major growing areas for grapes are the Hex River and Berg River regions in the Western Cape Province, and the Orange River and Olifants River regions in the Northern Cape Province as shown in
Table 9. Grapes are normally harvested from October to May. Harvest starts in week 43 (beginning of October) in the Northern Cape Region. The Hex River valley is the last region for table grapes
harvesting.
Table 9: Table Grapes Area Planted per Region
Regions 2015/16 2016/17 2016/17 Percentage to Total Area Planted
Hex River 6,154 6,453 33%
Source: South African Table Grapes Industry (SATGI)
The leading varieties of table grapes based on area planted are Crimson Seedless at twenty-four percent, Prime (nine percent), Thomson Seedless (eight percent), Flame Seedless (seven percent), Sugraone (six percent), Redglobe (six percent) and the Sugrathirteen (five percent). The cultivar profile in South Africa has changed in the past decade. Seeded cultivars are declining as consumers prefer seedless grapes, while the production of black and red seedless table grapes varieties has increased. The
popularity of seedless cultivars stems from their characteristics such as large berry size (with elongated or oval berry shapes), favorable texture (crunchiness) and good eating qualities.
Area Planted
The area planted to table grapes is forecast to decrease to 19,400 hectares in the 2017/18 MY, from 19,500 hectares in 2016/17 MY, based on the impact of the drought conditions. Figure 4 shows that the area planted to table grapes has been increasing steadily since 2008. This increase is correlated to the weakening of the rand and increased revenues received as the industry is export-oriented.
Page 14
*Forecast. Source: SATGI
Consumption
Domestic consumption of table grapes is forecast to decrease by two percent to 35,000 MT in the 2017/18 MY, from 35,701 MT in the 2016/17 MY, due to the decrease in production. This will be partially offset by the supply of table grapes that will not meet export quality standards. The supply of table grapes to the domestic market and consequently consumption in South Africa is dependent on the export market. Table grapes that cannot be sold on the export market, including those that do not meet export quality standards, are sold to the domestic market.
Exports
The 2017/18 MY table grape exports is forecast to decrease by fifteen percent to 258,000 MT, from 304,000 MT in the 2016/17 MY, based on the decrease in production and small fruit sizes. The EU is the leading historical export market for South African table grapes, accounting for at least seventy five percent of table grape exports. South Africa benefits from a shorter shipping distance than other
Southern Hemisphere competitors, strong demand for seedless varieties, and a free trade agreement with the EU. Exports to Asia (twelve percent), the Middle East (six percent) and Africa (four percent) also have strong growth potential and are increasingly becoming a core focus for South Africa. Export volumes to the United States and Canada have significantly grown over the past years as well, but are still low at about 12,000 MT and accounted for about three percent of the total exports in the 2016/17 MY.
Page 15
Africa could submit a similar request for the United States to relax its cold treatment protocols for South African table grapes.
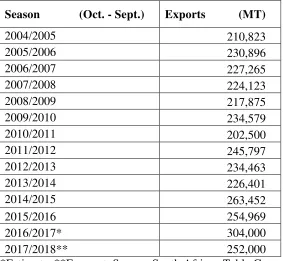
Table 10: South African Fresh Table Grapes Exports
Season (Oct. - Sept.) Exports (MT)
2004/2005 210,823
2005/2006 230,896
2006/2007 227,265
2007/2008 224,123
2008/2009 217,875
2009/2010 234,579
2010/2011 202,500
2011/2012 245,797
2012/2013 234,463
2013/2014 226,401
2014/2015 263,452
2015/2016 254,969
2016/2017* 304,000
2017/2018** 252,000
*Estimate. **Forecast. Source: South African Table Grapes Industry
Imports
South Africa is a net exporter of table grapes, and imports are mainly to fulfill the gap when South Africa is out of the season or has low volumes from around July to November. Spain, Namibia and Egypt are the primary suppliers as shown in Table 11.
Page 16 Commodity: 080610, Grapes, Fresh
Year Ending: December
Partner Country Unit
Quantity
2013/14 2014/15 2015/16 2016/17*
World T 4688 5582 5969 4751
*Imports from January to August. Source: GTA
Table 12: Tariff Rates, Fresh Table Grapes Heading /
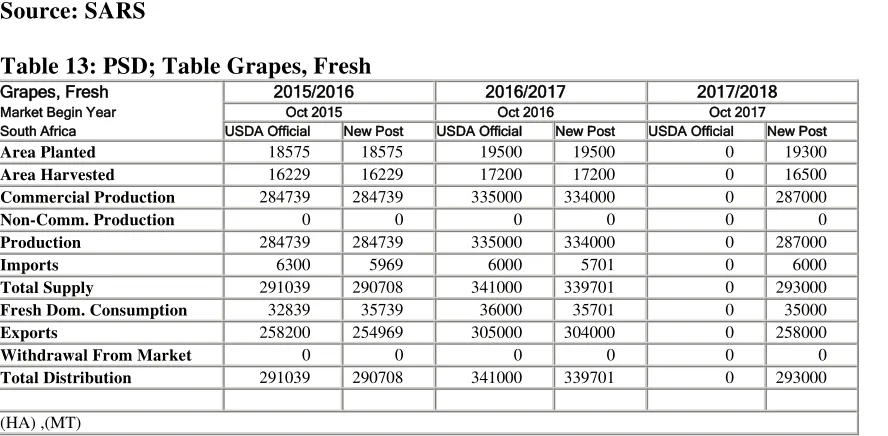
Table 13: PSD; Table Grapes, Fresh
Grapes, Fresh 2015/2016 2016/2017 2017/2018
Market Begin Year Oct 2015 Oct 2016 Oct 2017 South Africa USDA Official New Post USDA Official New Post USDA Official New Post
Area Planted 18575 18575 19500 19500 0 19300
Area Harvested 16229 16229 17200 17200 0 16500
Commercial Production 284739 284739 335000 334000 0 287000
Non-Comm. Production 0 0 0 0 0 0
Total Distribution 291039 290708 341000 339701 0 293000
Page 17 Policy:
Table 14 provides a list of the regulations applicable to apples, pears and table grapes in South Africa.
Exporters should also be aware that an importer may request additional certifications over and above the minimum legislation and regulations indicated in this section.
Table 14: List of Key Legislations and Regulations
Policy Link
http://www.nda.agric.za/doaDev/sideMenu/Food percent20Import percent20& percent20Export percent20Standard/docs/Agric percent20Product percent20Standards percent20Act percent20No percent20119 percent20 percent20of percent201990.pdf
Agricultural Pests, Act, 36 of 1983
Agricultural Pests Amendment Act, 9 of 1992
http://www.nda.agric.za/doaDev/sideMenu/APIS/doc/Agricultural percent20Pests percent20Act.pdf
Foodstuffs,
http://www.nda.agric.za/vetweb/Legislation/Other percent20acts/Act percent20- percent20Foodstuffs,
percent20Cosmetics percent20and percent20Disinfectants percent20Act-54 percent20of percent201972.pdf
Procedures
percent20nn422 percent20APS percent20table percent20grapes.pdf
Source: South African Department of Agriculture Fisheries and Forestry (DAFF)
Page 18
The apple and pear prices shown in Table 15 are the average prices (Rand/Ton) earned in the respective markets. The increase in apple and pear export prices is mainly due to the depreciation of the rand. The export market for pears and apples remains lucrative from a price perspective in comparison to the local and processed markets.
Table 15: Price of Apples and Pears