EFFECT OF LONG TERM TIDAL CONSTITUENTS ON MEAN SEA LEVEL TREND
DURING EL-NINO AND LA-NINA PHENOMENA
Nur Hidayah Md Yusof a, Mohd Razali Mahmud a , Mohd Hilmi Abdullah a
a GeoCoastal Research Unit, Geospatial Imaging and Information Research Group, Faculty Geionformation and Real Estate, Universiti Teknologi Malaysia
KEY WORDS: Tidal Constituent, Tidal Analysis, El-Nino, La-Nina
ABSTRACT:
There are many factors that influence the change of the tidal constituent pattern. The factors can be classified as astronomical factors and non- astronomical factors. The astronomical factors involve the gravitational force attraction by the moon and sun. The distance of sun and moon influence the gravitational attractions that are produced by the moon and sun towards earth surface. Non-astronomical factors involved the movements of currents, waves, temperature and so on which is cause by the phenomenon such as El-Nino, La-Nina. This study was conducted to investigate the effect of these phenomena towards the pattern of tidal constituent during the phenomenon on several stations that have been chosen. The difference stations were chose due to the change in the position of celestial body. In addition, tidal data for several stations were processed using the UTM Tidal Analysis and Prediction Software (μ-TAPS). Based on the tidal data that has been processed, the graphs were plotted for the predicted data and observed data to compare the different pattern between the data. The tidal data that has been processed were used to analyse the pattern of tidal constituents based on the changing amplitude of M2, S2, K1, O1, Sa, Ssa, Mm, Mf and MSf.
1. INTRODUCTION
The phenomenon of tide is often related with the position of the moon and sun to the earth. The distance and position of moon and sun to the earth can caused the occurrence of sea level rise and fall in a periodic. Thermal expansion of the oceans and the shrinking of ice sheets are two main processes that caused sea level rise increase from time to time. About 80 percent of the global warming associated with carbon dioxide emissions has caused into raising the temperature of the oceans. The higher temperature caused the higher pressure on earth that can cause the difference of sea level. The change of sea level is closely related to the tide phenomenon.
There are also other non-astronomical factors related to sea level rise and fall such as configuration of the coastline, local depth of the water, ocean-floor topography and other hydrography and meteorological influences that may play an important role in altering the range, interval between high and low waters, and times of arrival of the tides (National Oceanic & Atmospheric Administration, 2013). There are also other meteorology effects that involves the phenomena such as El- Nino, La-Nina, floods and also the rising temperature of the earth. This study focuses on this phenomena to see the change of the sea level during the occurrence of this phenomena. The observation of tidal data during this phenomena was obtained in a few years.
The change of tide is also influenced by the rising temperature of the earth. The measures of tide involve many purposes such as to analyse the observation data of tide and the predicted data
of tide. The making of predicted data that has been generated does not take into account the other factors that contributes to the effect of tide. This can caused a difference in value or error between the predicted data and the observed data when the phenomena of El- Nino and La-Nina occurs. This study was carried out to identify the effect of the El-Nino and La-Nina phenomena towards the pattern of Mean Sea Level and tidal constituents by taking into account the factor of the rising earth temperature.
This study is about to investigate the effect of meteorology effects based on the phenomena such as El-Nino and La-Nina on the tide phenomenon. It involves the tidal data from year 1992 to 2003. Tidal data were processed and analyse by using the UTM Tidal Analysis and Prediction Software (μ-TAPS). The analysis of tide data along the years 1992 to 2003 were carried out to compare between the observed data and prediction data using the data of El-Nino and La- Nina to study the effects of El-Nino and La-Nina towards the tidal prediction data. The effect of El-Nino and La-Nina towards the water levels, average temperature and tidal constituent were also analysed in this study. The study of this phenomena should be emphasized especially in the event that involves the tide. This is because the phenomena that happens is one of the factor that contribute to the change of sea level.
The scope were divided into several stages which are stage of theoretical studies, collection data, processing data and final stage is analysis of data tide in along the year 1992 to 2003.
rising temperature of the earth also has been done to determine how this phenomenon occurs and effects from this phenomenon should have included.
The next stage is involves the activities of collecting data and processing data. There is other type of data that has been used to determine the phenomenon of El-Nino and La-Nina such as in this study it is based on the data of the earth temperature. This study has chosen tidal data for several stations in the coastal Malaysia as the main data to see the effects of the phenomenon of El-Nino and La-Nina on the pattern of tides. Tidal data for several stations that has been chosen will be process by using the UTM-Tidal Analysis and Prediction Software (μ-TAPS).
The last stage is stage of analysis the data of tides. Analysis is carried out by plotting the graph based on amplitude of tidal constituent for M2, S2, K1, O1, Sa, Ssa, Mm, Mf and MSf to see the changing of amplitude between the normal year and year that phenomenon El-Nino and La-Nina occur. There also will be analysis for the changing value of Lowest Astronomical Tide (LAT) based on graph that will be plotted. The comparison also has been carried out to see the difference in pattern of the tides based on the rising temperature of the earth along the year 1992 to 2003 for several area.
2. INTRODUCTION TO TIDES
Tides means the rise and fall of sea levels caused by the gravitational force that produced by the moon and sun. The rotation of the earth is one of the reasons that contribute to tides phenomenon. Other than that, local wind and weather patterns also can affect tides. Human factors such as the expanding of urban development that affect the changing of hydrological characteristics and can disrupt the balance of an ecosystem in a basin (Mohmadisa Hashim et al., 2012). Tides are one of the most reliable phenomena in the world. As the sun rises in the east and the stars come out at night which is caused the rise and fall of ocean waters regularly along our shores. Tides are very long-period waves that move through the oceans in response to the forces exerted by the moon and sun. Tides originate in the oceans and progress towards the coastlines where they appear as the regular rise and fall of the sea surface. When the highest part of the wave reaches a particular location, high tide will occurs. Otherwise, the low tide corresponds to the lowest part of the wave. The difference in height between the high tide and the low tide is called the tidal range. A horizontal movement of water often caused the rising and falling of the tide (NOAA Ocean Service Education, 2008).
The word of tides also described the alternating rise and fall of sea level respect to the land and part of it by the gravitational attraction of the moon and sun. It is shown that the tide events occur not only due to the gravitational force by moon and sun but also influenced by non-astronomical factors which is the movement of currents, waves, temperature, topography of the sea and so on (O'Hargan, 2000). Therefore, the factors that affecting the tides can be classified as astronomical factors and non-astronomical factors.
Tide events occured due to the moon and the sun as their individual gravitational pull the water on earth towards them (Mohd Razali Mahmud et al., 2006). The big spring tides occur when the moon experience the full moon and new moon phase. The position of the earth, moon and the sun are roughly in one line in full moon and new moon phases. The gravitational forces of the moon and sun are working together and have a greater magnetic influence on the water resulting the bigger wave or bulge.
Sea level rise in Malaysia was predicted to be higher due to the local climate change and topographical conditions. Nowadays, people are more aware about the global daily temperature is increasing and this phenomenon where one of the factors contributing to the natural disaster. This temperature increase will have many negative effects such as increased intensity of rain events, storms, floods, and rising sea levels. Tidal measurement is required in order to analyse the sea level trend (Yan et al., 2004; Erol, 2011; Pytharouli and Stiros, 2012). Pytharouli and Stiros (2012) stated that the astronomical tide refers to the oscillation of the sea level as a clarification of numerous periodic effects that leads to a periodic and predictable signal.
2.2 Non-Astronomical Factors
Apart from the astronomical factors, non-astronomical factors also one of the factors that can cause the change in tidal height. Non astronomical factors include the factors such as the change in temperature and climate change. Ocean capable of storing a high heat capacity and oceans are also moving more slowly than the atmosphere. Therefore, although a little changes in climate around us it will have a huge impact on the ocean. Climate change affects not only the ocean but also coastal areas affected by the change in (IPCC, 2014), the change of climates was also influence by human. Any factor that alters the radiation received from the sun or lost to space will affect climate. The sun’s output of energy is known to change over an 11 year of cycles and variations over longer periods occur as well. The most immediate cause of climate changes would be the changes in the total irradiance of the sun.
years. These quantities are most often surface variables such as temperature, precipitation, and wind (IPCC, 2007)
The sun is a constant star when compared with many others in the galaxy. The sun varies in the mount of light it emits by only 0.1 percent over the course of a relatively stable 11 years long pattern known as the solar cycle (Choi, 2013). The sun is the source of the energy that causes the motion of the atmosphere and thereby controls weather and climate and the energy from the sun received at the Earth’s surface will therefore affect climate (Eigiil Friss et al, 1997). In a stable condition, there has to be a balance between the energy received from the sun and energy that the earth radiates back into space. This energy transmits in a form of long wave radiation corresponding to the mean temperature of the earth. from normal surface temperatures can have large-scale impacts not only on ocean processes, but also on global weather and climate.
Every two to seven years, summer sea currents replace the usual cold ocean currents off the west coast of Peru, South America. This oceanic phenomenon known as El-Nino. Ocean warming is found to occur in a wider area encompassing the central and eastern Pacific and has to do with the unusual weather events significant in certain places in the world such as severe flooding and prolonged drought.
El-Nino and La-Nina episodes typically last nine to 12 months, but some prolonged events may last for years. They often begin to form between June and August, reach peak strength between December and April, and then decay between May and July of the following year. While their periodicity can be quite above the earth’s equator. Variations with period less than half a day are called harmonic constituents, cycles of days, months or years are referred to as long period constituents such as Sa, Ssa, Mm, Mf and MSf. Each tidal constituents defined by its period in mean solar hours or alternatively by speed in degrees per observation will produce more number of tidal constituents. The more number of tidal constituent will produce a good predictions of tides. Tidal constituents also known as tidal component or harmonic constituent. Tidal components can be divided into three part such as long term tidal constituents (Mf, Mm, Msa), Diurnal constituents (K1, O1, P1), semi-diurnal constituents (M2, S2, N2, K2), and quarter- diurnal constituents (2SM2, MNS2, MK3, M4, MS4).
Each tidal component has different value of angular velocity. The angular velocity of long term tidal constituents is smaller compare to the diurnal constituents and semi-diurnal constituents. Long term tidal constituents need a long measured tidal record to be analyse and the selection of tidal constituents depending on the length of observe tidal data obtained (Mohd Hilmi Abdullah, 2012).
Tidal constituents were obtained from harmonic analysis from the measured tidal record. Each tidal constituents has two harmonic constant known as amplitude (H) and phase (g) which contain numerical value. Tidal constituents were related to the periodic change of relative position of the earth, sun and moon.
2.5 Tidal Analysis and phase is usually expressed in degrees.
Tidal analysis is carried out to obtain the value of tidal constituent which is consist parameters of amplitude, phase and period. The value of amplitude and phase are referred to as harmonic constants. Tidal constituents can be included in a harmonic analysis depends on the length of the observation data. The longer the time of observation data the more tidal constituents can be included in the analysis and the more accurate the tidal predictions (Parker, 2007).
3. METHODOLOGY
Methodology was carried out stage by stage in a systematic way. Each stage was carried out by following the steps that were set in planning the study method. There were step by step that has been set up for each stage. Moreover, it also used as a guideline to complete this research. Every stage will be discussed in detail in the next section.
3.1 Data Planning
has been established by Department of Surveying and Mapping Malaysia (JUPEM). However, there is only five stations that involved in this study. The selected stations were located at Chendering (Terengganu), Johor Bharu (Johor), Port Kelang (Selangor), Teluk Ewa, (Kedah) and Kota Kinabalu (Sabah). Figure 3.1 shows the position of tidal stations that were selected for this study.
Figure 1. Tidal station that has been chosen in this research
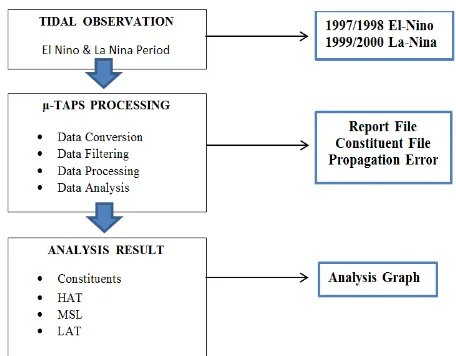
In planning stage, the suitable tidal software has been chosen in this study to process the tidal data for tidal station. Tidal software that has been chosen is UTM-Tidal Analysis and Prediction Software (μ-TAPS). This software used harmonic analysis to carry out the various water levels and tidal constituents. Tidal constituents that carry out from this software based on the period of the data observation. Once the data has been downloaded, the software performed the following tasks:
a) Data conversion: Raw tidal data from JUPEM are converted into µ-TAPS format.
b) Data filtering: Filtering tidal data to avoid processing error that will affect the result of tidal processing and analysis. c) Tidal processing and analysis: Clean tidal data are used in
processing and will generate tidal constituents, propagation errors and estimate the various water levels.
Figure 2. Flow chart of tidal processing using µ-TAPS Software to define characteristics of tidal pattern during
El-Nino and La-Nina Phenomena
3.1 Data Collection
Data collection is most important stage in this research. The data involved in this research such as tidal data. Tidal data will used in this whole research from the beginning of the process until the output of the final result which is tidal data obtained from Department of JUPEM. Only the tidal data from the chosen area such as Chendering (Terengganu), Johor Bharu (Johor), Port Kelang (Selangor), Langkawi (Kedah) and Kota Kinabalu (Sabah) will be used in this research. Figure 3 below show the sample of the raw data obtained from the Department of JUPEM.
Figure 3. Raw Data from JUPEM
The raw data show the depth of water for every hour which is there are 24 list of depth with interval of 1 hour. This data were used for tidal processing and analysis to produce the amplitude of tidal constituents. When data collection needed is complete, the next stage is the stage of data processing. This stage is about methods to get the view of tidal pattern through the tidal data to see the effect of solar storm to the tide.
3.2 Data Processing
This stage involved the processing of tidal data. This processing will be carried out to see the tidal pattern at the chosen area of research. Tidal constituents (M2, S2, K1, O1, Sa, Ssa, Mm, Mf and MSf) were generated based on the processing using the data observation of one year for the chosen station.
As mentioned in planning research, tidal data processing used the UTM-Tidal Analysis and Prediction Software (μ-TAPS) to get the amplitude of tidal constituents. A tidal constituent is important to generate the predicted data. Based on amplitude of tidal constituents, the pattern and changing of the amplitude can be seen where there is the biggest changing of amplitude due to the effect of the phenomenon El-Nino and La-Nina.
3.3 Analysis of the Data
study which is the graph based on of tidal constituents were plotted to view the changes of the amplitude of tidal constituent along the year 1992 to 2003. This analysis was carried out to see whether the phenomenon give the effects to the tidal constituents in a long term trend based on meteorology effects within the changing amplitude of the tidal constituents. There are several tidal constituent that will be discussed in this research such as M2, S2, K1, O1, Sa, Ssa, Mm, Mf and MSf from year 1992 to 2003. Every tidal constituent referred to their own characteristics such as the position of moon and sun and other meteorology effects. There also analysis for the value of Mean Sea Level and Lowest Astronomical Tides that has been produce from the GeoTide to see the effect of the phenomenon to Mean Sea Level.
4. RESULT AND ANALYSIS
Tidal data from year 1992 to 2003 have been processed using UTM-Tidal Analysis and Prediction Software (μ-TAPS) for all stations that have been chosen in this research. In this analysis, only focus on several tidal constituents such as M2, S2, K1, O1, Sa, Ssa, Mm, Mf and MSf. Each constituent will influence the phenomenon of tides which is M2 referred to the movement of earth to the moon and S2 referred to the movement of earth to the sun. For K1 and O1, it refers to the declination of the moon. Sa and Ssa refers to the activity of the sun where only the data that exceeds 6 months or a year can produce the Sa and Ssa. In this research, the effect of Sa and Ssa can be seen due to the phenomenon of El-Nino La-Nina that occur more than 6 months.
A few graphs were plotted based for each tidal station on the value of tidal constituents and the value of Mean Sea Level and Lowest Astronomical Tides. Graph constituents were plotted to view the changes of the amplitude of tidal constituent along the year 1992 to 2003. The graph on the Indian Spring Low Water and Lowest Astronomical Tides also produced in order to see patterns of ISLW and LAT during the phenomenon occur.
4.1 The Changing value of amplitude based on Tidal constituent (M2, S2, K1, O1, Sa, Ssa, Mm, Mf and MSf)
The tidal data for each station that have been processed will generated the amplitude value of tidal constituents such as M2, S2, K1, O1, Sa, Ssa, Mm, Mf and MSf. The changing and the pattern of amplitude for every station along the year 1992 to 2003 can be seen through the graph that has been plotted. The graph plotted showed the amplitude for every tidal constituent of M2, S2, K1, O1, Sa, Ssa, Mm, Mf and MSf each of the station (Teluk Ewa, Port Kelang, Johor Bharu, Chendering and Kota Kinabalu.
Every tidal constituent have their own characteristic that give effect to the tide phenomenon. Each of tidal constituent depends on the period of the observation data which is for Sa, Ssa, Mm, Mf and MSf need a long observation data to generated the amplitude value. This research used the observation data for one year starting from 1992 to 2003 and all the value amplitude of
the tidal constituent that involved can be generated based on a long period of observation. In this chapter, there will be analysis for every tidal constituent each of tidal station based on the graph plotted to see whether the phenomenon of the El-Nino and La-Nina gives effect to the tidal constituent. This effect of El-Nino and La-Nina based on meteorology effect can be seen between years 1997 to 2000 which is the occurrence of the phenomenon is strong.
Figure 4. Graph of Tidal Constituent for M2
Figure 4 shows the graph plotted based on the tidal constituent of M2 for each station. The pattern of the tidal constituent on M2 can be seen which is the pattern was constant. It shows that the phenomenon of El-Nino and La-Nina that occurs between year 1997 to 2000 does not gives effect on this tidal constituent. The effect cannot be seen because this tidal constituent characteristics is represents the rotation of earth with respect to the moon. The phenomenon of El-Nino and La-Nina closely related to the sun’s activity based on the temperature on earth.
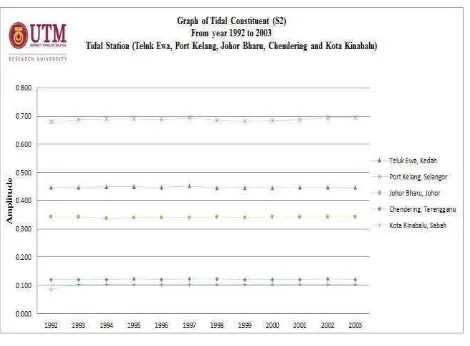
Figure 5. Graph of Tidal Constituent for S2
due to the characteristics of this tidal constituent which is representing the rotation of earth respect to the sun. This tidal constituent only emphasized on the rotation of earth so that there are no effects that can be seen.
Figure 6. Graph of Tidal Constituent for K1
Figure 6 above show that the graph of tidal constituent for K1. The pattern for this tidal constituent is constant and does not have a big changing of amplitude. It can be stated that there are no effect of El-Nino and La-Nina on this tidal constituent. These tidal constituents were related to express the effect of moon’s declination so there are no effects that can be seen.
Figure 7. Graph of Tidal Constituent for O1
Figures 7 represent the graph plotted of tidal constituent for O1. The pattern for this tidal constituent was constant from year 1992 to 2003 including the year that the phenomenon of El-Nino and La-Nina occurs in between year 1997 to 2000. There no effect of phenomenon El-Nino and La-Nina on this tidal constituent.
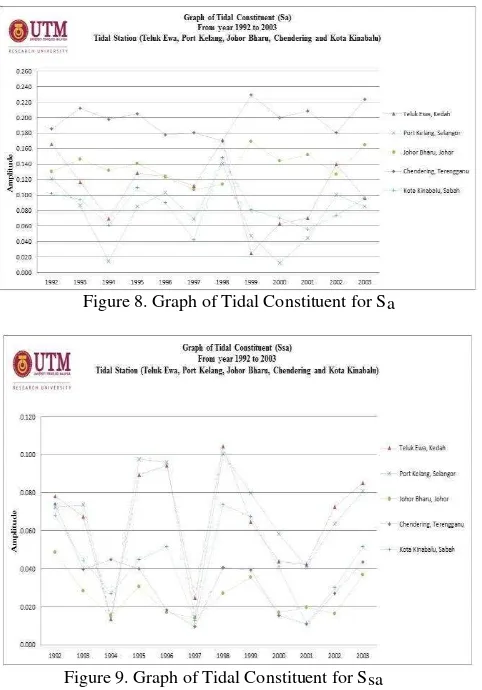
Figure 8 shows the graph of tidal constituent for Sa. The above graph shows that in year 1994, there are big changing value of amplitude for station Teluk Ewa, Port Klang and Kota Kinabalu. The value of amplitude at station Teluk Ewa, Port Kelang and Kota Kinabalu were decrease in year 1994. Based on my research, there also has the occurrence phenomenon of El-Nino. El-Nino occurred in moderation in year 1994 but the effect can be seen only at station of Teluk Ewa, Port Kelang
and Kota Kinabalu due to the position of the station to the sun. The biggest effect also can be seen in year 1998 for the same station which is the occurrence of La-Nina.
Figure 8. Graph of Tidal Constituent for Sa
Figure 9. Graph of Tidal Constituent for Ssa
Figure 9 show that the graph of tidal constituent for Ssa. The pattern for the value of amplitude for Ssa can be seen which is there are big reduction value of amplitude in 1997. Based on this study, there is occurrence of El-Nino in 1997 which is every station approaching the point to the same place. There are big effects that can be seen of El-Nino for Ssa compare to the tidal constituent of Sa because Ssa representing a semi-annual cycle of the mean sea level so there are two cycles per year. There need 185 days which is approximately to 6 months of data observation to generated this tidal constituents. The effects of Ssa can be seen clearly in 1997 because the period of phenomenon El-Nino and La-Nina occurs in 6 months.
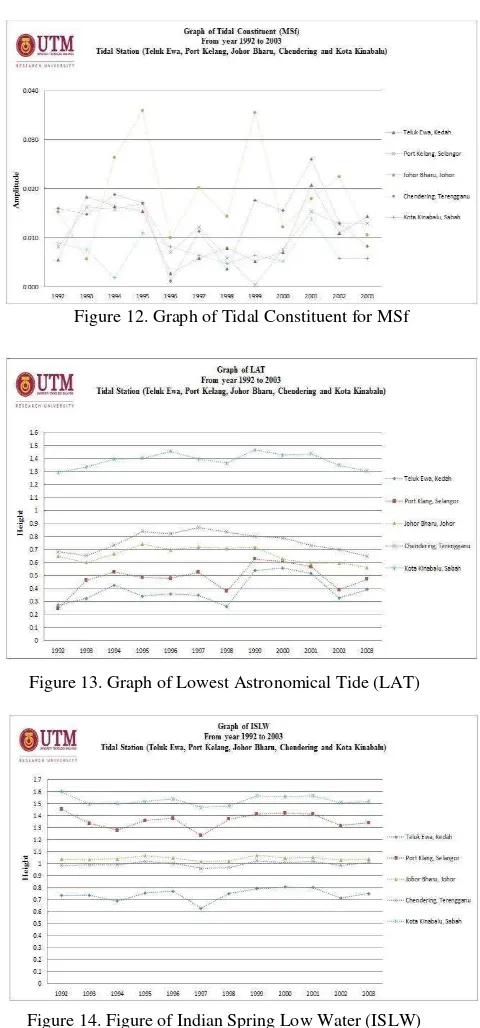
Figure 10, 11 and 12 represent the graph plotted on value of amplitude for the tidal constituent of Mm, Mf and MSf. This tidal constituent can be classified as the long period ocean tide constituent which is it can be generate based on the long period of observation. The tidal constituent of Mm representing a monthly cycle of the mean sea level while Mf representing the fortnightly constituent. This tidal constituent only limited to those latitude within ±66 degrees which is the station chosen included within that latitude.
the amplitude is always changing every year along 1992 to 2003. Other than that, the Figure 11 represents the graph plotted based on tidal constituent for Mf. The effect of El-Nino can be seen where in the year of 1997, the amplitude changing and were pointed approximately to the same point. The amplitude in year 1997 was higher in the occurrence of phenomenon El-Nino. Figure 12 show the graph of tidal constituent for MSf. There also no effect of phenomenon El-Nino/La-Nina because there are always changing of amplitude along the year 1992 to 2003. The pattern of amplitude can be seen always increase and decrease between the year 1992 to 2003 but the big changing of amplitude can be seen for station at Johor Bharu in year 1999 where the phenomenon of La-Nina occur.
Figure 10. Graph of Tidal Constituent of Mm
Figure 11. Graph of Tidal Constituent for Mf
The above Figure 13 shows the graph of the Lowest Astronomical Tide (LAT) for every station along the year 1992 to 2003. From the graph shown, the pattern for the value of LAT can be seen which is there are big changing of value in year 1998 for station of Port Kelang, Selangor and Teluk Ewa, Kedah. Based on this study, there are occurrences of La-Nina in year 1998. Based on the graph, the phenomenon of La-Nina gives effect towards the value of LAT for certain station based on the position of the station from the sun. The changing value of LAT can give impact to the data prediction in the next year.
Figure 12. Graph of Tidal Constituent for MSf
Figure 13. Graph of Lowest Astronomical Tide (LAT)
Figure 14. Figure of Indian Spring Low Water (ISLW)
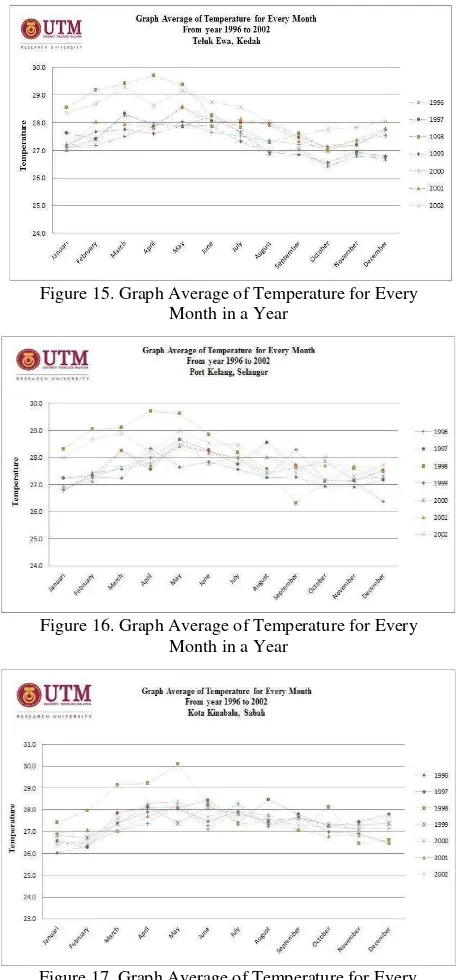
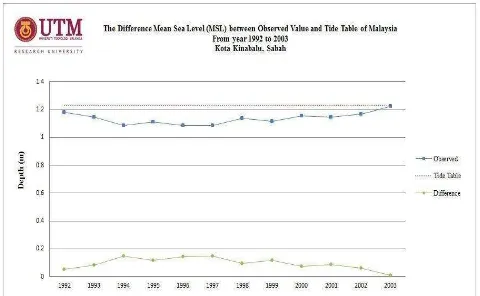
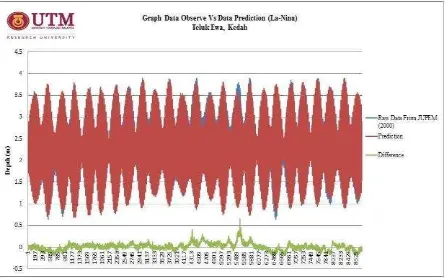
Figure of 15, 16 and 17 represent the graph plotted based on the temperature for every month in a year. The pattern for the temperature of area Teluk Ewa, Port Kelang and Kota Kinabalu can be seen. The temperature can be seen increasingly in year 1998 for all area. Based on this study, with the presence the phenomenon of El-Nino, the temperature increase can be seen in certain areas that have been selected in this study in year 1998. In this analysis, average temperature can be shown only in a certain area because the data of average temperature that gets from the Department of Meteorology only for the area of Teluk Ewa, Port Kelang and Kota Kinabalu.
Figure 15. Graph Average of Temperature for Every Month in a Year
Figure 16. Graph Average of Temperature for Every Month in a Year
Figure 17. Graph Average of Temperature for Every Month in a Year
Based on Figure 15, there is increasing of temperature in 1998 up to 29.7°C at the area of Teluk Ewa while in Figure 16, there is increasing of temperature up to 29.7°C in the area of Port Kelang in the same year. Figure 17 show that the higher temperature in year 1998 were increases up to 30.1°C near area Kota Kinabalu. Based on all area, it can be seen that there are big effects of El-Nino on average temperature in year 1998 where the phenomenon of El- Nino occur.
4.2 The Difference Mean Sea Level (MSL) between Observed Value and Tide Table of Malaysia
The different between Mean Sea Level (MSL) between observed value and the value from Tide Table of Malaysia were discussed in this section. The graph of Mean Sea Level (MSL) for every tidal station in this study was plotted. The pattern of the Mean Sea Level (MSL) was illustrated in the graph plotted to see whether the phenomena El-Nino and La-Nina gives effect towards the Mean Sea Level (MSL).
The Figures below show the graphs for the different between Mean Sea Level observed value and Tide Table of Malaysia along the year 1992 to 2003 including the year of El-Nino and La-Nina occur. The graph were plotted for every tidal station that were chosen in this study such as Chendering (Terengganu), Johor Bharu (Johor), Port Kelang (Selangor), Teluk Ewa, (Kedah) and Kota Kinabalu (Sabah). However, there are only several station having a big difference of value Mean Sea Level (MSL) between observed value and value from Tide Table of Malaysia.
Figure 18 and Figure 19 illustrates the graph of difference Mean Sea Level (MSL) at tidal station of Teluk Ewa (Kedah) and Port Kelang (Selangor). The maximum difference can be seen at station Teluk Ewa (Kedah) and Port Kelang (Selangor). The highest difference at Teluk Ewa, Kedah was 0.147 in year 1998 where the strong El-Nino occurs while the highest difference for Port Kelang, Selangor was 0.247 also in year 1998.
Figure 19. Graph of Difference Mean Sea Level (MSL) between Observed Value and Tide Table of Malaysia at
Port Kelang, Selangor.
The graph plotted for tidal station of Chendering (Terengganu), Johor Bharu (Johor) and Kota Kinabalu (Sabah) was shown in Figure 20, Figure 21 and Figure 22. There are small differences that can be seen at station Chendering (Terengganu), Johor Bharu (Johor) and Kota Kinabalu (Sabah).
Figure 20. Graph of Difference Mean Sea Level (MSL) between Observed Value and Tide Table of Malaysia at
Chendering, Terengganu.
Figure 21. Graph of Difference Mean Sea Level (MSL) between Observed Value and Tide Table of Malaysia at Johor Bharu,
Johor.
Figure 22. Graph of Difference Mean Sea Level (MSL) between Observed Value and Tide Table of Malaysia at Kota Kinabalu,
Sabah.
This tidal station of Chendering, Johor Bharu and Kota Kinabalu show the highest difference value of Mean Sea Level (MSL) occur in the same year which is year 1997. There are occurrences of El-Nino in year 1997. The highest difference value for Chendering, Johor Bharu and Kota Kinabalu was 0.130, 0.094 and 0.146.
4.3 Graph Comparison between Observed Data (El- Nino and La-Nina and Prediction Data
The prediction was generated in this study based on the tidal data of El-Nino and La-Nina. This section discussed about the comparison between the observed data (El-Nino and La-Nina) and prediction data that were generated from the tidal data of El-Nino and La-Nina. The graph of comparison were plotted in year 1999 and 2000 for tidal station of Teluk Ewa, Kedah.
Figure 23. Graph of Comparison between Data Observed and Data Prediction (El-Nino).
prediction made using the data that has El-Nino will cause the pattern of the prediction below to the observed data. The phenomenon of El-Nino gives effect towards the prediction data that were generated. Figure 24 shows the graph plotted to see the difference between observed data and prediction data. The comparison were made between the observed data and predicted data. The prediction data was generated using the data consist of La-Nina in year 1999. Based on the graph in Figure 22, there was a small difference between observed data and prediction data. The average difference for the observed data and prediction data is 0.0149 and the highest difference is 0.66. It shows that La-Nina gives a small effect towards the prediction data because of the occurrence of La-Nina in early stage in year 1999.
Figure 24. Graph of Comparison between Data Observed and Data Prediction (La-Nina)
5.0 CONCLUSION
This study was carried out to investigate the effect of the phenomenon El-Nino and La-Nina towards the tidal constituents. A tidal constituent is an important component in generating the prediction of tide. It shows that the phenomenon of El-Nino and La-Nina gives an impact on certain tidal constituent in this study. The data observation were used by one year so that many tidal constituents can be generated and only focus on certain tidal constituents such as M2, S2, K1, O1, Sa, Ssa, Mm, Mf and MSf. There also the comparison of the temperature at a certain station between a normal year and a year of El-Nino and La-Nina. El-Nino and La-Nina also gives impact towards the temperature which is the temperature increase in the year of El-Nino happens. This study can help to identify the meteorology effect on tide. It shows that the prediction that made based on the data observation in year of El-Nino and La- Nina need to be investigated before it is used to generate the prediction. Overall, this study has provided a clear picture of the effects of El-Nino and La-Nina in tidal data and prediction of tides.
ACKNOWLEDGEMENT
The authors would like to express a million thank and grateful
to the Department of Surveying and Mapping Malaysia for giving the tidal data in this study purpose. This accomplishment of this paper would not have been possible without the tidal data.
REFERENCES
Choi, C. Q. (2013, January 16). SPACE.COM. Retrieved May 9, 2015, from Tiny Solar Activity Changes Affect Earth's Climate: http://www.space.com/
Eigil F. H. S. (2001). Danish Meteorological Institute. Retrieved May 10, 2015, from Solar Terrestial Physics Division: http://www ssc.igpp.ucla.edu/
Erol, S. (2011). Time-Frequency Analyses of Tide-Gauge Sensor Data. Sensors 11:3939-3961
Hashim, Mohmadisa, Mohamad Suhaily Yusri Che Ngah, and Nasir Nayan. "Trend hujan jangkamasa panjang dan pengaruhnya terhadap hakisan permukaan: Implikasinya kepada tapak kampus baru Sultan Azlan Shah, Tanjong Malim." Geografia: Malaysian Journal of Society and Space 8.2 (2012): 38-51.
Intergovernmental Panel on Climate Change. (2014). Retrieved May 10, 2015, from IPCC Fourth Assesment Report: Climate Change 2007: http://www.ipcc.ch/
Mohd Hilmi Abdullah, Mohd Razali Mahmud (2015). Variations of Sea Level and Tidal Behaviour during El- Nino/La-Nina: An Example of Malaysian Coastline. 108-118.
Mohd Hilmi Abdullah (2012). Pengaruh Fenomena El-Nino dan La-Nina Terhadap Corak Pasang Surut Di Malaysia. Johor Bharu: Universiti Teknologi Malaysia.
Mohd Razali Mahmud, Rusli Othman, Usmuni Din (1998).
Application of Real Time Tidal Acquisitin and Processing System for Hydrographic Survey and Dredging Operation. Johor: Universiti Teknologi Malaysia.
Mohd Razali Mahmud and Tan Tai Hung (2006). Tides During Monsoon Season in Peninsular Malaysia. Universiti Teknologi Malaysia.
National Oceanic & Atmospheric Administration. (2013, Oct 15). Retrieved May 05, 2015, from Tides & Currents: http://tidesandcurrents.noaa.gov/
National Oceanic and Atmospheric Administration. (2014). Retrieved June 11, 2015, from What are El-Nino and La-nina?: Sea. Survey Review 44(326): 239-246.