CARBON SEQUESTRATION ESTIMATION OF STREET TREES BASED ON POINT
CLOUD FROM VEHICLE-BORNE LASER SCANNING SYSTEM
Y. Zhao, Q. Hu
School of Remote Sensing and Information Engineering, Wuhan University, Wuhan 430079, China- [email protected]
KEY WORDS: Vehicle-borne Laser Point Cloud, Street Trees, Geometric Parameters, Carbon Sequestration
ABSTRACT:
Continuous development of urban road traffic system requests higher standards of road ecological environment. Ecological benefits of street trees are getting more attention. Carbon sequestration of street trees refers to the carbon stocks of street trees, which can be a measurement for ecological benefits of street trees. Estimating carbon sequestration in a traditional way is costly and inefficient. In order to solve above problems, a carbon sequestration estimation approach for street trees based on 3D point cloud from vehicle-borne laser scanning system is proposed in this paper. The method can measure the geometric parameters of a street tree, including tree height, crown width, diameter at breast height (DBH), by processing and analyzing point cloud data of an individual tree. Four Chinese scholartree trees and four camphor trees are selected for experiment. The root mean square error (RMSE) of tree height is 0.11m for Chinese scholartree and 0.02m for camphor. Crown widths in X direction and Y direction, as well as the average crown width are calculated. And the RMSE of average crown width is 0.22m for Chinese scholartree and 0.10m for camphor. The last calculated parameter is DBH, the RMSE of DBH is 0.5cm for both Chinese scholartree and camphor. Combining the measured geometric parameters and an appropriate carbon sequestration calculation model, the individual tree’s carbon sequestration will be estimated. The proposed method can help enlarge application range of vehicle-borne laser point cloud data, improve the efficiency of estimating carbon sequestration, construct urban ecological environment and manage landscape.
1. INTRODUCTION
Rapid development of urban modernization, continuous development of transportation and auto industry cause several environmental problems in cities, such as air pollution, heat island effect, green house effect, noise pollution and so on. These problems seriously affect the quality of people’s life.
Street trees are important for urban ecological environment. They can be huge carbon storage in the city. Furthermore, the street tree has functions of purifying the air, improving urban climates, alleviating the green house effect and maintaining carbon-oxygen balance. Carbon sequestration can measure the carbon fixation capacity of trees, and it is one of the criteria for judging ecological benefits as well. Since the 20th century, both domestic and foreign scholars have researched on urban street trees. Shi (2010) evaluated carbon fixation capacity of street trees from tree species, structure of tree planting and some other aspects.
The vehicle-borne laser scanning system can quickly acquire data with high precision, and the acquiring process wouldn’t be affected by weather. The system can record spatial information of the objects on the street while the vehicle is traveling along the street. The trunk and crown of street trees will be depicted thoroughly (Yang et al., 2014). Vehicle-borne laser scanning technology is widely applied in urban construction management. Fang et al. (2013) used the laser scanning data to automatically extract structured roads. Yang et al. (2012) presented a novel method to automatically extract street-scene objects from mobile LiDAR point clouds. And Wei et al. (2012) conducted a research on vehicle-borne laser point cloud to propose a method to identify building footprints rapidly. There are also numerous applications of Laser scanning technology in forest ecology and urban ecology. A new analysis technique, spatial wavelet analysis (SWA), was proposed to automatically estimate the location, height, and crown width (Falkowski et al. 2006). Olive
trees biomass was estimated by utilizing airborne laser point cloud (Estornell et al., 2015). Stem biomass of individual trees is studied in the research of Yu et al. (2013). They investigated two biomass estimation models, which are based on DBH and the sum of the stem section volume respectively. The results of the research indicated that the reconstructed stem from TLS point clouds can assess stem biomass automatically and accurately. Sirmacek et al. (2015) use a probability matrix computation based algorithm to classify the points into ‘tree’ and ‘non-tree’ classes, and the locations of tree trunks can be determined. Thus, the algorithm can be applied for tree growth observation and tree counting. Bright et al. (2012) used field observations, LiDAR data, and multispectral imagery to quantify aboveground carbon stocks affected by mountain pine beetle. And high-spatial resolution hyperspectral imagery and LiDAR data fusion was conducted to map urban tree species (Alonzo, 2014).
Compared with the traditional way to estimating carbon sequestration of street trees, the way using point clouds can obtain information more quickly, and acquire more accurate geometric parameters and carbon sequestration. It’s significant for ecological environment construction. Reliable and accurate methods for detection of trees in terrestrial laser scanner data and determination of DBH, tree height and other characteristics have been proposed in previous research (Maas et al., 2008).
2. MATERIALS AND METHODS
2.1 Study Area and LiDAR Data
The study area is LiuFangYuan East Road which is located in Wuhan East Lake hi-tech development zone and adjacent to the Lenovo Industrial Base. We acquire point cloud data of about 300m of the road by using vehicle-borne laser scanning system. The point cloud data collection took place in December, 2015. The obtained point cloud has high quality, and street trees, street lamps, road signs and other objects can be easily distinguished. These objects also have clear outlines. The street trees of LiuFangYuan Road are basically broad-leaved trees, and the tree species mainly include camphor (Cinnamomum camphora) and Chinese scholartree (Sophora japonica Linn.). Street trees
which grow well and own obvious characteristics are selected as the experimental trees.
The crown shapes of most street trees are like umbrella. By observing the point cloud data of street trees, we found that the point cloud of crown and the point cloud of trunk can be easily separated. If the point cloud of the street tree is projected onto the two-dimensional plane, the fact that the point density in centric area is much higher than the point density in the surroundings will be found, as shown in Figure 1(a). Figure 1(b) shows that the outline of the two-dimensional point set is approximate to a circle or an ellipse.
(a) (b)
Figure 1. Two-dimensional point set: (a) Point density in center and surroundings; (b) Outline of the two-dimensional point set
2.2 Extract Point Cloud Data of An Individual Tree The extraction of an individual tree is finished by point cloud process software. CloudCompare software is utilized to open the original vehicle-borne laser point cloud data, and the street trees with clear outline and complete structure will be chosen, then the street trees will be extracted with the cutting tool. Figure 2 shows the point cloud of eight individual trees. The former four trees are Chinese scholartree, and the latter four trees are camphor.
Figure 2. Point clouds of eight individual trees
2.3 Geometric Parameters Measurements
2.3.1 Tree Height Calculation: There are two measuring methods for trees with different DBH (Diameter at Breast Height). For trees with large DBH and lush foliage, tree height can be calculated by following steps:
1) Create two-dimensional grid: Calculating the extremes of X coordinates and Y coordinates, and appropriate grid interval will be selected to divide two-dimensional grids. The grid directions respectively. ΔX and ΔY represent the grid interval in X and Y directions, and they generally have the same value.
2) Point cloud projection: Traversing each point in the point cloud of an individual street tree and the point will be projected into corresponding grid. Formula (2) shows the way to find the corresponding grid of a point. the corresponding grid will be found.
3) Point density statistics: Point density is the number of points in each grid.
4) Tree height calculation: Sorting the statistical results of point density, and choosing three grids with the largest point density, then the difference between the maximum height and the minimum height in these three grids will be calculated. The average of the three height differences will be regarded as the tree height. Formula (4) enables to obtain the final tree height.
where ΔZ1, ΔZ2 and ΔZ3 represent the height differences in three grids respectively.
For trees with small DBH, we use the method proposed by Wu et al. (2013) to calculate tree height. After traversing each point in the point cloud, the points with the maximum height (Zmax) and the minimum height (Zmin) will be found and the difference between Zmax and Zmin will be regarded as tree height, as process easier. The point clouds will be separated by following steps:
1) Height reversal: The maximum height of point cloud subtracts the heights of each point in the point cloud, and the height of crown point cloud will decrease, while the height of trunk point cloud will increase. In this case, we can begin processing from trunk point cloud which is much easier to deal with. Figure 3 shows the height reversal process.
Figure 3. Height reversal process
2) Point cloud separation: Appropriate height interval is selected according to the tree height. After finishing height reversal, the height of trunk bottom will be regarded as initial height and the point cloud of street tree will be divided into several parts vertically. Point cloud of each part will be projected onto the two-dimensional plane, meanwhile, the maximum distance between projected points can be found. A sudden change of the maximum distance will occur when the point cloud segment transit from trunk to crown, thus the point cloud of trunk and crown can be separated. Figure 4 shows the sudden change of the maximum distance in projection plane.
Figure 4. The sudden change of maximum distance occurs
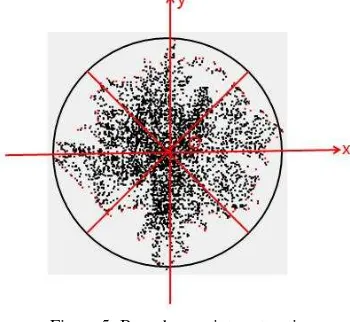
2.3.3 Crown Width Calculation: When the point cloud of the barycentric coordinates of projected points should be calculated. Secondly, the coordinates of each projected point will subtract barycentric coordinates, and the relative coordinates of each projected point will be obtained. Thirdly, a Cartesian coordinate system will be created with barycentric coordinates as the origin coordinates. We use the angle as the variable. Picking out points in a certain range of angles at a time, the distance between each point and the barycenter will be calculated. The point that has the largest distance with barycenter is confirmed as a boundary point. Connect all the boundary points and the boundary of projected point set will be formed. Formula (6), Formula (7) and Formula (8) can be used to calculate barycentric coordinates, relative coordinates of each projected point and the distances between the projected points and barycenter respectively. And Figure 5 is the schematic diagram of the extraction of boundary points.
N
Y represent the relative coordinates of projected points.
crown width, an ellipse is fitted to the boundary points. Once the ellipse found, the lengths of long axis and short axis will be calculated, and the average of these two axes is regarded as the average crown width. In this paper, the ellipse fitting algorithm proposed by Fitzgibbon et al. (1999) was used to fit an ellipse for boundary points. The result of ellipse fitting is shown in Figure 6. And figure 7 shows the whole process of crown width calculation.
Figure 6. Ellipse fitting result
Figure 7. The work flow of crown width calculation
2.3.4 DBH Calculation:The points at breast height are quite sparse, and the number of points is limited. Only using the points at breast height may result in some accidental errors. Given that most street trees have trunks with regular shapes, we divide the trunk point cloud into several segments, project these points onto two-dimensional plane and calculate the diameter of each trunk segment. The maximum distance between the projected points in the segment is regarded as the diameter. And the average of trunk diameters will be regarded as DBH. The specific steps as follow:
1) Divide and project the trunk point cloud: First, an appropriate height interval should be selected. Second, the point cloud will be divided into several segments in vertical direction according to the interval. Then each point cloud segment is projected onto two-dimensional plane.
2) The maximum distance between the projected points needs to be calculated.
3) Calculate DBH: DBH is the calculating result of the average of the maximum distances in all segments.
2.4 Carbon Sequestration Calculation
The geometric parameters, tree height and DBH, are applied to estimate carbon sequestration. The specific steps as follow:
1) Calculate the volume of an individual street tree: Referring to the tree volume table which created by the Ministry of Agriculture of the People’s Republic of China enables to find the volume calculation formula. According to the tree species and the region that the trees located, the corresponding volume calculation formula can be found. Formula (9) (Ministry of Agriculture and Forestry of P.R. China, 1978) shows the volume calculation formula of northern subtropical broad-leaved trees.
V = 0.000050479055D1.9085054H0.99076507 (9)
where V represents volume, D is DBH and H is tree height.
V V B
0038 . 0 6539 .
0
(10)
V V B
0026 . 0 7883 .
0
(11)
where B represents biomass and V represents volume.
3) Calculate the carbon sequestration of an individual street tree:
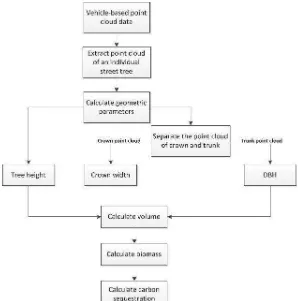
Carbon sequestration will be obtained by multiplying the biomass and the conversion coefficient of carbon content. Different tree species have different coefficients, but their values are generally between 0.45 and 0.55 (Huang, 2015). The average conversion coefficient of broad-leaved trees is 0.4937 (Huang, 2015) and the coefficient is applied to calculate the carbon sequestration. Figure 8 shows the overall process of calculating carbon sequestration.
Figure 8. The overall process of calculating carbon sequestration
3. RESULTS
Chinese scholartree in study area is in defoliation stage during data acquisition period, so there is little foliage on the trees. Additionally, the selected Chinese scholartree has small DBH, thus the difference between the maximum height and the minimum height is taken as the tree height. While camphor has larger DBH, the density projection method is adopted when calculateing tree height. Table 1 shows the results of tree height calculation. The measured tree height is used to evaluate the precise of calculated tree height, and it’s obtained by field measurement. The results show the calculated tree height have quite high precise.
Crown widths in X direction and Y direction as well as the average crown width are calculated by the mentioned method. The average measured crown width is the average of measured crown width in X and Y directions. The calculated results are compared with the field measured results. The crown width calculation results can be seen in Table 2.
After comparing the results calculated from several segmenting intervals, the interval is set as 0.3m to divide the trunk point cloud. And the trunk’s diameter of each point cloud segment is
calculated. The average of these diameters is taken as the DBH. The DBH calculation results can be seen in Table 3.
Combining formula (9) and the geometric parameters, the volume of trees will be obtained. Biomass can be calculated according to formula (10) and (11). Then multiply the biomass and the conversion coefficient of carbon content (0.4937), and the carbon sequestration per street tree can be obtained. The calculation results are shown in Table 4. The carbon sequestration of different trees can be evaluated according to the results.
4. DISCUSSION
trunk is taken into account.
The calculated crown widths in both X and Y directions are in good agreement with the measured crown widths, the average crown width is quite different though. The difference relates to the irregularity of the crown shape, and the measured average crown width which calculated by two specific direction can’t describe the crown precisely. The irregularity of the crown shape also results in different crown width in all directions. The traditional way to calculate crown width is to measure the crown widths in north-south direction and east-west direction, and the average of these two crown widths is taken as the final crown width. The crown width calculated in such way ignores the overall shape of the crown. In this study, the crown width calculated by ellipse fitting is more representative, and the crown width in different directions can be calculated as well.
The carbon sequestration of different trees calculated in this study can be evaluated. Observing the results of the two groups of trees in the study, and the fact that camphor has larger carbon sequestration than Chinese scholartree is found. Camphor trees in this study have much larger DBH than Chinese scholartree, and Chinese scholartree has larger tree height than camphor. Although the biomass calculating formulas for the two tree species are different, the DBH considerably affects the amount of carbon sequestration, which means the trunk make great contributions to the amount of carbon sequestration. Using the method proposed in this paper to calculate carbon sequestration of street trees, the relative amount of carbon sequestration of different trees can be obtained, and the results can offer some suggestions for road environmental construction, such as helping select proper tree species for street trees.
Table 1. Tree height calculation results
Table 2. Crown width calculation results
Table 3. DBH calculation results
Table 4. Carbon sequestration calculation results
5. CONCLUSION
In this study, the method of using vehicle-borne point cloud to calculate carbon sequestration of an individual street tree shows relatively high calculating efficiency and accuracy. Compared with the traditional geometric parameters measuring method and carbon sequestration calculating method, the method
proposed from the study can quickly acquire the geometric parameters, the crown width in different directions can be obtained as well. And the calculated geometric parameters are applied to calculate carbon sequestration. The whole process reduces the time cost and improves the calculating efficiency. The study is still in the primary stage. In the following stages, the method to calculate the carbon sequestration of the street trees in a road at a time will be studied. The quantity of point
Chinese scholartree No. 1 2 3 4 Camphor No. 1 2 3 4
Measured tree height(m) 5.46 5.45 5.20 5.30 Measured tree height(m) 4.64 4.12 5.56 4.47 Calculated tree height(m) 5.53 5.54 5.11 5.13 Calculated tree height(m) 4.58 4.06 5.47 4.43
Difference(m) -0.07 -0.09 0.09 0.17 Difference(m) 0.06 0.06 0.09 0.04
RMSE(m) 0.11 RMSE(m) 0.02
Chinese scholartree No. 1 2 3 4 Camphor No. 1 2 3 4
Crown width in X direction
Measured(m) 1.97 0.92 1.34 1.53 Crown width in X direction
Measured(m) 1.28 1.19 1.96 1.02 Calculated(m) 1.83 0.87 1.26 1.25 Calculated(m) 1.31 1.20 2.08 1.08 Difference(m) 0.14 0.05 0.08 0.28 Difference(m) -0.03 -0.01 -0.12 -0.06
RMSE(m) 0.09 RMSE(m) 0.04
Crown width in Y direction
Measured(m) 2.01 1.59 1.68 2.00 Crown width in Y direction
Measured(m) 1.43 1.27 2.30 1.17 Calculated(m) 2.06 1.52 1.56 1.93 Calculated(m) 1.45 1.21 2.22 1.11 Difference(m) -0.05 0.07 0.12 0.07 Difference(m) -0.02 0.06 0.08 0.06
RMSE(m) 0.06 RMSE(m) 0.04
Average crown width
Measured(m) 1.99 1.26 1.51 1.77 Average crown width
Measured(m) 1.36 1.23 2.13 1.10 Calculated(m) 1.79 1.38 1.93 1.86 Calculated(m) 1.42 1.09 1.91 1.04 Difference(m) 0.20 -0.12 -0.42 -0.09 Difference(m) -0.06 0.14 0.22 0.06
RMSE(m) 0.22 RMSE(m) 0.10
Chinese scholartree No. 1 2 3 4 Camphor No. 1 2 3 4
Measured DBH(cm) 14.0 12.4 13.9 11.4 Measured DBH(cm) 21.5 22.8 28.6 21.0 Calculated DBH(cm) 14.5 13.6 14.1 11.1 Calculated DBH(cm) 21.6 23.0 29.5 20.5
Difference(cm) -0.5 -1.2 -0.2 0.3 Difference(cm) -0.1 -0.2 -0.9 0.5
RMSE(cm) 0.5 RMSE(cm) 0.5
Chinese scholartree No. 1 2 3 4 Camphor No. 1 2 3 4
cloud data is large, so the efficient data processing method should be studied. Point cloud contains a great deal of information, the way to dig out more information and make full use of it needs to be considered.
REFERENCES
Alonzo, M., Bookhagen, B., Roberts, D. A., 2014. Urban tree species mapping using hyperspectral and lidar data fusion. Remote Sensing of Environment, 148, 70-83.
Bright, B. C., Hicke, J. A., Hudak, A. T., 2012. Estimating aboveground carbon stocks of a forest affected by mountain pine beetle in Idaho using lidar and multispectral imagery. Remote Sensing of Environment, 124, 270-281.
Estornell, J., Ruiz, L. A., Velázquez-Martí, B., López-Cortés, I., Salazar, D., Fernández-Sarría, A., 2015. Estimation of pruning biomass of olive trees using airborne discrete-return LiDAR data. Biomass and Bioenergy, 81, 315-321.
Falkowski, M. J., Smith, A. M., Hudak, A. T., Gessler, P. E., Vierling, L. A., Crookston, N. L., 2006. Automated estimation of individual conifer tree height and crown diameter via two-dimensional spatial wavelet analysis of lidar data. Canadian Journal of Remote Sensing, 32(2), 153-161.
Fang, L., Yang, B., 2013. Automated extracting structural roads from mobile laser scanning point clouds. Acta Geodaetica et Cartographica Sinica, 42(2), 260-267.
Fitzgibbon, A., Pilu, M., Fisher, R. B., 1999. Direct least square fitting of ellipses. IEEE Transactions on pattern analysis and machine intelligence, 21(5), 476-480.
Huang, C., Wen, S., Ouyang, Q., Yang, L., 2015. Research on biomass and carbon storage of main tree species in Wangcheng district of Changsha city. Journal of Central South University of Forestry & Technology, 35(9), 128-132.
Maas, H. G., Bienert, A., Scheller, S., Keane, E., 2008. Automatic forest inventory parameter determination from terrestrial laser scanner data. International journal of remote sensing, 29(5), 1579-1593.
Ministry of Agriculture and Forestry of P.R. China, 1978.
Standing Volume Tables. Standards Press of China, Beijing, 97.
Shi, X., 2010. Preliminary study on fixing carbon dioxide releasing oxygen and retention of dust of street trees in Beijing. Beijing: Beijing Forestry University, 36 (Master’s thesis).
Sirmacek, B., Lindenbergh, R., 2015. Automatic classification of trees from laser scanning point clouds. ISPRS.
Wang, B., Liu, M., Zhang, B., 2009. Dynamics of net production of Chinese forest vegetation based on forest inventory data. Forest Resources Management, 1(3), 35-43.
Wang, Y., Zhou, G., Jiang, Y., Yang, Z., 2001. Estimating biomass and NPP of larix forests using forest inventory data.
Chinese Journal of Plant Ecology, 25(4), 420-425.
Wei, Z., Yang, B., Li, Q., 2012. Automatic extraction of building footprints from mobile LIDAR point clouds. Journal of Remote Sensing, 16(2), 286-296.
Wu, B., Yu, B., Yue, W., Shu, S., Tan, W., Hu, C., Huang, Y., Wu, J., Liu, H., 2013. A voxel-based method for automated identification and morphological parameters estimation of individual street trees from mobile laser scanning data. Remote Sensing, 5(2), 584-611.
Yang, B., Wei, Z., Li, Q., Li, J., 2012. Automated extraction of street-scene objects from mobile lidar point clouds. International Journal of Remote Sensing, 33(18), 5839-5861.
Yang, S., Li, Y., Li, K., Mao, J., 2014. Tree extraction from vehicle-borne LiDAR data. Engineering of Surveying and Mapping, 23(8), 23-47.