SMART CITIES INTELLIGENCE SYSTEM (SMACiSYS) INTEGRATING SENSOR WEB
WITH SPATIAL DATA INFRASTRUCTURES (SENSDI)
D. Bhattacharya a*, M. Painho a
a Nova Information Management School, Universidade Nova de Lisboa, Lisbon, Portugal - (dbhattacharya, painho)@novaims.unl.pt
Commission IV, WG IV/10
KEY WORDS: Sensor network, Sensor web, Spatial data infrastructure, Open Geospatial Consortium, Smart cities, APIs, Geosemantic web, Sensor web enablement.
ABSTRACT:
The paper endeavours to enhance the Sensor Web with crucial geospatial analysis capabilities through integration with Spatial Data Infrastructure. The objective is development of automated smart cities intelligence system (SMACiSYS) with sensor-web access (SENSDI) utilizing geomatics for sustainable societies. There has been a need to develop automated integrated system to categorize events and issue information that reaches users directly. At present, no web-enabled information system exists which can disseminate messages after events evaluation in real time. Research work formalizes a notion of an integrated, independent, generalized, and automated geo-event analysing system making use of geo-spatial data under popular usage platform. Integrating Sensor Web With Spatial Data Infrastructures (SENSDI) aims to extend SDIs with sensor web enablement, converging geospatial and built infrastructure, and implement test cases with sensor data and SDI. The other benefit, conversely, is the expansion of spatial data infrastructure to utilize sensor web, dynamically and in real time for smart applications that smarter cities demand nowadays. Hence, SENSDI augments existing smart cities platforms utilizing sensor web and spatial information achieved by coupling pairs of otherwise disjoint interfaces and APIs formulated by Open Geospatial Consortium (OGC) keeping entire platform open access and open source. SENSDI is based on Geonode, QGIS and Java, that bind most of the functionalities of Internet, sensor web and nowadays Internet of Things superseding Internet of Sensors as well. In a nutshell, the project delivers a generalized real-time accessible and analysable platform for sensing the environment and mapping the captured information for optimal decision-making and societal benefit.
* Corresponding author
1. INTRODUCTION
Smart cities intelligence system (SMACiSYS) for research on smart city enhancements through sensor web, spatial data infrastructure (SDI) and interdisciplinary processes for sustainable development, proposes a multidimensional distributed spatial platform using open source geo-datasets. It uses web-geoinformatics for creating schema and interface for mapping under Open Geospatial Consortium (OGC) standards by interlinking models and datasets. The aim is to create a generalized platform for use-cases analysis of spatio-sensor data viz. automated natural hazard monitor, climate monitor, to urban design, intelligent transportation systems, creating a multidimensional SDI, with sensor-web access utilizing geomatics for sustainable societies. Systems are needed for real time sensing, analysis and information on events through Open Source Geographical Information (OS-GIS) platform since better urban information management is achieved through SDI for big geodatabases which must be created and consulted regularly for region planning at different scales through satellite images and maps of locations signifying spatially referenced data creation, analysis, and management.
The research work formalizes a notion of an integrated, independent, generalized, and automated geo-event analyzing system making use of spatial data under popular usage platform. Integrating sensor web with SDIs extends sensor web enablement (SWE), converging geospatial and built infrastructure, and implement test cases with sensor data and SDI. The research harnesses the sensed environment by utilizing domain specific sensor data to create a generalized sensor web-framework. The challenges in the research are semantic enablement for Sensor Web and SDIs, and connecting
the interfaces of SDI with interfaces of Sensor Web through sensor data sources, setup an open source SDI, match the APIs and functions between Sensor Web and SDI, and create case studies like hazard applications, urban applications and more. Co-operative development of SDI and Web of Sensors best practices to enable a new realm of a location enabled and semantically enriched World Wide Sensor Web - the "Geospatial Sensor Web" or "Geosemantic Sensor Web" by linking one to one correspondence between Web Mapping Services (WMS), Web Feature Services (WFS), Web Coverage Services (WCS), Metadata and 'Sensor Observation Service' (SOS); 'Sensor Planning Service' (SPS); 'Sensor Alert Service' (SAS); a service that facilitates asynchronous message interchange between users and services, and between two OGC-SWE services, called the 'Web Notification Service' (WNS).
Hence in conclusion, it is of utmost importance to integrate SDI with Sensor Web merging the common OGC interfaces of both, thereby filling the research gap of development of an automated integrated web-enabled spatio-sensor information system to categorize events and issue information in real time. Multi-usability studies to validate integration is to be done as part of the research. Hence, we suggest a better more popular technology based solution that could be readily adopted without much investment.
It has been the case that traditional data publishers, mapping agencies, cadastral agencies, used to serving a professional market in a particular way, have largely developed the SDIs thereby short-sighting it. And SDIs have been limited in taking hints from the broader web i.e. internet. What we are missing is a vision of a truly location based "geospatial web", establishing importance of location at all levels of the internet stack. On the other hand new best
practices are emerging and rapidly evolving government, businesses, academia and citizens meaning that SDI community is in position to reap significant benefits from new developments as well as driving the maturation of the Geospatial Web. Taking such a scenario forward, the goals of this research are: Creating SMACiSYS and SENSDI, Extend SDIs with sensor web enablement, Converging geospatial and built infrastructure, Implement test cases with sensor data and SDI, Harnessing the sensed environment, Utilizing domain specific sensor data, Semantic Enablement for Spatial Data Infrastructures, and Connecting the interfaces of SDI with interfaces of Sensor Web.
2. BACKGROUND
Location is everywhere and “everywhen”. For long time, philosophers and academicians have understood that humans are spatial/temporal beings. Everything we do happens somewhere and "somewhen". Almost every decision that an individual or organization makes has some geospatial component. Almost any piece of information stored in a associated with such a technical capability. Many SDI projects are faced with developing policies and approaches to dealing with maximizing the benefits and minimizing the impacts of potential abuse (Reed and Reichardt, 2008). The technology infrastructure, the geospatially enabled internet and Web, enables the ability to capture, communicate and process location based information, and it also provides tools and technologies to prevent its abuse. This research develops on some of the geospatial standards that are available for use in any SDI implementation. The research is about how geospatial standards can work in concert with other IT standards to support rights management, security, privacy, authentication, and so forth (Liang and Huang, 2013).
Considerable research and development has been carried out in SDI in recent years (Mayer and Zipf, 2009; Janowicz et al., 2010). For example, Global Earth Observation System of Systems (GEOSS, 2017) and COPERNICUS, 2017 provide high quality spatial data to users in user-friendly geo-visualization platforms. The Infrastructure for Spatial Information in Europe (INSPIRE, 2017) adopts service technologies for building its spatial information infrastructure. Some are trying to develop high-level middleware services and domain-specific services for problem-solving and scientific discovery in infrastructures (Pasquinelli and Guzzetti, 2016). For example, the Group on Earth Observation (GEO) Model Web initiative proposes to provide environmental models as services and integrating distributed models in infrastructures. Data provenance is added into SDI to capture and share the derivation history of geospatial data products, which is important in evaluating the quality of data products. Others propose the ontology approach for geospatial resource discovery in SDI (Arco et al., 2016). The OGC is leading and coordinating the efforts of international organizations and enterprises to develop interoperable geospatial services. A series of standard-based interface specifications are already available, including Web map services (WMS), Web feature service (WFS), Web coverage services (WCS), catalogue services for the Web (CSW), and Web processing service (WPS).
There has not been a large-scale research on the spatial capabilities enhancement of sensor web, some pockets of
development in this area appeared globally and are reported next (Bröring et al., 2011; SANY, 2017). An instance of utilizing sensor web with spatial knowledge was reported in (Liang et al., 2005) where a system was developed to provide a graphical user interface to sensor data and provisions for spatial reference to that data. The research in (Liang and Huang, 2013) progressed from a similar effort on the part of the same authors in (Liang et al., 2005) where a primitive system of sensor and web mapping was discussed that worked on web mapping interfaces. SMACiSYS goes much ahead of such efforts by combining various research threads into one system having semantic robustness for a variety of data formats and sources, generalized interfaces for connectivity to spatial functions, a comprehensive and extensive SDI framework, and real-time data capture and processing (Bhattacharya et al., 2012, 2014a).
A system GeoCENS (Geospatial Cyberinfrastructure for Environmental Sensing) in (Liang and Huang, 2013) proved quite early-on that the world-wide sensor web has become a very useful technique for monitoring the physical world at spatial and temporal scales that were previously impossible. Yet we believe that the full potential of sensor web has thus far not been revealed. In order to harvest the world-wide sensor web's full potential, a geospatial cyberinfrastructure is needed to store, process, and deliver large amount of sensor data collected worldwide. In this paper, the authors defined the issue of the sensor web long tail followed by a view of the world-wide sensor web architecture. Then, the paper introduces the architecture and explains each of its components. Finally, with demonstration of three real-world powered-by-GeoCENS sensor web applications, the paper proves that the GeoCENS architecture can successfully address the sensor web long tail issue and consequently realize the world-wide sensor web vision (Liang and Huang, 2013).
There are some ongoing activities that are defining architectures and best practices for integrating sensor networks and observed data into existing and new SDI applications. SANY - Sensor Systems Anywhere - is example of this activity (SANY, 2017). The SANY Framework Programme 6 (FP6) integrated project focuses on interoperability of in-situ sensors and sensor networks. The SANY architecture will provide a quick and cost-efficient way to reuse of data and services from currently incompatible sensor- and data- sources. Some other activities reported are (Servigne et al., 2016; Stephenne et al., 2016). But these projects are mostly into architecture phase not thinking in terms of a broad scaled SDI and Sensor Web. The application phase is still far-off. SENSDI can have a real edge over the currently under development projects of similar kind in terms of impact on urban development, hazard management and mitigation, digital mapping etc.
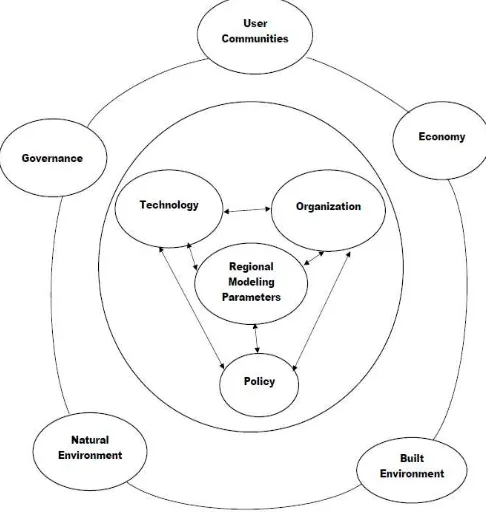
Together these factors have an impact on the sustainability and “liveability” of a city, so these should be taken into consideration when examining smart city initiatives. Integrative framework is the ideal way to move ahead. Drawing on the conceptual literature on smart cities and the factors, we have developed an integrative framework to explain the relationships and influences between these factors and smart city initiatives. Each of these factors is important to be considered in assessing the extent of smart city and when examining smart city initiatives. The factors provide a basis for comparing how cities are envisioning their smart initiatives, implementing shared services, and the related challenges.
This set of factors is also presented as a tool to support understanding of the relative success of different smart city initiatives implemented in different contexts and for different purposes. Similarly, this framework could help to disentangle the actual impact on types of variables
(organizational, technical, contextual) on the success of smart city initiatives. It is expected that while all factors have a two-way impact in smart city initiatives (each likely to be influenced by and is influencing other factors), at different times and in different contexts, some are more influential than others. In order to reflect the differentiated levels of impact, the factors in our proposed framework are represented in two different levels of influence (Maguire and Longley, 2004).
Outer factors (governance, people and communities, natural environment, infrastructure, and economy) are in some way filtered or influenced more than influential inner factors (technology, management, and policy) before affecting the success of smart city initiatives. This counts for both direct and indirect effects of the outer factors. Technology may be considered as a meta-factor in smart city initiatives, since it could heavily influence each of the other seven factors. Due to the fact that many smart city initiatives are intensively using technology, it could be seen as a factor that in some way influences all other success factors in this framework, named SmaCISys (Smart City Intelligence System) in Figure 1.
3. METHODOLOGY
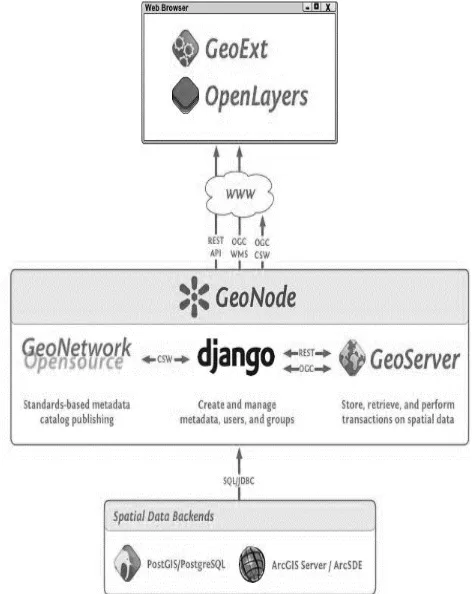
The research work is on using Open-Source Geographical Information System (OS - GIS) and distributed architecture based platform allowing 3 dimensional (3D-GIS) development. To develop on an open source platform is a very rare opportunity as far as spatial data infrastructures are concerned and this would be extremely vital when huge databases are to be created and consulted regularly for city planning at different scales particularly satellite images and maps of locations. There is a big need for spatially referenced data creation, analysis and management. Some of the salient points that would be contributed through this research with GeoNode being an open source platform facilitating the creation, sharing, and collaborative use of geospatial data (Figure 1).
The project aims to surpass existing spatial data infrastructure solutions by integrating robust social and cartographic tools; at its core, the GeoNode is based on open source components GeoServer, GeoNetwork, Django, and GeoExt that provide a platform for sophisticated web browser spatial visualization and analysis. Atop this stack, the project has built a map composer and viewer, tools for analysis, and reporting tools; to promote collaboration, the GeoNode is designed on Web 2.0 principles to: Make it extremely simple to share data; Easily add comments, ratings, tags; Connect between GeoNode and existing GIS tools; To secure distribution, the GeoNode enables: Simple installation and distribution; Automatic metadata creation; Search via catalogues and search engines (Google) etc.
SDI advancements coupled with continued advancements of Information and Communication Technology (ICT) and related standards are carrying us toward a "next level" of capability. The interactive graphical user interface allows for data visualization, manipulation and sharing (Figure 2 and 3) and it integrates with the broad functionalities of the system as in Figure 1. The overall architecture depends on the creation of knowledge bases for natural hazards to deduce the extremity of the occurrence. The methodology is that the input module of the system implements extraction, based on legend matching, of information about causative factors from thematic maps, satellite images, and GIS layers, addresses expert knowledge rules (qualitative approach), conducts pixel-based reclassification of input (compatible to KB), results in evaluation of intensity of hazard on ratings of causative factors (deterministic method) and communication to user is achieved
using existing cellular network infrastructure in a region. Proposed research should contribute to the development and application of OGC standards. The proposal brings out the benefits of the study towards these goals and the overall requirement of setting up of SDIs. The proposed system architecture is based on the concepts of interactivity between geo spatial data management, internet and web-based processing, logical inferencing and communication technology. Hence the development of different modules, each of which achieves a specific set of tasks related to the mentioned technologies, such as the data needed by the geo-hazard warning communication system and the structure of data maintenance adopted inside the database module (Bhattacharya et al., 2016).
Figure 1. Shared Architecture of SMACiSYS.
Input Data to the System
The data utilized by the system comes in many basic formats like string, numeric, alphanumeric and arrays. The aggregated data is stored in the database as geo-referenced data, threat strings, communication numbers, and instructive messages if any. The data sets required by the SMACiSYS and SENSDI are as follows:
Geo-Referenced Data.
The information pertaining to assessed hazard and subscriber mobile data those have been registered in the system and mapped to the region (geo-referenced threat locations) where the messages are to be disseminated. The validation procedure works on landslide threat in a region evaluated a priory as a hazard map. The mobile numbers to be utilized for sending messages are the numbers lying in the region of the map. There could be many maps whose threat data are stored in the database of the warning system at any given time. To select the correct mobile numbers for that region, the hazard location as well as subscriber data both have been geo-referenced. The latitude and longitude for a given location describes the threat level in that location in one table and the same latitude-longitude describes the mobile numbers in that region. The separation of regions has been kept as 0.25˚ x 0.25˚ latitude x longitude. The latitude-longitude combination has been used as indexes for accessing the tables in the database.
Location Data. The location data consists of spatial as well as the threat details of an area, contained in the server database. The server database holds in its table hazard_details threat messages in association with their geo-location. The index column represents the pixel location of the rasterized hazard data having geo-referenced match with the ground location shown in the second column of the table. The classified hazard description constitutes the third column of the table which notifies the local area name as well. The geo-location in the second column is accessed by the client table stored in database of Figure 3.
Figure 2. GIS Data Flow Diagram of SMACiSYS
Figure 3. The SMACiSYS Spatial development architecture
The concepts of Sensor Web could be understood as:
• a service for retrieving sensor 'observation' data and meta-information, the so-called 'Sensor Observation Service' (SOS);
• a service for sensor planning and executing tasks, called the 'Sensor Planning Service' (SPS);
• a service that allows users to subscribe to specific alert types, known as the 'Sensor Alert Service' (SAS); a
• a service that facilitates asynchronous message interchange between users and services, and between two OGC-SWE services, called the 'Web Notification Service' (WNS).
And that of SDI:
Web Map Service (WMS) Web Feature Service (WFS) Web Coverage Service (WCS) Web Map Context (WMC) Catalogue
Metadata
It is necessary to have a one-to-one correspondence between the elements of Sensor Web and SDI. A possible environment for establishing such interfaces could be GeoServer and GeoNode which provide an OGC compatible data store that can speak WMS, WFS, WCS and others in common formats like GML, GeoJSON, KML and GeoTiff. It can be connected to different spatial backends including PostGIS, Oracle Spatial, ArcSDE and others. The Catalog: GeoNetwork: GeoNetwork provides a standard catalog and search interface based on OGC standards.
It is used via the CSW interface to create and update records when they are accessed in GeoNode. The Map Composer: GeoNode Client : The main map interface for GeoNode is the Map Composer / Editor. It talks to the other components via HTTP and JSON as well as standard OGC services (Bhattacharya et al., 2012, 2014a, 2016).
The conceptual schema provides insight about the components and the way they are used to create the final product. The main components are: The GeoSpatial Data Manager, GeoServer, GeoNetwork, and Map Composer. GeoServer provides an OGC compatible data store that can speak WMS, WFS, WCS and others in common formats like GML, GeoJSON, KML and GeoTiff. It can be connected to different spatial backends including PostGIS, Oracle Spatial, ArcSDE and others.
The Catalog: GeoNetwork-GeoNetwork provides a standard catalog and search interface based on OGC standards. It is used via the CSW interface to create and update records when they are accessed in GeoNode. As the Fig 3 suggests, integration of knowledge bases for natural hazards to be developed to meet objective. The methodology is that system implements extraction, based on legend matching, of information about causative factors from thematic maps, satellite images, and GIS layers, addresses expert knowledge rules (qualitative approach), conducts pixel-based reclassification of input (compatible to KB) , results in evaluation of intensity of hazard on ratings of causative factors (deterministic method) and communication to user is achieved using existing cellular network infrastructure in a region.
The system methodology includes interpretation of causative factors from their input maps, addressing of expert knowledge as rules, reclassification of geomorphologic maps, evaluation of susceptibility intensity based on causative factors ratings, and minimization of subjectivity by fuzzy techniques. Further, the design of the system is primarily based on emulating expertise toward map preparation.
The interactive graphical user interface allows for data visualization, manipulation and sharing (Figure 2 and 3) and it integrates with the broad functionalities of the system as in Figure 1. The overall architecture depends on the creation of knowledge bases for natural hazards to deduce the extremity of the occurrence.
The methodology is that the input module of the system implements extraction, based on legend matching, of information about causative factors from thematic maps, satellite images, and GIS layers, addresses expert knowledge rules (qualitative approach), conducts pixel-based reclassification of input (compatible to KB) , results in evaluation of intensity of hazard on ratings of causative factors (deterministic method) and communication to user is achieved using existing cellular network infrastructure in a region. Proposed research should contribute to the development and application of OGC standards.
The proposal brings out the benefits of the study towards these goals and the overall requirement of setting up of SDIs in the country. The proposed system architecture is based on the concepts of interactivity between geo spatial data management, internet and web-based processing, logical inferencing and communication technology. Hence the development of different modules, each of which achieves a specific set of tasks related to the mentioned technologies, such as the data needed by the geo-hazard warning communication system and the structure of data maintenance adopted inside the database module.
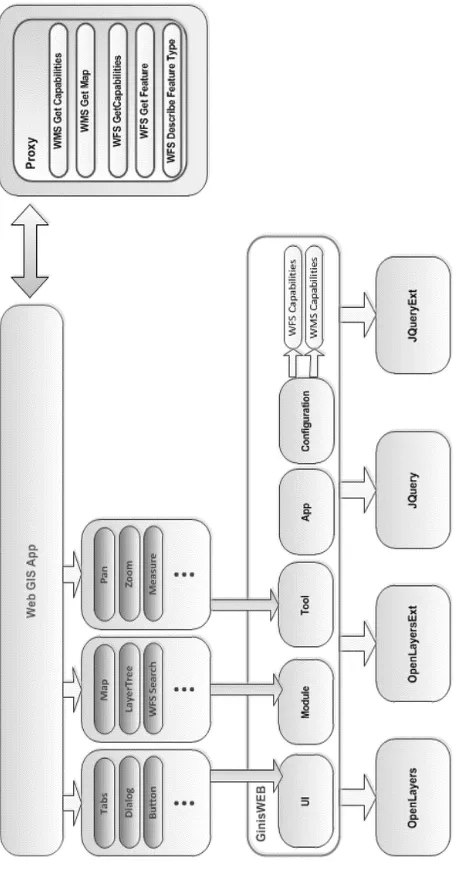
Figure 4. Flowchart of internal dataflow merged with sensor web and webGIS.
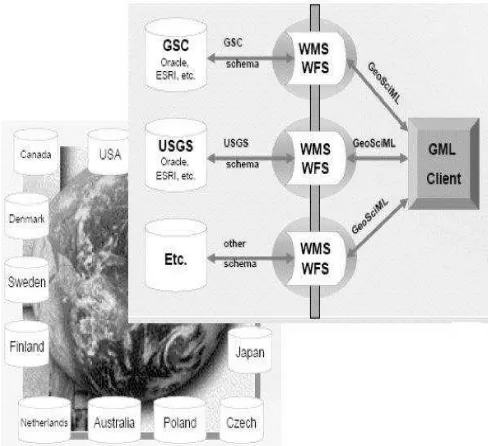
The architecture shown in Figure 4 corresponds to the research related to communication between the different apps – WebGIS app, Services apps, Tools apps, Technologies apps, and the external Users apps. The corresponding relationships with elements shown in Figure 5 relate to the language of communication – GeoSciML, the scientific markup language for spatial sciences. The various schemas are also shown between the functional layers. There are layers for mapping, data base accessibility, client side functions and overall synchronization.
Figure 5. Sample integrated sensored webGIS GeoSciML is being worked on by EU, US, Canadian, Japanese agencies.
4. RESULTS
The development of the system has been done component wise and some intermediate results component-wise have been reported in (Bhattacharya et al., 2014b; Komarkova et al., 2013). The joining of geospatial datasets and knowledge bases is required to utilize the complete set of information available in each of them. There are many open source geospatial datasets available such as GeoNames, Open Street Map, Natural Earth and to get a comprehensive dataset with the union of all available information it is important that such datasets are linked optimally without redundancy or loss of information. One of the essential aspects of digital mapping and online visualization of maps is the prioritized ranking of geolocations with respect to their attributes and this facility is available as rank columns in Natural Earth data tables which need to be merged with other datasets for creating a complete and exhaustive mapping example. The online mapping systems facilitate many geospatial datasets which are used, created, edited and maintained including the use of GeoNames as the layer for populated places. Many of the geolocations on digital maps are not classified for importance because of the lack of additional information such as population or administrative level. A way to give an importance scale to the names is by linking the GeoNames to other datasets (OSM, natural earth).
OpenStreetMap data provides a limited number of place classifications (such as region, town, village). For the best cartographic results we need classes that are a little more opinionated about how they rank cities. Questions such as “Which of the labels should be visible" and "how much should this label be emphasized" are important decisions that need to be made in cartographic design. To do this the present research is to join additional information from Natural Earth, Global Administrative Unit Layers (GAUL), Second Administrative Level Boundaries (SALB), Database of Global Administrative Areas (GADM) etc. The challenges faced include geometry searching, matching, buffer determination, local regional naming text inclusion and accuracy.
This has been achieved by the current research work where presently GeoNames, Natural Earth and Open Street Map data tables have been merged with the union of all
their attribute columns resulting in a complete geospatial dataset with place accuracy of atleast 95% for any given country dataset. The data tables at global level consist of hundreds of thousands of rows with each row depicting a geolocation. The geometry, name and geo-id complete and fuzzy searching and matching around a buffer of 50 km took a minimum of 30 secs to maximum 1 minute in a commodity computer with 2 GHz, 2 GB memory, according to size and complexity of the query run for a country which could have a list of points ranging from a dozen to several hundreds. The future aim is to ultimately do this for global datasets to create an all-encompassing geodata bank having such information as administrative, political, ecological details from important databases as GAUL, SALB, GADM etc.
5. DISCUSSIONS
The proposed system architecture is based on the concepts of interactivity between geo spatial data management, internet and web-based processing, logical inferencing and communication technology. Hence the development of different modules, each of which achieves a specific set of tasks related to the mentioned technologies, such as the data needed by the geo-hazard warning communication system and the structure of data maintenance adopted inside the database module.
The research work is related to integration of different models in smart system modelling and to find use-cases to test the integration are the areas where the proposed research contributes immensely. The processing and maintenance of multi-sourced and multi-format data as addressed in the proposal would complement smart cities activities very well. As described in Fig. 1 the interaction between multiple disciplines is necessary for modelling smart systems hence, the proposal for research on transdisciplinary processes addresses the challenges presented by different actors in science, politics, in economy and administration. The integrated system SMACiSYS and SENSDI are planned to be highly interactive and data oriented. As presented in Fig. 2 the User input is assimilated along with other input data. The purpose is either to find out about the users’ needs or to assimilate the requirement in the knowledge base and improve future versions jointly. To contribute to an improvement of transdisciplinary processes, the proposed research would lead to an environment of co-creation of knowledge.
The purpose of Fig. 1 is to address the collaborative issues of user requirement, feasibility analysis, governance rules, economic suitability, natural and built environment, technology adaptation, policy creation etc. The cyclic nature of interactions between these processes has necessitated a cooperation with specialists in transdisciplinarity and in certain networks, the character of co-creation and its special methodology are assessed. This leads to Fig. 2 where the different domains’ specialized knowledge are created in databases and inferred for decision making. Hence the proposal addresses the challenges through two systems Smart Cities and SENSDI which together can be viewed as an integrated approach to understand socio-economic consequences (Degbelo et al., 2016a). To study impacted areas and sectors urban and smart planning, coastal protection or water resources management. The proposed systems are decision support systems since sustainable development of a region requires responsible action and decision making (Degbelo et al., 2016a, b, c).
A smart system model integrated with Fig. 2 above is capable of harnessing the knowledge about from sensors pertaining to climate models, hydrological models, integrated assessment
models, economic models, models for decision support, spatial planning models, sociological models etc.
Core to the concept of a smart region is the use of technology to increase sustainability and to better manage natural resources. Of particular interest is the protection of natural resources and the related infrastructures. Integrating open resources to joining of geospatial datasets and knowledge bases is required to utilize the complete set of information available in each of them. There are many open source geospatial datasets available such as GeoNames, Open Street Map, Natural Earth and to get a comprehensive dataset with the union of all available information it is important that such datasets are linked optimally without redundancy or loss of information. One of the essential aspects of digital mapping and online visualization of maps is the prioritized ranking of geolocations with respect to their attributes and this facility is available as rank columns in Natural Earth data tables which need to be merged with other datasets for creating a complete and exhaustive mapping example. The online mapping systems facilitate many geospatial datasets which are used, created, edited and maintained including the use of GeoNames as the layer for populated places. Many of the geolocations on digital maps are not classified for importance because of the lack of additional information such as population or administrative level. A way to give an importance scale to the names is by linking the GeoNames to other datasets (OSM, natural earth).
6. CONCLUSIONS AND FUTURE SCOPE
SMACiSYS with SENSDI addresses smarter living conditions for citizens and better management of resources for administrators and industries by spatially enabling the new data sources coming up. Currently the vast capacity of spatially referencing newer sources of data and information is not being done. SDI concept has hit a roadblock towards further development. One very smart and efficient way forward is to integrate SDI with new data sources sensors that are coming up and creating a sensor web of spatially oriented information. The results are to be published in reputed open journals and international conferences. The methodologies employ open source techniques. Open licensing is the way to future development.
The project is data intensive so interactions with data providers and sources is prominent. There must be meaningful interactions. The results of data processing and infrastructure building will be of interest to current and future stakeholders so that has to be formulated according to the university rules.
Expected users will be scientists developing systems like EU INSPIRE directives, OGC, ISO, public users and other agencies. It has very attractive market and research and academic scope in spatial developments, applicable to virtually all activities of commerce and governance. Sensor Web and particularly into other potential applications of the planned research such as defense application of analyzing different sensor data, or health applications of medical sensor data, climate change studies globally and more. SMACiSYS and SENSDI could have wider meaning through demonstrations for public, and last but not the least online documentations and guidelines.
ACKNOWLEDGEMENTS
D. Bhattacharya has been funded by the European Commission through the GEO-C project (H2020-MSCA-ITN-2014, Grant Agreement number 642332, http://www.geo-c.eu/). The authors are thankful to anonymous reviewers for their constructive comments that helped improve the paper.
REFERENCES
Arco, E., Boccardo, P., Gandino, F., Lingua, A., Noardo, F., Rebaudengo, M., 2016. “An Integrated Approach For Pollution Monitoring: Smart Acquirement And Smart Information”,
ISPRS Ann. Photogramm. Remote Sens. Spatial Inf. Sci.,
IV-4/W1, pp. 67-74, https://doi.org/10.5194/isprs-annals-IV-4-W1-67-2016.
Bhattacharya, D., Ghosh, J.K., Samadhiya, N.K., 2012. “Review of Geohazard Warning Systems toward Development of a Popular Usage Geohazard Warning Communication System.” ASCE Nat. Hazards Rev., 13(4), 260–271, http://ascelibrary.org/doi/abs/10.1061/(ASCE)NH.1527-6996.0000078
Bhattacharya, D., Ghosh J. K., Komarkova, J., Banerjee, S., Kutoglu H. S., 2014a. “Distributed GIS for Automated Natural Hazard Zonation Mapping Internet-SMS Warning towards Sustainable Society”, Cogent Engineering, Taylor & Francis Online
http://www.tandfonline.com/doi/pdf/10.1080/23311916.2014.9
61346 ;
http://www.tandfonline.com/doi/full/10.1080/23311916.2014.9 61346#.VE5uAiLLdaQ
Bhattacharya, D., Pasquali, P., Komárková, J., Sedlák, P., Saha, A., 2014b. “Interlinking Opensource Geo-spatial Datasets For Optimal Utility in Ranking”,Modern Trends in
Cartography, Selected Papers of CARTOCON
2014, Series: Lecture Notes in Geoinformation and
Cartography, Vondrakova, A., Brus, J., Vozenilek, V. (Eds.), 2015, X, 553 p.
Bhattacharya, D., Painho, M., 2016. “Design For Connecting Spatial Data Infrastructures With Sensor Web (SENSDI)”,
ISPRS Ann. Photogramm. Remote Sens. Spatial Inf. Sci., III-4, Sensor Web Enablement,” Sensors, 11(3), pp. 2652–2699, DOI: 10.3390/s110302652.
COPERNICUS, 2017. “Global Monitoring for Environment and Security European Programme for the establishment of a European capacity for Earth Observation”, www.copernicus.eu (last accessed 11 July 2017).
Degbelo, A.; Granell, C.; Trilles, S.; Bhattacharya, D.; Casteleyn, S.; Kray, C., 2016a. “Opening up Smart Cities: Citizen-Centric Challenges and Opportunities from GIScience”,.ISPRS Int. J. Geo-Inf., 5(16), Special Issue Geo-Information Fostering Innovative Solutions for Smart Cities, http://www.mdpi.com/2220-9964/5/2/16/
Degbelo, A., Bhattacharya, D., Trilles, S., Canut, C.G., Kray, C., Schiestel, N., 2016b. “Designing Semantic Application Programming Interfaces for Open Government Data”, JeDEM -
eJournal of eDemocracy and Open Government, 8(2): pp.
21-58, http://www.jedem.org/index.php/jedem/article/view/420
Degbelo, A., Bhattacharya, D., Granell, C., Trilles, S., 2016c. "Toolkits for Smarter Cities: A Brief Assessment". Chapter in
Ubiquitous Computing and Ambient Intelligence, Vol. 10070,
Lecture Notes in Computer Science, pp. 431-436, Springer, http://link.springer.com/chapter/10.1007/978-3-319-48799-1_47
GEOSS, 2017. “Global Earth Observation System of Systems, intergovernmental Group on Earth Observations (GEO)”, https://www.earthobservations.org/geoss.php (last accessed 11 July 2017).
INSPIRE, 2017. “Infrastructure for Spatial Information in Europe”,
http://inspire.ec.europa.eu/reports/ImplementingRules/network/ INSPIRE_NETWORK_SERVICES_SOAP_Framework.pdf
Janowicz, K., Schade, S., Broring, A., Kessler, C., Maue, P., Stasch, C., 2010. “Semantic enablement for spatial data infrastructures”, Transactions in GIS, 14(2), pp. 111–129. Retrieved on 19/05/2017 http://doi.org/10.1111/j.1467-9671.2010.01186.x and http://carsten.io/tgis09_sel.pdf
Komarkova J., Spidlen J., Bhattacharya D., Horak O., 2013. “Distributed Processing of Elevation Data by Means of Apache Hadoop in a Small Cluster”, ICSOFT-EA – 8th International
Conference on Software Engineering and Applications,
Reykjavík, Iceland, 29-31 July 2013, http://www.bibsonomy.org/bibtex/2017f54e3ff805f6e65a0e8ed 81d388c0/dblp
Liang, S. H. L., Huang, C. Y., 2013. “GeoCENS: a geospatial cyberinfrastructure for the world-wide sensor web”. Sensors, 13(10), pp. 13402–13424. http://doi.org/10.3390/s131013402
Liang, S. H. L., Croitoru, A., Tao, C. V., 2005. “A distributed geospatial infrastructure for Sensor Web”, Computers and
Geosciences, 31(2), pp. 221–231,
http://doi.org/10.1016/j.cageo.2004.06.014
Maguire, D., Longley, P., 2004. "The emergence of geoportals and their role in spatial data infrastructures", Comput. Environ.
Urban Syst., 29(1), pp. 3-14.
Mayer, C., Zipf, A., 2009. “Integration and visualization of dynamic sensor data into 3D spatial data infrastructures in a standardized way”, GeoViz 2009 Workshop, Hamburg,
Retrieved on 19/05/2017
http://www.geovisualisierung.net/geoviz_hamburg/papers/11_2
_Mayer.pdf ; and
http://koenigstuhl.geog.uni-heidelberg.de/publications/bonn/conference/geoViz09.gdi3d.se nsor.mayer_zipf.pdf
Pasquinelli, A., Guzzetti, F., 2016. “Knowledge For Intelligence: Discussing The State And The Role Of Building Data In Italy”, ISPRS Ann. Photogramm. Remote Sens. Spatial
Inf. Sci., IV-4/W1, pp. 11-18,
https://doi.org/10.5194/isprs-annals-IV-4-W1-11-2016.
Reed, C., Reichardt, M., 2008. “From Spatial Data Infrastructure to the Geospatial Web: Advancing the SDI
Vision in a Changing Technology Environment”, 10th GSDI
Conference, Trinidad & Tobago, Online accessed 15/05/2017:
https://www.researchgate.net/publication/279532278_From_Sp atial_Data_Infrastructure_to_the_Geospatial_Web_Advancing_ the_SDI_Vision_in_a_Changing_Technology_Environment
SANY, 2017. “Sensors Anywhere (FP6 EU Project)”, http://ercim-news.ercim.eu/en76/special/sensors-anywhere-
sensor-web-enablement-in-risk-management-applications(accessed: 15/05/2017).
Servigne, S., Gripay, Y., Pinarer, O., Samuel, J., Ozgovde, A., Jay, J., 2016. “Heterogeneous Sensor Data Exploration And Sustainable Declarative Monitoring Architecture: Application To Smart Building”, ISPRS Ann. Photogramm. Remote Sens.
Spatial Inf. Sci., IV-4/W1, 97-104,
https://doi.org/10.5194/isprs-annals-IV-4-W1-97-2016.
Stephenne, N., Beaumont, B., Hallot, E., Wolff, E., Poelmans, L., Baltus, C., 2016. “Sustainable And Smart City Planning Using Spatial Data In Wallonia”, ISPRS Ann. Photogramm.
Remote Sens. Spatial Inf. Sci., IV-4/W1, pp. 3-10,
https://doi.org/10.5194/isprs-annals-IV-4-W1-3-2016.