See discussions, stats, and author profiles for this publication at: https://www.researchgate.net/publication/280627784
Real-Time stack monitoring at the BaTek
medical isotope production facility
Article in Journal of Radioanalytical and Nuclear Chemistry · July 2015
DOI: 10.1007/s10967-015-4348-2
CITATIONS
4
READS
183
19 authors, including:
Some of the authors of this publication are also working on these related projects:
Xenon radionuclides monitoringView project
Consortium for Verification TechnologyView project Gatot Suhariyono
Badan Tenaga Nuklir Nasional
24PUBLICATIONS 5CITATIONS
SEE PROFILE
Justin McIntyre
Pacific Northwest National Laboratory
153PUBLICATIONS 2,895CITATIONS
SEE PROFILE
Agung Agusbudiman
Badan Tenaga Nuklir Nasional
1PUBLICATION 4CITATIONS
SEE PROFILE
Johannes Robert Dumais
Badan Tenaga Nuklir Nasional
4PUBLICATIONS 7CITATIONS
SEE PROFILE
1 23
Journal of Radioanalytical and
Nuclear Chemistry
An International Journal Dealing with
All Aspects and Applications of Nuclear
Chemistry
ISSN 0236-5731
J Radioanal Nucl Chem
DOI 10.1007/s10967-015-4348-2
Real-time stack monitoring at the BaTek
medical isotope production facility
1 23
Real-time stack monitoring at the BaTek medical isotope
production facility
Justin I. McIntyre1• Agung Agusbudiman2•Ian M. Cameron1•Johannes R. Dumais2•
Paul W. Eslinger1• Abdelhakim Gheddou3•Kirill Khrustalev3•Pujadi Marsoem2•
Harry S. Miley1•Mika Nikkinen4•Amanda M. Prinke1•Michael D. Ripplinger1•
Brian T. Schrom1• William A. Sliger1•Ulrich Stoehlker5•Gatot Suhariyono2•
Glen A. Warren1• Susilo Widodo2•Vincent T. Woods1
Received: 10 July 2015
ÓAkade´miai Kiado´, Budapest, Hungary 2015
Abstract Radioxenon emissions from fission-based radiopharmaceutical production are a major source of background concentrations affecting the radioxenon detection systems of the international monitoring system (IMS). Collection of real-time emissions data from pro-duction facilities makes it possible to screen out some medical isotope signatures from the IMS radioxenon data sets. This paper describes an effort to obtain and analyze real-time stack emissions data with the design, construction and installation of a small stack monitoring system devel-oped by a joint CTBTO-IDC, BATAN, and Pacific Northwest National Laboratory team at the BaTek medical isotope production facility near Jakarta, Indonesia.
Keywords Medical isotope productionInternational monitoring system (IMS)Stack monitoring
RadioxenonCTBTO
Introduction
The production of fission-based radiopharmaceuticals is a major source of anthropogenic radioxenon in the atmo-sphere. Production of99Mo, the precursor for99mTc, is of
particular interest, because it is typically generated by irradiating a uranium target. Molybdenum-99 comprises about 6 % of the fission atoms produced in this process, and the global demand for99Mo is on the order of 10,000 6-day curies (Ci) per week [1], enough for approximately 20 million patient doses per year. The two noble gas iso-topes133Xe and135Xe are also produced in similar quan-tities [2] and they are released to the air when the uranium is chemically dissolved. Without a trapping scheme, prac-tically all of the xenon produced during radiopharmaceu-tical creation will be released to the atmosphere.
These emissions affect the radioxenon detection systems of the international monitoring system (IMS) [3], causing several thousand detections a year at the radioxenon sta-tions [4, 5]. Some of these emissions are large enough to have the potential to mask small radioxenon emissions from underground nuclear explosions [6,7].
With careful atmospheric modeling (ATM) it is possible to distinguish between radioxenon releases from nuclear explosions and civilian activities [8] if several isotopes are measured simultaneously within the same air sample. This is possible because emissions from nuclear power plants and medical isotope production facilities have different isotopic mixes.
Medical isotope production facilities use different irra-diation profiles and separations processes, thus it is useful to develop facility-specific radioxenon isotopic signatures. When real-time release data are available, it may be pos-sible to use ATM and isotopic ratios to screen out radio-pharmaceutical medical isotope radioxenon signatures from the daily world-wide IMS radioxenon data sets [4]. Past efforts working with several medical isotope produc-tion facilities have proven very successful in terms of stack monitoring, and in one case an efficient xenon retention system has abated stack emissions to less than 59109Bq
& Paul W. Eslinger
1 Pacific Northwest National Laboratory, Richland, WA, USA
2
BATAN, National Nuclear Energy Agency, Jakarta, Indonesia
3 International Data Centre, CTBTO, Vienna, Austria
4
International Atomic Energy Agency, Vienna, Austria
5
Federal Office for Radiation Protection, Freiburg, Germany
123
J Radioanal Nucl Chem DOI 10.1007/s10967-015-4348-2
per day [9], a level that has been determined to have little impact on IMS detection systems [10].
In 2012, a joint CTBTO-BATAN-PNNL team developed and deployed a simple stack monitor at the PT. BATAN Teknologi (BaTek) medical isotope production facility near Jakarta, Indonesia. The stack monitor was designed to pro-vide near-real time gamma-ray spectroscopic data so four radioxenon isotopes (131mXe, 133mXe, 133Xe, and 135Xe) could be identified and quantified throughout the uranium dissolution process cycle at the facility.
Experimental
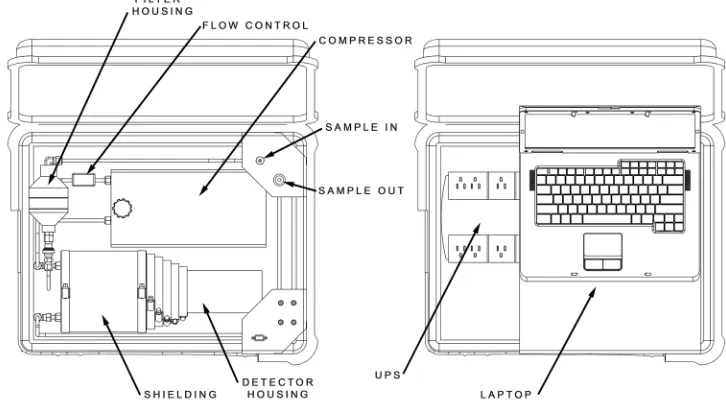
The project team set a goal of developing a low-cost stack-air monitoring system that integrated with existing facility infrastructure and equipment with a minimum of impact on operations while providing high-quality data. The follow-ing five general design requirements were identified: (1) Provide a known volume and geometry for stack gases to occupy during counting, (2) design the sample holder to mate with a LaBr3(Cl) detector, (3) measure the air flow through the system and provide active airflow assistance to facilitate rapid sample turnover, (4) use a modest amount of lead shielding to reduce the non-sample-related radio-metric background, and (5) incorporate a charcoal filter unit upstream of the sampling volume to reduce potential contamination by other isotopes.
A schematic of the sampling system is provided in Fig.1. The overall cost in parts was less than $26,000 (U.S.) and included $11,000 for the LaBr3(Cl) detector, manufactured by Saint-Gobain, with multichannel spec-troscopic readout and a laptop PC [11]. The sample volume was a 1-l gas-tight Marinelli GA-MA G-133N beaker
surrounded by 2.5 cm of lead. The air flow and temperature were continuously measured by a Red-yTM unit (manu-factured by Vo¨gtlin Instruments AG-flow technology) that interfaced with the PC via a USB connector. The detector housing was a model DC2011 manufactured by Canberra Packard. A compressor pump was used to exchange air volumes in the 1-l sample volume. A charcoal filter was placed upstream to significantly reduce the amount of radioiodine in the airflow because radioiodine will plate out on the Marinelli beaker and interfere with some of the radioxenon decay peaks.
A scintillator detector was selected over other detector designs due to expected high count rates, a long deploy-ment time and the lack of daily technician support. The LaBr3(Cl) detector was the highest resolution commer-cially available scintillator at the time of purchase.
The BaTek facility had commercial radiation health and safety monitoring equipment integrated into the airflow of the stack; the new sampling and detection system was installed in the existing airflow system with minimal changes to the existing piping.
Detector and counting cell geometry calculations
The LaBr3(Ce) detector was modeled using GEANT4, version 9.5 patch 1 [12] to estimate its detection efficiency for various decay energies. The detector geometry consists of the 3.8 cm diameter by 3.8 cm long LaBr3(Ce) crystal, a photomultiplier tube and base, a detector container, the sample beaker and lead shielding. The photomultiplier tube is a simple aluminum cylinder, although for modeling purposes the density of the aluminum was chosen to have the same mass as an annulus with the same outer diameter
Fig. 1 Schematic of the gamma-ray detector/air sampling system
J Radioanal Nucl Chem
123
and 1-mm thick walls. The modeled detector enclosure was a simplified geometry of the Canberra DC2011 scintillator enclosure. No holes for gas tubes were included in the model.
Four noble gas sources and four check sources were simulated. The energy deposition in the LaBr crystal was recorded during the simulations; the optical photons were not modeled. The noble gas sources (133Xe, 135Xe, 85Kr and88mKr) were distributed uniformly within the sample beaker, whereas the check sources used for benchmarking measurements (60Co,133Ba,137Cs and241Am) were placed in the center of the top of the beaker. The lead shielding was removed from the model while modeling the bench-marking measurements. Energy resolution was not
incor-porated into the modeled response because the
comparisons focused on the strengths of selected peaks.
Benchmarking measurements
A series of measurements with check sources was con-ducted after the system was delivered to the BaTek facility. The sources consisted of 60Co, 133Ba, 137Cs and 241Am. Each measurement was conducted over a 600-s time interval. A comparison of the peak strengths from the GEANT4 simulations and the measurements is shown in Table1. The quantity recorded in the table is the number of counts per one thousand decays. For the measurement spectra, the strengths of the peaks were determined using fits to the data assuming a quadratic background. The average result over the available runs for each isotope is reported in Table1 along with one standard deviation error bars.
The simulated and measured results for the 384-keV peak of133Ba are different enough that the 384-keV result was excluded from the analysis. The relative strength of the 384- to 356-keV peaks is 0.144 [13], while in the
simulation it is 0.196 (assuming essentially no difference in detector efficiency for the two energy levels). This differ-ence suggests that the simulated strength of the 384-keV peak is too strong.
The energies of the calibrations are clustered together by source type, with little overlap between sources. This clustering makes it difficult to ascertain whether the apparent energy dependence of the ratio is due to an incorrect energy dependence of the simulation, experi-mental issues related to the use of the sources, or a source-dependent normalization problem. For purposes of this analysis, a simple average of the ratios of the simulated strengths to the measured strengths was 1.04 with a stan-dard deviation of 0.15.
Energy calibration
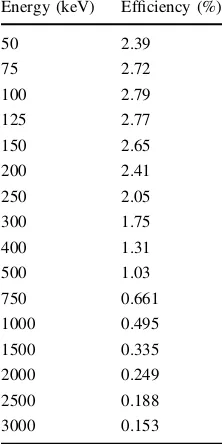
Several additional GEANT4 simulations were conducted to estimate the efficiency of the detector to photons at various energies. The simulations randomly generated the initial position of the photons inside the beaker and assumed an isotopic angular distribution. The calibrations were con-ducted with version 9.5 patch 2 of GEANT4, using the physics libraries distributed with that version. This is a change from previous simulations, which used version 9.5 patch 1. No significant differences for simulated 133Xe results were observed between the two different versions. Detector efficiencies for a range of energies are provided in Table2.
Results and discussion
Gamma spectra were collected and digitally stored from February 1, 2013, to December 22, 2013. The detector collected data approximately 80 % of the time the facility
Table 1 Comparison of simulated and measured peak strengths
was operating. The stored data sets were analyzed at Pacific Northwest National Laboratory (PNNL). Xenon radionuclides analyzed for this publication are listed in Table3 along with the relevant physical and detector characteristics.
The measurement campaign collected approximately 25,000 individual gamma-ray spectra at 10-min intervals. Individual spectra were integrated to provide a collection period of 1 h and releases were then calculated for specific isotopes with known emission energies. The estimated amount of each isotope was based on a separate energy peak. The emission profile under inspection was fit to specific peaks using a polynomial background description and a Gaussian curve component using the following equation:
The background is estimated by fitting a quadratic equation to adjoining samples on both sides of the peak while omitting data in the peak. The background values are subtracted before the Gaussian (exponential) term in Eq. (1) is fit to the data. The mean value of the specific peak,lp, and the spread parameter,rp, are estimated from
the background-adjusted data along with the coefficientAp. If the mean of the Gaussian term in Eq. (1) was more than 5 keV away from the theoretical peak or the spread was
more than 15 keV, then the data spectrum was discarded as not containing the isotope of interest.
A typical gamma spectrum is shown in the left pane of Fig.2. The right pane of Fig.2 illustrates the region of interest for135Xe, with the data, polynomial background fit and resulting Gaussian fit.
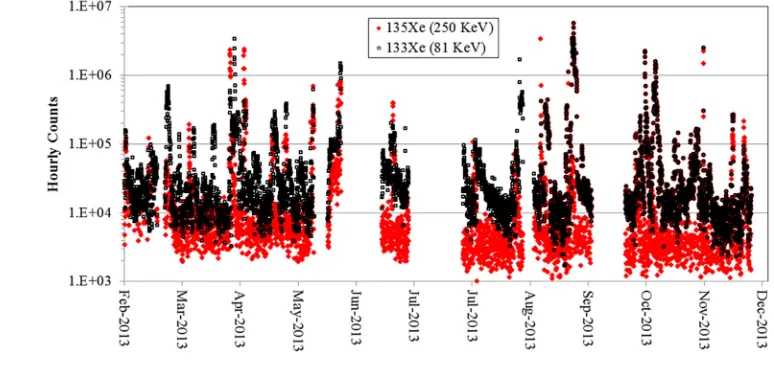
The spectra were analyzed for the noble gas radioiso-topes133Xe and135Xe. These radioisotopes were typically observed in the range of 103–107 counts per hour, as illustrated in Fig.3.
Release estimates (Bq) were calculated for each hour using the formula
Rp ¼
Cp
BratioDeff
FlowstackDt ð2Þ
The coefficient Cpis the number of counts in the peak obtained from summing the Gaussian fit from Eq. (1) at the set of discrete energy levels near the peak, Bratio is the branching ratio for the isotope for the specific energy peak,
Deff is the detector efficiency at the specific peak energy, Flowstack is air flow rate through the stack (m3h-1
) and Dt is the sample collection time (h). The facility air flow rate is a constant 2.29104m3h-1
.
As a validation exercise, the amount of133Xe produced during the irradiation process is calculated from the amount of 99Mo produced and compared to the release estimates. The medical isotope production facility has the capacity to produce about 100 6-day Ci of 99Mo (T1/2=2.75 days) per week although the historical production averages near 40 6-day Ci of 99Mo per week. If there are 100 Ci (3.791012 Bq) of 99Mo remaining 6 days after being packaged for distribution, then about 1.68 91013Bq of 99
Mo was present at the time of packaging. If packaging occurs approximately 1 week after discharge from the reactor, then about 9.8291013 Bq of99Mo was present at the time of discharge from the reactor. We assume that the activity of133Xe is equal to the activity of99Mo at the time of discharge from the reactor [2]. Although the duration of cooling periods and the timing of chemical dissolution and air venting actions vary from batch to batch, we make the assumption that the majority of the resulting 133Xe is vented through the stack halfway between discharge from the reactor and the time of packaging. Using this crude timing assumption, about 691011 Bq of 133Xe may be vented for every 6-day Ci of99Mo produced.
The stack data for June 15–21, 2013 show a release of 1.8491013Bq of 133Xe. Concentrations of 133Xe in the
Table 2 Detection efficiency
for different gamma energies Energy (keV) Efficiency (%)
50 2.39
identified from gamma spectra Isotope Peak energy (keV) Half-life Branching ratio (%) Detector efficiency (%)
135Xe 249.8 9.14 h 90.0 2.05
133
Xe 81.0 5.25 days 36.9 2.75
J Radioanal Nucl Chem
123
air are available at the same time from a xenon sampler located 14 km from BaTek. An optimization process [14] using atmospheric transport modeling and the sampler air
concentrations produced a release estimate of
1.8891013Bq. The same optimization process yielded a release estimate of 1.7091013Bq for a different week in 2012. The stack release value and the two optimized esti-mates are all within 10 % of each other.
Except for one 3-day period, the stack sampler collected data for the entire months of February, March and April of 2013. The facility produced 590 6-day Ci of99Mo over this three-month period. The calculated stack releases over these 3 months results in an estimated release of 4.391011Bq of133Xe per 6-day Ci of99Mo. This is 72 % of the approximate release value derived from fission and rough decay time arguments, and indicates good agree-ment, especially when 1 day of delay in the release of 133
Xe reduces the released quantity by over 12 %. The stack sampler measured an average daily release of 2.891012Bq of133Xe for February, March and April of
2013. The average daily release of 135Xe was
6.591012 Bq for the same time period.
Although a detailed system-level uncertainty analysis was not performed for these calculations, there is about a 15 % uncertainty associated with the calculations prior to using Eq. (2) to convert counts in the sampler to activity released from the stack. The dominant, but unknown, uncertainty in Eq. (2), and the dominant uncertainty in estimates of releases to the environment, is the flow rate of air through the stack. The good agreement between the calculated releases and estimates of possible releases based on the fission yield indicates that the nominal air flow rate assumed for this work is reasonable.
Conclusions
A small stack monitoring system developed by a joint CTBTO-IDC, BATAN, and PNNL team was deployed at the BaTek medical isotope production facility near Jakarta,
Fig. 2 Left paneTypical gamma spectra.Right paneExample of the fitting algorithm results for the135Xe peak fit
Fig. 3 Hourly count data for
133
Xe and135Xe
J Radioanal Nucl Chem
Indonesia. The low-cost stand-alone monitoring system proved reliable in operation and minimal facility changes were required for installation in an existing exhaust air system. The detector system used commercially available components and a portable computer. This type of system could easily be deployed in other facilities without an active monitoring system.
The average daily release from the BaTek medical isotope production facility for February, March and April of 2013 was 2.891012Bq of133Xe and 6.591012Bq of135Xe. These releases are reasonable given the production of 590 6-day Ci of99Mo during this time period and a facility design that does not significantly delay the release of exhaust air to allow decay to reduce activity of the released isotopes.
Acknowledgments The authors wish to acknowledge the funding support of the U.S. Office of Multilateral and Nuclear Affairs in the Bureau of Arms Control, Verification and Compliance Nuclear, at the Department of State and the U.S. Nuclear Arms Control Technology Program, at the Defense Threat Reduction Agency. The stack monitor equipment and data analysis to support the CTBTO in implementing the noble gas verification regime were funded by the European Union through Council Joint Action 2008/588/CFSP of 15 July 2008.
References
1. OECD (2014) Medical Isotope Supply in the Future: Production
Capacity and Demand Forecast for the 99Mo/99mTc Market,
2015–2020. vol NEA/SEN/HLGMR(2014)2. Nuclear Energy Agency. Organisation for Economic Co-Operation and Devel-opment, Paris, France
2. Chadwick MB, Herman M, Oblozˇinsky´ P, Dunn ME, Danon Y, Kahler AC, Smith DL, Pritychenko B, Arbanas G, Arcilla R, Brewer R, Brown DA, Capote R, Carlson AD, Cho YS, Derrien H, Guber K, Hale GM, Hoblit S, Holloway S, Johnson TD, Kawano T, Kiedrowski BC, Kim H, Kunieda S, Larson NM, Leal L, Lestone JP, Little RC, McCutchan EA, MacFarlane RE, MacInnes M, Mattoon CM, McKnight RD, Mughabghab SF, Nobre GPA, Palmiotti G, Palumbo A, Pigni MT, Pronyaev VG, Sayer RO, Sonzogni AA, Summers NC, Talou P, Thompson IJ, Trkov A, Vogt RL, van der Marck SC, Wallner A, White MC, Wiarda D, Young PG (2011) ENDF/B-VII.1 Nuclear Data for Science and Technology: cross sections, covariances, fission product yields and decay data. Nucl Data Sheets 112(12):2887–
2996. doi:10.1016/j.nds.2011.11.002
3. CTBTO (2013) Comprehensive nuclear-test-ban-treaty
organi-zation (CTBTO) preparatory Commission Web Page. http://
www.ctbto.org/. Accessed 19 Sept 2013
4. Saey PRJ, Ringbom A, Bowyer TW, Za¨hringer M, Auer M, Faanhof A, Labuschagne C, Al-Rashidi MS, Tippawan U, Ver-boomen B (2012) Worldwide measurements of radioxenon background near isotope production facilities, a nuclear power plant and at remote sites: the ‘‘EU/JA-II’’ Project. J Radioanal
Nucl Chem. doi:10.1007/s10967-012-2025-2
5. Wotawa G, Becker A, Kalinowski M, Saey P, Tuma M, Za¨hringer M (2010) Computation and analysis of the global distribution of
the radioxenon isotope 133Xe based on emissions from nuclear
power plants and radioisotope production facilities and its rele-vance for the verification of the nuclear-test-ban treaty. Pure Appl
Geophys 167(4–5):541–557. doi:10.1007/s00024-009-0033-0
6. Ringbom A, Axelsson A, Aldener M, Auer M, Bowyer TW, Fritioff T, Hoffman I, Khrustalev K, Nikkinen M, Popov V, Popov Y, Ungar K (2013) Wotawa G (2014) Radioxenon detections in the CTBT international monitoring system likely related to the announced nuclear test in North Korea on February
12. J Environ Radioact 128:47–63. doi:10.1016/j.jenvrad.2013.
10.027
7. Becker A, Wotawa G, Ringbom A, Saey PRJ (2010) Back-tracking of noble gas measurements taken in the aftermath of the announced October 2006 event in North Korea by means of PTS methods in nuclear source estimation and reconstruction. Pure
Appl Geophys 167(4):581–599. doi:10.1007/s00024-009-0025-0
8. Kalinowski M, Axelsson A, Bean M, Blanchard X, Bowyer T, Brachet G, Hebel S, McIntyre J, Peters J, Pistner C, Raith M, Ringbom A, Saey P, Schlosser C, Stocki T, Taffary T, Kurt Ungar R (2010) Discrimination of nuclear explosions against civilian sources based on atmospheric xenon isotopic activity
ratios. Pure Appl Geophys 167(4):517–539. doi:
10.1007/s00024-009-0032-1
9. Za¨hringer M, Becker A, Nikkinen M, Saey P, Wotawa G (2009) CTBT radioxenon monitoring for verification: today’s challenges.
J Radioanal Nucl Chem 282(3):737–742. doi:
10.1007/s10967-009-0207-3
10. Bowyer TW, Kephart R, Eslinger PW, Friese JI, Miley HS, Saey PRJ (2013) Maximum reasonable radioxenon releases from medical isotope production facilities and their effect on moni-toring nuclear explosions. J Environ Radioact 115(1):192–200. doi:10.1016/j.jenvrad.2012.07.018
11. van Loef EVD, Dorenbos P, van Eijk CWE, Kra¨mer K, Gu¨del HU
(2000) High-energy-resolution scintillator: Ce3?
activated LaCl3.
Appl Phys Lett 77(10):1467–1468. doi:10.1063/1.1308053
12. Agostinelli S, Allison J, Amako K, Apostolakis J, Araujo H, Arce P, Asai M, Axen D, Banerjee S, Barrand G, Behner F, Bellagamba L, Boudreau J, Broglia L, Brunengo A, Burkhardt H, Chauvie S, Chuma J, Chytracek R, Cooperman G, Cosmo G, Degtyarenko P, Dell’Acqua A, Depaola G, Dietrich D, Enami R, Feliciello A, Ferguson C, Fesefeldt H, Folger G, Foppiano F, Forti A, Garelli S, Giani S, Giannitrapani R, Gibin D, Go´mez Cadenas JJ, Gonza´lez I, Gracia Abril G, Greeniaus G, Greiner W, Grichine V, Grossheim A, Guatelli S, Gumplinger P, Hamatsu R, Hashimoto K, Hasui H, Heikkinen A, Howard A, Ivanchenko V, Johnson A, Jones FW, Kallenbach J, Kanaya N, Kawabata M, Kawabata Y, Kawaguti M, Kelner S, Kent P, Kimura A, Kodama T, Kokoulin R, Kossov M, Kurashige H, Lamanna E, Lampe´n T, Lara V, Lefebure V, Lei F, Liendl M, Lockman W, Longo F, Magni S, Maire M, Medernach E, Minamimoto K, Mora de Freitas P, Morita Y, Murakami K, Nagamatu M, Nartallo R, Nieminen P, Nishimura T, Ohtsubo K, Okamura M, O’Neale S, Oohata Y, Paech K, Perl J, Pfeiffer A, Pia MG, Ranjard F, Rybin A, Sadilov S, Di Salvo E, Santin G, Sasaki T, Savvas N, Sawada Y, Scherer S, Sei S, Sirotenko V, Smith D, Starkov N, Stoecker H, Sulkimo J, Takahata M, Tanaka S, Tch-erniaev E, Safai Tehrani E, Tropeano M, Truscott P, Uno H, Urban L, Urban P, Verderi M, Walkden A, Wander W, Weber H, Wel-lisch JP, Wenaus T, Williams DC, Wright D, Yamada T, Yoshida H, Zschiesche D (2003) Geant4—a simulation toolkit. Nucl
Instrum Methods A 506(3):250–303. doi:10.1016/S0168-9002(03)
01368-8
13. NuDat (2014) NuDat 2.6 database, nuclear structure and decay data. National Nuclear Data Center, Brookhaven National
Labo-ratory.http://www.nndc.bnl.gov/nudat2/. Accessed 20 Sept 2014
14. Eslinger PW, Cameron IM, Dumais JR, Imardjoko Y, Marsoem P, McIntyre JI, Miley HS, Stoehlker U, Widodo S, Woods VT (2015) Source term estimates of radioxenon released from the BaTek medical isotope production facility using external
mea-sured air concentrations. J Environ Radioact 148:10–15. doi:10.