T H E J O U R N A L O F H U M A N R E S O U R C E S • 46 • 4
Supply in the Developing World
Evidence from Infertility Shocks
Jorge M. Agu¨ero
Mindy S. Marks
A B S T R A C T
We introduce a new instrument for family size, infertility, to investigate the causal relationship between children and female labor force participation. Infertility mimics an experiment where nature assigns an upper bound for family size, independent of a woman’s background. This new instrument al-lows us to investigate the differential labor supply without restrictions on initial family size. Using the Demographic and Health Surveys from 26 de-veloping countries we show that OLS estimates are biased upward. We find that the presence of children affects neither the likelihood of work nor its intensity, but impacts the type of work a woman pursues.
I. Introduction
The increasing representation of women in the global labor force has been one of the most remarkable labor market trends of recent times. Never before have so many women been economically active: Worldwide, the female labor force was 1.2 billion women in 2003 (International Labor Office 2004). The last 40 years also have witnessed a dramatic global decline in fertility in the developing world. According to the United Nations, the total fertility rate in the less-developed regions of the world is 2.75 children per woman in 2005–2010, down from 5.41 children per women in 1970–75 (United Nations, World Population Prospects 2007). A
neg-Jorge M. Agu¨ero is an assistant professor in the Department of Economics, University of California, Riverside. Mindy S. Marks is an associate professor in the Department of Economics, University of Cali-fornia, Riverside. The authors thank Todd Sorensen, Joanna Lahey for suggestions on an earlier draft of this paper, as well as seminar participants at the University of Southern California, University of Kwa-Zulu Natal, University of Cape Town, the Society of Labor Economics and the Western Economic con-ference for their comments.Trinidad Beleche, Neha Raykar, Sheetal Bharat and Shruti Kapoor provided excellent research assistance and Kathryn Radzik provided editorial assistance. The data used in this article are from the publicly available website http://www.measuredhs.com. Any user can have access to them after registering (which is free).
[Submitted March 2010; accepted October 2010]
ative correlation between the presence of children and female participation in the labor force is well established both over time and across countries and many scholars have posited a causal relationship between these series.1
However, the interpretation of the relationship between family size and mother’s work is complicated by the endogeneity of fertility. The number of children a woman has is a choice variable that is influenced by her labor force participation. Addition-ally, unobserved factors are likely to influence both fertility and female labor force participation. For instance, more independent women may choose to have fewer (or no) children and these women may also be overrepresented in the labor force. Thus, the observed negative relationship between children and labor force participation could be biased. The amount of bias may vary by stages of development as the necessity of female employment decreases with economic development. Thus, if poorer women have fewer choices, OLS estimates for this group should suffer from less bias.
To clearly identify the relationship between children and labor force participation an exogenous source of variation in family size is needed. In this paper, we focus on a new source of variation in family size based on biological events. In particular, we use infertility shocks as an instrument for family size to identify the causal effect of children on female labor force participation. Clearly, infertility affects the number of children a woman can have. In our sample, infertile or subfecund women report 1.2 fewer children than their fertile counterparts. In addition, we show that back-ground characteristics of women appear to be unrelated to infertility. Thus, an in-dicator variable for the infertility status of women of childbearing age is a plausible instrument for family size.
Previous strategies that use twinning (Rosenzweig and Wolpin 1980) or sex com-position of the first two children (Angrist and Evans 1998) as instruments for family size restrict the sample to women who have had at least one or two births, respec-tively. Papers that use these approaches are limited to the effect of having an ad-ditional child on female labor force participation conad-ditional on reaching a specific parity. An advantage of our instrument, in contrast, is the possibility to identify the causal effect of children on female labor force participation irrespective of the num-ber of existing children, and therefore it represents a broader sample of women. In addition we estimate a different Local Average Treatment Effect (LATE) than the one associated with sex mix or twinning. The women whose family size is altered by the sex composition of their children or a twin birth are women with low un-derlying desired fertility, whereas infertility “removes” children from women with high underlying desired fertility.
The use of biological events such as infertility to understand the causal role of family size on female labor force participation is understudied in the developing
world, although the use of these types of events is prevalent in the United States.2 Furthermore, most of the existing empirical work in developing countries focuses on a particular country or region of the world. For example, Cruces and Galiani (2007) use the sex composition of the first two children to identify the relationship between family size and labor force participation in Mexico and Argentina. They find that women who are induced to have a third child, out of a desire for a balanced sex mix of their offspring, are less likely to participate in the paid labor force. The use of sex composition has been criticized by Schultz (2008) and others because the gender of children could have a wealth effect in countries where dowries are re-quired. Ca´ceres-Delpiano (2009) is the only paper we are aware of that contains a global sample of women and exogenous variation in family size at the micro level. He exploits the variation in family size due to twinning on the first birth, which causes some families (those with low desired fertility) to have larger families than they would otherwise desire. He finds heterogeneous effects depending on the parity affected and the margin of analysis.3
Agu¨ero and Marks (2008) focus on Latin America and find no causal relationship between family size and female labor force participation. We employ a similar strat-egy to this paper but improve it along several dimensions. First, our work reflects a more globally representative sample, including 26 countries as opposed to six. This allows us to investigate heterogeneous responses by the level of development, which is not possible using Latin American countries alone. We also use a broader set of outcome variables. Agu¨ero and Marks (2008) study participation in paid work only, while in this paper we explore overall participation (paid and unpaid) as well as the intensity of work. We also consider carefully the possibility of measurement error in the self-reported infertility indicator and present a wider set of robustness tests. Finally, unlike Agu¨ero and Marks (2008), we also investigate the effect of family size on the labor force participation of younger women (aged 35 or younger) and find a significant negative effect in their paid labor force participation.
Our data set includes 90,965 women in low-income and mid-income countries. OLS estimates suggest an additional child reduces the overall (paid or unpaid) female labor force participation. Our main finding is that, after using the infertility instru-ment, children have a much smaller causal effect on the overall labor force partic-ipation of women. This finding is robust to the inclusion of health indicators, alter-native definitions of family size, and when the outcome explores work intensity. However, the results suggest that children affect negatively the likelihood of working for cash for young women and also for those living in very low-income countries.
2. Recent quasi-experimental research in the United States suggests that declining fertility rates can explain little to none of the changes in women’s labor force participation over time. See Bronars and Grogger (1994) and Jacobsen et al. (1999) (twinning); Hotz, McElroy, and Sanders (2005) (miscarriage); Angrist and Evans (1998) (the sex composition of the first two children). Our identification strategy most closely resembles Cristia (2008), who investigates differences in employment outcomes by child status for women seeking help to become pregnant. He finds a large negative short-run impact on female labor force partic-ipation owing to the birth of a first child. Our approach is also similar to Li (2005), who exploits miscar-riages and finds a negative and significant impact on labor supply.
II. Infertility, Data and Methods
A. DataThe medical literature defines infertility (or subfecundity) as the failure to conceive after a year of regular intercourse without contraception. Infertility can be further broken down into primary infertility, which describes women who have never been able to conceive a pregnancy, and secondary infertility, describing those who have had at least one successful pregnancy, but have not been able to achieve another.
In this paper we use cross-sectional data from the third round of the Demographic and Health Surveys (DHS III) collected between 1994 and 1999. The DHS are standardized nationally representative household surveys in developing countries. Women answered questions about their employment status, birth history, current and future contraceptive use, fertility preferences, and their socioeconomic and marital status. In some countries, anthropometric measures including height and weight were collected.
The DHS III allow us to identify self-reported infertility in two ways from two separate questions asked to all women. The first way is when women mentioned subfertility or infertility as their reason for not currently using contraceptives ( In-fertile 1). The second way is when nonsterilized women responded that they are unable to have more children when asked about their desire for future children (Infertile 2). Our main infertility indicator is the union of these two measures: max⳱{Infertility 1, Infertility 2}. We define labor force participation as a variable
that takes the value of one if a woman reported working at all (paid or unpaid) in the last 12 months and zero otherwise. As additional outcome variables we will narrow the definition of work. The first classifies a woman as working if she was paid in cash in the last 12 months, and the second if she works year round.
Not all countries with a DHS III could be included in the analysis. To be included a survey had to meet the following criteria: (1) the survey had to include questions that were used to identify infertile women and these questions needed to be asked to the entire sample of women; (2) the infertility questions needed to include infer-tile, subferinfer-tile, subfecund, or unable to get pregnant as a standalone response; (3) the survey had to contain information about participation in the labor force and intensity of work in a consistent manner; (4) the data had to be publicly available. Our final sample contains 27 surveys representing 26 countries. In some specifica-tions, we will split the sample by income levels (mid-income versus low-income) to investigate whether there are heterogeneous effects by stage of development. Ap-pendix Table A1 contains additional information about the countries included in our sample.
B. Sample Construction
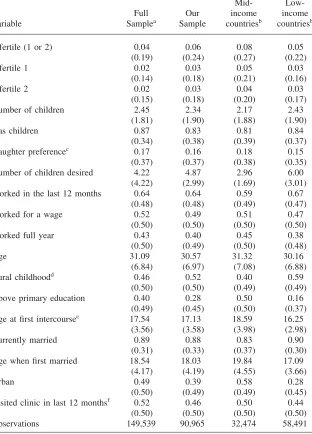
than 60 percent of the women surveyed in the DHS III.4Columns 1 and 2 of Table 1 compare our sample to an equivalent sample that includes women who are actively controlling their fertility (denoted by “Full Sample”). Women who actively control their fertility are more likely to live in urban areas and are more educated. However, the two groups of women are similar in age and have similar family sizes and work behavior.
Summary statistics for our sample are contained in Column 2 of Table 1. We also present information divided by income level of the country according to the World Bank’s World Development Indicators. The average woman in our sample is 31 years old with 2.3 children, and 6 percent report being infertile.564 percent of our sample worked either for pay or in kind in the last 12 months, 49 percent of our sample worked for pay and 40 percent worked year round. Women in the more developed countries are much more educated, more likely to reside in an urban area, desire much smaller families, have smaller families, and are more likely to report infertility.
C. Estimation Strategy
To assess the causal effect of family size on mothers’ labor force participation, we use infertility as an IV for number of children in the household.
For the sample described above, the main specification is given by Model 1:
⬘ LFP⳱␣ⳭKⳭ ␥AGE ⳭX ␦Ⳮe
(1) i i
兺
j j ji i iwhereLFPiis equal to one if theith woman is in the labor force and zero otherwise.
The key variableKicaptures the number/presence of children living at home. Thus, is the parameter of interest. Because there is a nonlinear relationship between age and infertility for women, we include a flexible functional form of age by including 24 binary variables (one per age in years and indexed by j) in all specifications. VectorXiincludes survey fixed effects in Model 1. Model 2 adds to Model 1 other variables that may influence female labor force participation, such as education, age and education interactions, age at first intercourse, marital status, age at first mar-riage, and spouse’s education. Model 3 contains all of the variables in Model 2 plus an indicator of health status. Finally, in all specifications the standard errors are clustered at subnational levels (for example, departments, provinces, or districts de-pending on the country).
OLS estimates ofare likely to be biased due to unobserved variables inei. The direction of bias is given by two elements: the relationship between the omitted variable and the outcome variable (LFPi), and its relationship with the variable of interest (Ki). In particular, consider the case where female autonomy influences labor force participation. If autonomy correlates positively with the outcome variable and negatively with the number of children, excluding this variable from Equation 1 biases the OLS estimates upward since part of the estimated effect of children on labor force participation can be attributed to the lack of female female autonomy.
Table 1
Infertile (1 or 2) 0.04 0.06 0.08 0.05
(0.19) (0.24) (0.27) (0.22)
Infertile 1 0.02 0.03 0.05 0.03
(0.14) (0.18) (0.21) (0.16)
Infertile 2 0.02 0.03 0.04 0.03
(0.15) (0.18) (0.20) (0.17)
Number of children 2.45 2.34 2.17 2.43
(1.81) (1.90) (1.88) (1.90)
Has children 0.87 0.83 0.81 0.84
(0.34) (0.38) (0.39) (0.37)
Daughter preferencec 0.17 0.16 0.18 0.15
(0.37) (0.37) (0.38) (0.35)
Number of children desired 4.22 4.87 2.96 6.00
(4.22) (2.99) (1.69) (3.01)
Worked in the last 12 months 0.64 0.64 0.59 0.67
(0.48) (0.48) (0.49) (0.47)
Worked for a wage 0.52 0.49 0.51 0.47
(0.50) (0.50) (0.50) (0.50)
Worked full year 0.43 0.40 0.45 0.38
(0.50) (0.49) (0.50) (0.48)
Age 31.09 30.57 31.32 30.16
(6.84) (6.97) (7.08) (6.88)
Rural childhoodd 0.46 0.52 0.40 0.59
(0.50) (0.50) (0.49) (0.49)
Above primary education 0.40 0.28 0.50 0.16
(0.49) (0.45) (0.50) (0.37)
Age at first intercoursee 17.54 17.13 18.59 16.25
(3.56) (3.58) (3.98) (2.98)
Currently married 0.89 0.88 0.83 0.90
(0.31) (0.33) (0.37) (0.30)
Age when first married 18.54 18.03 19.84 17.09
(4.17) (4.19) (4.55) (3.66)
Urban 0.49 0.39 0.58 0.28
(0.50) (0.49) (0.49) (0.45)
Visited clinic in last 12 monthsf 0.52 0.46 0.50 0.44
(0.50) (0.50) (0.50) (0.50)
Observations 149,539 90,965 32,474 58,491
a. Full sample adds back in women who were currently taking contraceptives. b. Countries are classified according to the World Bank’s World Development Indicators. c. Missing for Comoros and South Africa (only numeric answers included).
We will use infertility to instrument forKiin Equation 1 to address the endogeneity concern.
III. Estimation Issues
A. Endogenous InstrumentsFertility is highly heterogeneous across couples. Determining the sources of such heterogeneity among couples remains a challenge for fertility research (Weinberg and Dunson 2000). Below, we summarize some findings from the medical literature. It is well established that infertility increases with a woman’s age (see Dunson, Baird, and Colombo 2004 and Buck et al. 1997). However, the medical literature is not in agreement about what other factors, if any, influence infertility. For example, there is some evidence suggesting that previous use of birth control, as well as indicators of poor health such as sexually transmitted diseases, smoking, drinking, extreme body mass index (BMI), and miscarriages are associated with infertility (see Augood, Duckitt, and Templeton 1998; Gesink Law et al. 2007; Grodstein, Goldman, and Cramer 1994; Hassan and Killick 2005). However, the majority of this evidence is suspect as it comes from couples recruited for prospective studies (Negro-Vilar 1993). That is, couples experiencing fertility problems are recruited for a study and their observable characteristics are then correlated with their time to pregnancy.6 This type of study design has been shown to produce spurious associations (Juul, Keiding, and Tvede 2000).
There is evidence that infertility appears to be independent of the background characteristics of infertile women. For example, variables such as father’s social class and parity have been shown to be unrelated to observed heterogeneity in fer-tility (Joffe and Barnes 2000). In an article summarizing the epidemiological liter-ature regarding the role of lifestyle factors (cigarette smoking, alcohol and caffeine consumption, exercise, BMI, and drug use) on female infertility, Buck et al. (1997) conclude that “[f]ew risk factors have been assessed or identified for secondary infertility.” Also, education, occupation, and race have been shown to be unrelated with impaired fecundity (Wilcox and Mosher 1993; Chandra 1994) using U.S. data from the National Survey of Family Growth.
We present new evidence that infertility is not correlated with “predetermined” or background characteristics of women. Infertility is a valid instrument if it is unrelated to omitted variables that influence labor force participation. Table 2 presents evi-dence on the validity of our instrument. This table reports coefficient estimates for our fertility measures from a series of regressions (indexed byVi) that, in addition
to fertility status, control for age nonparametrically as follows:
V⳱InfertileⳭ(1ⳮInfertile)Ⳮ AGE Ⳮ
(2) i 1 i 2 i
兺
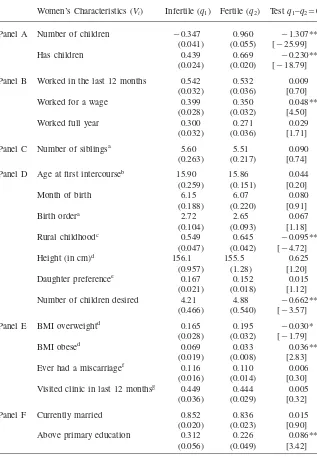
j j ji iTable 2
Women’s Characteristics by Fertility Status
Women’s Characteristics (Vi) Infertile (q1) Fertile (q2) Testq1–q2⳱0
Panel A Number of children ⳮ0.347 0.960 ⳮ1.307**
(0.041) (0.055) [ⳮ25.99]
Has children 0.439 0.669 ⳮ0.230**
(0.024) (0.020) [ⳮ18.79]
Panel B Worked in the last 12 months 0.542 0.532 0.009
(0.032) (0.036) [0.70]
Worked for a wage 0.399 0.350 0.048**
(0.028) (0.032) [4.50]
Worked full year 0.300 0.271 0.029
(0.032) (0.036) [1.71]
Panel C Number of siblingsa 5.60 5.51 0.090
(0.263) (0.217) [0.74]
Panel D Age at first intercourseb 15.90 15.86 0.044
(0.259) (0.151) [0.20]
Month of birth 6.15 6.07 0.080
(0.188) (0.220) [0.91]
Birth ordera 2.72 2.65 0.067
(0.104) (0.093) [1.18]
Rural childhoodc 0.549 0.645 ⳮ0.095**
(0.047) (0.042) [ⳮ4.72]
Height (in cm)d 156.1 155.5 0.625
(0.957) (1.28) [1.20]
Daughter preferencee 0.167 0.152 0.015
(0.021) (0.018) [1.12]
Number of children desired 4.21 4.88 ⳮ0.662**
(0.466) (0.540) [ⳮ3.57]
Panel E BMI overweightd 0.165 0.195 ⳮ0.030*
(0.028) (0.032) [ⳮ1.79]
BMI obesed 0.069 0.033 0.036**
(0.019) (0.008) [2.83]
Ever had a miscarriagef 0.116 0.110 0.006
(0.016) (0.014) [0.30]
Visited clinic in last 12 monthsg 0.449 0.444 0.005
(0.036) (0.029) [0.32]
Panel F Currently married 0.852 0.836 0.015
(0.020) (0.023) [0.90]
Above primary education 0.312 0.226 0.086**
(0.056) (0.049) [3.42]
Table 2(continued)
Women’s Characteristics (Vi) Infertile (q1) Fertile (q2) Testq1–q2⳱0
Urban 0.435 0.325 0.109**
(0.043) (0.034) [5.97]
Age at first marriage 16.55 16.13 0.427
(0.300) (0.301) [1.61]
Notes: * denotes significance at 10 percent, ** at 5 percent, and *** at 1 percent. Standard errors in parenthesis andt-statistics in brackets.
a. Missing for Bolivia (1998), Colombia, Dominican Republic, Ghana, Guatemala, Kazakhstan, Comoros, Kyrgyz Republic, Nicaragua, Niger, Nepal, and Uzbekistan.
b. Missing for Nicaragua/excludes inconsistent and don’t know. c. Missing for Guinea, Madagascar, and Philippines.
d. Only available for Colombia, Dominican Republic, Kazakhstan, and Kyrgyz Republic. e. Missing for Comoros and South Africa (only numeric answers included).
f. Missing for Benin, Bolivia (1998), Guinea, Comoros, Mozambique, and Zambia. g. Missing for Ghana.
In essence, these regressions ask, conditional on age, whether infertile women are different from their fertile counterparts (1ⳮ2⳱0) in terms of observable charac-teristics. We control for age as the average fertile woman in the sample is 30.2, while the average infertile woman is 35.9 and different cohorts of women have different background traits.7
Panel A of Table 2 confirms that infertile women have significantly fewer children than their fertile counterparts. On average, after conditioning on age, infertile women have 1.3 fewer children. Additionally, infertile women are 23 percentage points more likely to be childless than their fertile counterparts. Panel B presents a preliminary look at our main findings. While infertile women have fewer children than fertile women, there appears to be no difference in their likelihood of working in the last 12 months or in the odds of their working year round. Infertile women do appear to be more likely to work for a wage.
If there is a genetic component to fertility problems, then women for whom bi-ology restricts their family size will have the additional advantage of having fewer siblings and will have had access to more parental resources via a quality quantity tradeoff. If this is the case, any increase in labor force participation associated with fewer children may be due to the fact that women who bear fewer children had higher “quality” upbringings.
The data do not allow us to directly measure the intergeneration correlation of fertility problems. However, for a subsample of the countries in our analysis we can investigate if infertile women, on average, come from smaller families than their fertile counterparts. These results can be seen in Panel C of Table 2. The data suggest
that infertile women have as many siblings as their fertile counterparts. Additional evidence from twin studies (Christensen et al. 1998) suggests that the genetic com-ponent of infertility is minimal.
Panel D of Table 2 demonstrates that for many important background variables, infertile women mirror their fertile counterparts. They became sexually active at the same age, they were born in similar times of the year, they have similar numbers of older siblings, and they are the same height. When asked about their gender preference over offspring there is no difference by fertility status. Infertility thus mimics an experiment in which nature assigns to each woman an upper bound for the number of children, independent of background.
We find weak evidence in Panel E that current health is related to fertility. Infertile women are more likely to report being obese, but they are no more likely to have paid a recent visit to a health clinic or to have miscarried. When we turn in Panel F to current attributes, which may be decided after the onset of infertility, we find little difference in marriage behavior. However, infertile women are more educated than their fertile counterparts and they are more likely to reside in urban areas. Given the difference in contemporaneous traits between fertile and infertile women, the main model will condition on marital status, education, and current location. How-ever, our results are not sensitive to the inclusion of these additional controls, nor to the inclusion of health indicators.
IV. Results
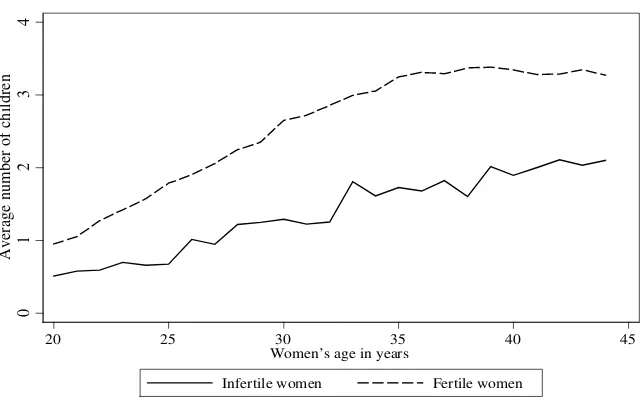
A. Main FindingsIdentification of the IV model requires a strong correlation between our measure of infertility and family size. Figure 1a shows a visual representation of the first-stage results. The dotted line displays the average number of children for fertile women by age. The solid line represents the analog for infertile women. For all ages, it is clear that infertility is highly correlated with the number of children a woman has. Given the strength of ourF-statistics (see Tables 3, 4, and 6–9, below), there is no evidence of weak instruments in our first-stage results.
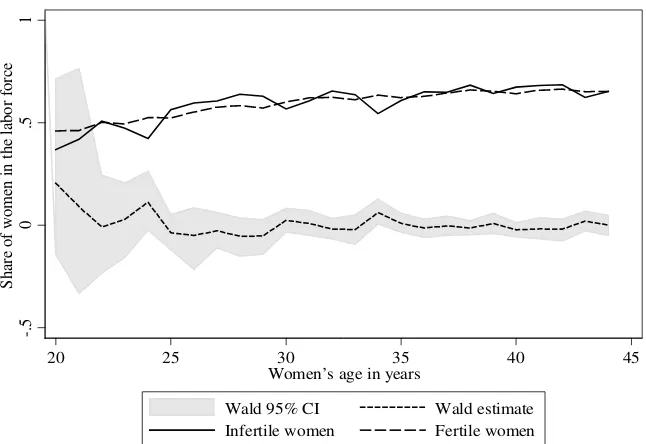
A key result of our paper can be seen in Figure 1b, which shows the proportion of women who worked (paid cash or not) in the 12 months prior to the surveys by their infertility status and age. While infertility has a strong association with family size, the raw data in Figure 1b show that there are not systematic differences in female labor force participation by infertility status. The Wald estimate (short-dash line) computes the ratio of the difference in labor force participation over the dif-ference in the number of children by infertility status and age. The Wald estimates show that there is no association between changes in family size, brought by infer-tility, and female labor force participation. In Table 3 we present the regression counterparts to this graphical representation.
Column 1 in Table 3 presents the OLS estimate, which suggests that each addi-tional child decreases labor force participation by 2.4 percentage points.8Column 2
0
1
2
3
4
Average number of children
20 25 30 35 40 45
Women’s age in years
Infertile women Fertile women
Figure 1a
Average Number of Children by Infertility Status
contains the corresponding 2SLS estimate. It suggests that the effect of children on labor force participation, using the variation in the number of children that comes through the infertility channel, is much smaller than the OLS estimates would sug-gest. This is a key result of the paper. This finding, of little to no casual impact of children on female labor force participation, is similar to the evidence from twin studies for married women in the United States (Bronars and Grogger 1994; Jacob-sen et al. 1999). The 2SLS point estimate (ⳮ0.006) is close to zero and statistically
insignificant, suggesting that the OLS parameter was biased. This is consistent with the case where unobserved variables, such as female autonomy, religiosity, or career ambition, are important factors driving both female employment and smaller family size.
To further support that infertility is a valid instrument, it is instructive to consider several potential threats to the validity of a causal interpretation. For instance, edu-cated women are more likely to report infertility and eduedu-cated women are more likely to work. If infertility is unrelated to other determinates of labor force partic-ipation, then their inclusion should not alter our findings. In Model 2 (Columns 3 and 4) we add controls for education, age and education interactions, marital status,
-.
5
0
.5
1
S
ha
re
of w
om
en i
n t
he
l
abor forc
e
20 25 30 35 40 45
Women’s age in years
Wald 95% CI Wald estimate
Infertile women Fertile women
Figure 1b
Labor Force Participation by Infertility Status and Wald Estimates
Notes: Author’s calculation based on the DHS III of countries selected. The 95 percent bootstrapped confidence intervals were calculated based on 1,000 replications.
Table 3
Number of Children and Labor Force Participation of Women
Dependent variable: Women worked in the last 12 months (⳱1)
Model 1 Model 2
OLS 2SLS OLS 2SLS
(1) (2) (3) (4)
Number of children ⳮ0.024*** ⳮ0.006 ⳮ0.017*** ⳮ0.005
[0.002] [0.008] [0.002] [0.007]
Observations 90,965 90,965 90,965 90,965
F-statistic (first stage) 814.2 853.9
spouse’s education, age at first intercourse, and current location to the controls for age and survey contained in Model 1. While the coefficient on the OLS decreases in magnitude, the IV estimates are unchanged by the inclusion of these additional control variables.
We are particularly concerned that infertility is proxying for poor health and that poor health could directly influence labor force participation, invalidating our iden-tification strategy. As cited above, some medical literature suggests a relationship between poor health and infertility. However, Field and Ambrus (2008) review more than 60 biomedical studies and conclude that the onset of menarche is not associated with socioeconomic status indicators, including malnutrition. This is consistent with the review of Behrman and Deolalikar (1988) and Behrman, Deolalikar, and Wolfe (1988), in which they explore the effect of nutrition on fertility. They report that studies that have systematically reviewed the evidence show little support for the nutrition-fertility link. Also, the authors point out that the few attempts to estimate the birth production function are likely to suffer from problems of reverse causality and endogeneity (Behrman and Deolalikar 1988, p. 690).
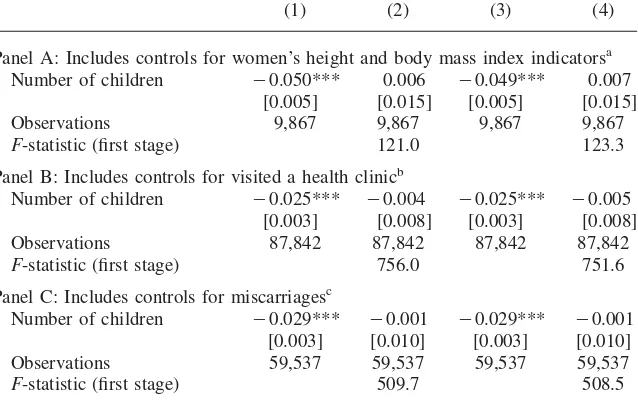
A consistent set of health indicators is not available for the full sample. For a small subsample of countries, we have anthropometric measures of health (height and categorical body mass index indicators for underweight, overweight, and obese). The results when reestimating Model 2 for the subsample that contains anthropo-metric measures are shown in Panel A of Table 4. In Panel B, for a different but larger set of countries, we have information on whether women visited a health clinic in the last year. Panel C contains results for an alternative sample for which we have information on miscarriages.
The first two columns of Table 4 show the results estimating Model 2 for the restricted subsample of surveys that contain the specific health-related variables in each panel. In all cases, there is a clear negative correlation between the number of children and female labor force participation, but it disappears when using 2SLS. This is analogous to the result in Table 3. For example, in Panel A, for the subsample that contains height and BMI indicators, the OLS estimate suggests that each child reduces labor supply by five percentage points, while the 2SLS estimate is a statis-tically insignificant 0.006. Columns 3 and 4 add the corresponding health-related variables to the subsamples, and the parameter estimates are very close to estimates in Columns 1 and 2. The 2SLS parameters in Column 4 are small, insignificant, and sometimes positive. The results of this table suggest that omitted health factors are not contaminating our estimates.9To preserve sample size, for the remainder of the analysis we will focus on Model 2 (which excludes health controls), although all findings are robust to the other model specifications described here.
Table 4
Number of Children and Labor Force Participation with Health Controls
Dependent variable: Woman worked in the last 12 months
Model 2 With health variables
OLS 2SLS OLS 2SLS
(1) (2) (3) (4)
Panel A: Includes controls for women’s height and body mass index indicatorsa
Number of children ⳮ0.050*** 0.006 ⳮ0.049*** 0.007
[0.005] [0.015] [0.005] [0.015]
Observations 9,867 9,867 9,867 9,867
F-statistic (first stage) 121.0 123.3
Panel B: Includes controls for visited a health clinicb
Number of children ⳮ0.025*** ⳮ0.004 ⳮ0.025*** ⳮ0.005
[0.003] [0.008] [0.003] [0.008]
Observations 87,842 87,842 87,842 87,842
F-statistic (first stage) 756.0 751.6
Panel C: Includes controls for miscarriagesc
Number of children ⳮ0.029*** ⳮ0.001 ⳮ0.029*** ⳮ0.001
[0.003] [0.010] [0.003] [0.010]
Observations 59,537 59,537 59,537 59,537
F-statistic (first stage) 509.7 508.5
Notes: Robust standard errors (in brackets) are clustered at the subnational level. * denotes significance at 10 percent, ** at 5 percent, and *** at 1 percent. Model 2: educational attainment, age, age and education interactions, age at first intercourse, marital status, age at first marriage, and spouse’s education and survey fixed effects. The additional controls added for Columns 3 and 4 are described in each panel. We include underweight, overweight, and obese as BMI indicators. The 2SLS instrument for children at home using the union of the infertility measures. TheF-statistic refers to the first-stage results.
a. Anthropometric information only available for Colombia, Dominican Republic, Kazakhstan, and Kyrgyz Republic.
b. Missing for Nigeria.
c. Missing for Benin, Bolivia (1998), Guinea, Comoros, Mozambique, and Zambia.
B. Accuracy of Self-Reported Measures of Infertility
A potential concern with the data used in this paper is measurement error due to the self-reported nature of the infertility measure.10Women may be ignorant of their true underlying fertility, they may fear revealing fertility problems to a survey taker, they may have idiosyncratic definitions of infertility, or they may be medically in-fertile but offer other reasons for why they are not using contraception or do not desire additional children. The two survey questions used to classify women as infertile are asked to the full sample of women, yet about two-thirds of the women
who report infertility in one question provide a response other than infertility to the other survey question. For instance, some women who state that they cannot have additional children, when asked about their desire for future children offer early menopause, ignorance about birth control, or infrequent sexual activity as the main reason for not using contraceptives.
We acknowledge the possible presence of measurement error in the reports of infertility; however, we do not expect measurement error to present a significant problem for two reasons. First, classical measurement error in an instrumental vari-able does not bias the estimated impact of children on labor force participation.11 Second, self-reported measures of infertility are strongly correlated with biologically measured infertility. In a widely cited paper, Cates, Farley, and Rowe (1985) con-ducted a worldwide study to provide a standard approach to compare infertility patterns in couples in 33 medical centers from 25 countries. From 1979 to 1984 the study compiled information about couples seeking medical evaluation for their reported infertility problem. They show that the percentage of couples who self-reported infertility and became pregnant at some point during the investigation ranged from 16 percent in Asia and Africa, to 12 percent for developed areas in Europe and Australia. This suggests a relatively low level of measurement error in the self-reported infertility rates of couples.12
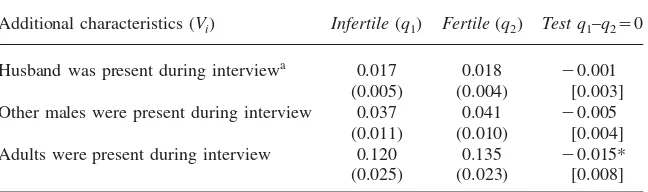
An additional concern is that women who answered the questionnaire in the pres-ence of family members (especially male family members) might misrepresent their fertility status. For example, women with low bargaining power within the marriage could choose to report themselves as infertile when the husband is present as a way to hide the real reason for their lack of contraceptive use. These reasons could include the husband or other adults prohibiting the woman’s use of family planning methods. To investigate this concern, we employ the strategy described in Equation 2 with the presences of male family members as the variable of interest. In Table 5 we show that there is no systematic relationship between the presence of a husband, the presence of other males, or the presence of other family members at the time of the survey and the likelihood self-reported infertility. This evidence allows us to reject another type of possible misclassification of our infertility measures.
Finally, Table 6 explores the robustness of our main finding to various specifi-cations of the instrument. The first column replicates the 2SLS results in Table 3,
11. Mathematically we have a system of the following two equations Ki⳱X⬘10Ⳮ11ZiⳭ1i and
LFPi⳱X⬘20Ⳮ21ZiⳭ2iwhere the parameter11captures the first-stage effects ofZionKi, adjusting for
covariates. The parameter 21captures the reduced form effects ofZionLFPiadjusting for the same
covariates. The covariate-adjusted IV estimator is the sample analog of the ratio21/11⳱(Angrist and Pischke 2008). Suppose thatZiis measured with classical measurement error such that where
* Zj⳱ZjⳭej
is true infertility. Under classical measurement error the following is true and
* ˆ
Zj plim(21)⳱21
whereis the reliability ratio which is equal to * Wooldridge (2001). ˆ
plim(22)⳱22 Cov(Zi,Zi)/Var(Zi) Thes cancel out and the covariate-adjusted IV estimator remains, and thus is unbiased.
Table 5
Presence of other Adults and Fertility Status
Additional characteristics (Vi) Infertile(q1) Fertile(q2) Test q1–q2⳱0
Husband was present during interviewa 0.017 0.018 ⳮ0.001
(0.005) (0.004) [0.003]
Other males were present during interview 0.037 0.041 ⳮ0.005
(0.011) (0.010) [0.004]
Adults were present during interview 0.120 0.135 ⳮ0.015*
(0.025) (0.023) [0.008]
Notes: * denotes significance at 10 percent, ** at 5 percent, and *** at 1 percent. Standard errors in parenthesis andt-statistics in brackets.
a. For married women only.
where a woman is classified as infertile if she responds in the affirmative to either of the infertility questions (max⳱{Infert1,Infert2}). Columns 2 and 3 present 2SLS
estimates where each of the survey questions that solicit information about infertility is used as the sole instrument. The 2SLS estimates are nearly identical across these alternative definitions of infertility. The first-stage results reveal that an affirmative answer to either of the infertility questions is associated with significantly smaller family sizes.
We next attempt to improve upon our classification of infertility. In this specifi-cation the instrumental variable is assigned the values of zero, one, or two in cor-respondence to the number of survey questions in which a woman revealed herself to be infertile (Infert3⳱Infert1ⳭInfert2). The underlying assumption is that a
woman who in two separate instances stated that she is infertile is more likely to be truly infertile. After conditioning on age, the average woman who identified as infertile on both survey questions has 2.2 fewer children than her fertile counterpart. Column 4 contains the 2SLS results with theInfert3instrument. The estimated causal impact of children on mothers’ labor force participation is almost identical to the results shown in the base specification Column 1. Under the assumption that this coding of the instrument reduces the amount of measurement error in the definition of infertility, this analysis suggests that misclassification in the infertility variable does not bias the 2SLS estimates.
In Column 5, we exploit having two separate survey questions that identify in-fertility and use each as an instrument to run a HansenJ-test for overindentifying restrictions. Column 6 addsInfert4⳱Infert1*Infert2to the set of instruments for the
The
Journal
of
Human
Resources
Table 6
Robustness of the Results to Alternative Definitions of the Instrument
Method: Instrument
2SLS: max
{Infert1, Infert2} 2SLS:Infert1 2SLS:Infert2 2SLS:Infert3a
GMM:Infert1, Infert2
GMM:Infert1, Infert2, Infert4b
(1) (2) (3) (4) (5) (6)
Number of children ⳮ0.005 ⳮ0.004 ⳮ0.005 ⳮ0.004 ⳮ0.004 ⳮ0.004 [0.007] [0.008] [0.010] [0.007] [0.007] [0.007] Observations 90,965 90,965 90,965 90,965 90,965 90,965 First stage ⳮ1.212 ⳮ1.354 ⳮ1.162 ⳮ1.046
F-statistic 853.92 920.39 420.92 965.98 558.73 418.48
HansenJ(p-value) 0.893 0.950
Notes: * denotes significance at 10 percent, ** at 5 percent, and *** at 1 percent. All regressions include the control variables listed in Model 2. Robust standard error clustered at subnational levels in squared bracket. TheF-statistic refers to the first-stage result. TheGMMspecifications use each infertility measure separately. The Hansen-Jshows thep-value for the test for overidentifying restrictions.
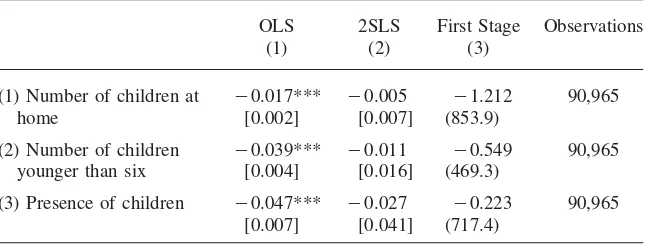
Table 7
Alternative Definitions of Children
OLS 2SLS First Stage Observations
(1) (2) (3)
(1) Number of children at home
ⳮ0.017*** ⳮ0.005 ⳮ1.212 90,965
[0.002] [0.007] (853.9)
(2) Number of children younger than six
ⳮ0.039*** ⳮ0.011 ⳮ0.549 90,965
[0.004] [0.016] (469.3)
(3) Presence of children ⳮ0.047*** ⳮ0.027 ⳮ0.223 90,965
[0.007] [0.041] (717.4)
Notes: Presence of children is a binary variable equal to one if family size is at least one and zero otherwise. Each cell in Columns 1–3 represents separate regressions. * denotes significance at 10 percent, ** at 5 percent, and *** at 1 percent. All regressions include the control variables listed in Model 2. Robust standard error clustered at subnational levels in squared bracket andF-statistics for the first stage are in parenthesis.
C. Alternative Definitions of Family Size
In Table 7 we consider alternative definitions of family size. The first row reproduces the main results from Table 3. In this case, family size is defined as the total number of children at home irrespective of their age. The second row uses the number of children younger than the age of six as the measure of family size. As the care of young children is more intensive, the presence of young children may have a larger impact on mothers’ labor force participation. Here, the OLS is larger than in the first case. An additional child younger than six is associated with a decline in labor force participation of four percentage points, as opposed to 1.7 points when consid-ering all children. Similarly, in absolute value, the 2SLS parameter is larger for children younger than six (ⳮ0.011) than for all children (ⳮ0.005). In both cases,
these estimates are not statistically different from zero and are substantially smaller than their OLS counterparts.
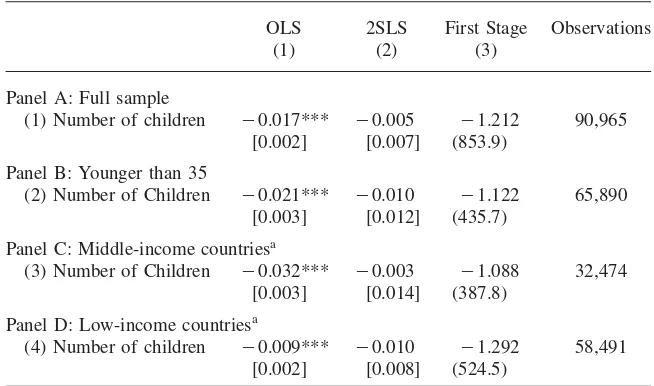
Table 8
Heterogeneous Effects
OLS 2SLS First Stage Observations
(1) (2) (3)
Panel A: Full sample
(1) Number of children ⳮ0.017*** ⳮ0.005 ⳮ1.212 90,965
[0.002] [0.007] (853.9)
Panel B: Younger than 35
(2) Number of Children ⳮ0.021*** ⳮ0.010 ⳮ1.122 65,890
[0.003] [0.012] (435.7)
Panel C: Middle-income countriesa
(3) Number of Children ⳮ0.032*** ⳮ0.003 ⳮ1.088 32,474
[0.003] [0.014] (387.8)
Panel D: Low-income countriesa
(4) Number of children ⳮ0.009*** ⳮ0.010 ⳮ1.292 58,491
[0.002] [0.008] (524.5)
Notes: Each cell in Columns 1–3 represents separate regressions. * denotes significance at 10 percent; ** at 5 percent, and *** at 1 percent. All regressions include the control variables listed in Model 2. Robust standard error clustered at subnational levels in squared bracket and F-statistics for the first stage are in parenthesis.
a. Countries are classified according to the World Bank’s World Development Indicators.
Row 3 of Table 7 shows the results where the main independent variable is an indicator variable that takes a one if a woman has any children, and is a zero if she is childless. Being a mother as opposed to being childless is associated with a 4.7 percentage point reduction in work behavior (Column 1, Row 3). Consistent with our previous results, the 2SLS estimates suggest that the observed association over-estimated the true relation in a way that is consistent with the existence of unob-served variables, such as autonomy or career ambition, affecting both the labor supply and the decision to become a mother. The 2SLS estimate suggests a lower effect (in absolute value) and it is not statistically different from zero.13Regardless of how we define family size, our results indicate that children do not have a causal effect on the likelihood that a woman enters the labor force.
D. Heterogeneous Impacts
In Table 8, we explore the robustness of our findings to particular subsamples of the data. Panel A reproduces the full-sample baseline results. We first investigate whether an effect could be observed for younger women for whom the age of
children will be significantly lower. In Panel B we restrict the sample to those aged 35 or younger, as in Angrist and Evans (1998). We find a negative correlation between family size and labor participation for younger women. In absolute terms, the effect is slightly larger for this subsample (2.1 percentage points) compared to the full sample (1.7). As before, the 2SLS parameter (Column 2) suggests an over-estimation of the OLS (ⳮ1 percentage point). However, consistent with our previous
findings, we cannot reject the null hypothesis of a zero effect for this subsample either.
Panels C and D of Table 8 present results from our preferred specification for the subsample of women at different levels of economic development as defined in Appendix Table A1. The switch in economic development from primarily agricul-tural societies to more industrialized societies generates a U-shaped relationship be-tween female labor force participation and per capita income (Goldin 1995 and Mammen and Paxson 2000). As countries enter intermediate levels of development, working women must leave their homes and enter a labor market with few pro-mother labor policies, where they may face social stigma. As such, we may expect the relationship between family size and mothers’ labor force participation to be different for women in nations at differing stages of development. In particular, if in agricultural societies there exist few opportunities to work outside of the home, while in more developed countries formal work reflects more of a choice, then we might expect the OLS estimates to be more upward biased in the more developed countries.
Panel C of Table 8 presents results for the subsample of women in middle-income countries. The OLS estimates suggest that each additional child reduced labor force participation by 3.2 percentage points (Column 1), while the 2SLS estimates are very small and not statistically different from zero. This suggests that the observed correlation between family size and labor force participation for women in mid-income countries is spurious and reflects the fact that certain types of women select into work.
Panel D of Table 8 shows the results for women in the lower-income countries. The OLS estimates are smaller in magnitude compared to the middle-income country estimates. However, for this subsample we cannot reject the hypothesis that the OLS and IV estimates are the same. For women in the least developed countries, work is mainly agricultural and there is little selection into the labor force. As we will show later, for this subsample of women, children appear to have a small but sig-nificant impact on paid labor force participation. We also have explored dividing the sample by the mother’s level of education (completed at least primary education). The results mirror our findings for the middle- and low-income countries (not shown for brevity). The OLS results suggest that children have a greater impact on the labor force behavior of more educated women. The 2SLS results show that children have no causal impact on the labor force behavior of more educated mothers. For less-educated women, additional children appear to have a small impact on work behavior.
E. Alternative Definitions of Work
Table 9
Alternative Definitions of Labor Force Participation
OLS 2SLS First Stage Observations
(1) (2) (3)
Panel A: Work Intensity
(1) Full sample ⳮ0.014*** 0.001 ⳮ1.211 90,943
[0.002] [0.007] (852.8)
Notes: Work Intensity is a binary variable equal to one if the women worked year around and zero otherwise. Paid Cash is a binary variable that equals one if the women worked for cash and zero otherwise. Each cell in Columns 1–3 represents a separate regression. * denotes significance at 10 percent; ** at 5 percent, and *** at 1 percent. Observations with missing outcome variables were dropped. All regressions include the control variables listed in Model 2. Robust standard error clustered at subnational levels in squared bracket and F-statistics for the first stage are in parenthesis.
working only if she works (either paid or not) for the full year. As before, children appear to have no casual impact on the likelihood that a woman works year round as the IV estimate is sometimes positive and very close to zero. This pattern is also observed for younger women and in both medium- and low-income countries.
and Marks (2008) in a paper limited to Latin American countries. However, when restricting the sample for younger women (Row 6) we observe a statistically sig-nificant effect in the 2SLS. An extra child diminishes paid employment by almost two percentage points. Second, for middle-income countries there is no causal effect. This is consistent with our previous discussion and with results for Latin American countries from Agu¨ero and Marks (2008). However, an additional child reduces the paid employment of women in low-income countries by 2.1 percentage points. In these countries, our estimates suggest that a woman with 2.4 children (the sample average) has a 5 percent lower probability of paid employment compared to her childless counterpart, all other things being equal. In less-developed countries there appear to be real challenges balancing motherhood with participation in the formal labor market.
V. Conclusions
Our paper investigates the relationship between children and labor force participation for a sample of women representing 26 countries in the devel-oping world. We employ a new identification strategy (infertility) in which “nature” prevents some women from obtaining their desired fertility levels. We present evi-dence that supports the use of infertility as an instrument for child bearing. First, infertility is highly correlated with family size. In our sample, infertile women have 1.2 fewer children then their fertile counterparts. Second, we show that our classi-fication of infertility is unrelated to a woman’s observed background traits. Third, we argue that measurement error in self-reported infertility does not bias our iden-tification strategy.
We find, for the subpopulation of women who are not actively controlling their fertility, that children have a much smaller causal effect on mothers’ overall labor force participation than the OLS estimates predict. These findings are robust to the inclusion of additional controls and alternative classifications of number of children. Additionally, these findings are robust to different definitions of labor force partic-ipation (worked last year, worked for pay, and worked year round). However, our results suggest that having children is indeed a barrier for participation in the paid labor force for younger women and mothers in poorer countries. Thus, motherhood affects the type of work a woman pursues by decreasing the likelihood of paid work. Our results for middle-income countries contrast Cruces and Galiani (2007) and Caceres-Delpiano (2008), who find that women in the developing world who are induced to have an additional child, out of a desire for a balanced sex mix of their children or because of twinning, are less likely to participate in the labor force. Our results could differ because we are identifying effects for a different subpopulation.14 A recent paper by Ebenstein (2009) argues that, in the presence of heterogeneous treatment effects, the LATE may differ from the average treatment effect when those
influenced by the instrument (the compliers) are not representative of the overall population. The women whose family size is altered by the sex composition of their children or a twin birth are women with low underlying desired fertility, whereas infertility removes children from women with high underlying desired fertility. Given that family planning programs tend to target women with high desired fertility, our estimates are arguably more relevant from a public policy vantage point.
While we find that, for younger women and those living in poorer countries, participation into paid labor is slightly reduced by having children, our main findings provide little evidence to support the belief that the global rise in female labor force participation can be directly attributed to declining family sizes. A common factor such as the empowerment of women could be driving both trends. Thus, our results suggest that policies focusing solely on family planning are unlikely to greatly in-crease female labor force participation.
References
Agu¨ero, Jorge M., and Mindy Marks. 2008. “Motherhood and Female Labor Force Participation: Evidence from Infertility Shocks.”American Economic ReviewPapers and Proceedings 98(2):500–504.
Angrist, Joshua, and Jo¨rn-Steffen Pischke. 2008.Mostly Harmless Econometrics: An Empiricist’s Companion. Princeton, N.J.: Princeton University Press.
Angrist, Joshua, and William Evans. 1998. “Children and Their Parents’ Labor Supply: Evidence from Exogenous Variation in Family Size.”American Economic Review88(3): 450–577.
Augood, C., K. Duckitt, and A. A. Templeton. 1998. “Smoking and Female Infertility: a Systematic Review and Meta-analysis.”Human Reproduction13(6):1532–39. Behrman, Jere R., and Anil B. Deolalikar. 1988. “Health and Nutrition.” InHandbook of
Development Economics, Volume 1, ed. Hollis Chenery and T. N. Srinivasan, 631–711. Amsterdam: Elsevier Science B.V.
Behrman, Jere R., Anil B. Deolalikar, and Barbara L. Wolfe. 1988. “Nutrients: Impacts and Determinants.”World Bank Economic Review2(3):299–320.
Bloom, David, David Canning, Gu¨nther Fink, and Jocelyn Finlay. 2009. “Fertility, Female Labor Force Participation, and the Demographic Dividend.”Journal of Economic Growth
14(2):79–101.
Boivin, Jacky, Laura Bunting, John A. Collins, and Karl G. Nygren. 2007. “International Estimates of Infertility Prevalence and Treatment-Seeking: Potential Need and Demand for Infertility Medical Care.”Human Reproduction22(6):1506–12.
Bronars, Stephen, and Jeff Grogger. 1994. “The Economic Consequences of Unwed Motherhood: Using Twin Births as a Natural Experiment.”American Economic Review
84(5):1141–56.
Buck, Germaine M., Lowell E. Sever, Ronald E. Batt, and Pauline Mendola. 1997. “Life-Style Factors and Female Infertility.”Epidemiology8(4):435–41.
Ca´ceres-Delpiano, Julio. 2008. “Keeping the best for last. Impact of Fertility on Mother’s Employment. Evidence from Developing Countries.”Economics Working Papers08-68 (32), Universidad Carlos III, Departamento de Economı´a.
Chandra, Anjani. 1994. “Infertility.” In From Data to Action. CDC’s Public Health Surveillance for Women, Infants, and Children, ed. L. S. Wilcox and J. Marks, 63–72. U.S. Department of Health and Human Services, Centers for Disease Control and Prevention.
Christensen, Kaare, Olga Basso, Kirsten O. Kyvik, Svend Juul, Jesper Boldsen, James W. Vaupel, and Jorn Olsen. 1998. “Fecundability of Female Twins.”Epidemiology9(2):189– 92.
Cristia, Julian P. 2008. “The Effect of a First Child on Female Labor Supply: Evidence from Women Seeking Fertility Services.”Journal of Human Resources43(3):487–510. Cruces, Guillermo, and Sebastian Galiani. 2007. “Fertility and Female Labor Supply in
Latin America: New Causal Evidence.”Labor Economics14(3):565–73.
de Kok, Bregje Christina. 2007. “Constructing Infertility in Malawi: Management of Interpersonal, Normative and Moral Issues in Talk.” Dissertation, University of Edinburgh.
Dunson, David B., Donna D. Baird, and Bernado Colombo. 2004. “Increased Infertility with Age in Men and Women.”Obstetrics and Gynecology103(1):51–56.
Ebenstein, Avraham. 2009. “When is the Local Average Treatment Close to the Average? Evidence from Fertility and Labor Supply.”Journal of Human Resources44(4):955–75. Field, Erica, and Attila Ambrus. 2008. “Early Marriage, Age of Menarche, and Female
Schooling Attainment in Bangladesh.”Journal of Political Economy116(5):881–930. Gesink Law, D.C., R.F. MacLehose, and M.P. Longnecker. 2007. “Obesity and Time to
Pregnancy.”Human Reproduction22(2):413–20.
Goldin, Claudia. 1995. “The U-Shaped Female Labor Force Function in Economic Development and Economic History.” InInvestment in Women’s Human Capital and Economic Development, ed. T. Paul Schultz, pg. 61–90 Chicago: University of Chicago Press.
Grodstein, Francine, Marlene B. Goldman, and Daniel W. Cramer. 1994. “Body Mass Index and Ovulatory Infertility.”Epidemiology5(2): 247–250.
Hassan, M., and S. R. Killick. 2005. “Is Previous Aberrant Reproductive Outcome Predictive of Subsequently Reduced Fecundity?”Human Reproduction20(3): 657–664. Hotz, V. Joseph, Susan Williams McElroy, and Seth G. Sanders. 2005. “Teenage
Childbearing and Its Life Cycle Consequences: Exploiting a Natural Experiment”Journal of Human Resources40(3):683–715.
International Labor Office. 2004.Global Employment Trends for Women March 2004.
Geneva: Internal Labor Organization.
Jacobsen, Joyce, James Pearce III, and Joshua Rosenbloom. 1999. “The Effects of Childbearing on Married Women’s Labor Supply and Earnings: Using Twin Births as a Natural Experiment”Journal of Human Resources34(3):449–74.
Joffe, Michael, and Isobel Barnes. 2000. “Do Parental Factors Affect Male and Female Fertility?”Epidemiology11(6):700–705.
Juul, Svend, Niels Keiding, and Mads Tvede. 2000. “Retrospectively Sampled Time-to-Pregnancy Data May Make Age-Decreasing Fecundity Look Increasing.”Epidemiology
11(6):717–19.
Ko¨gel, Tomas. 2004. “Did the Association Between Fertility and Female Employment within OECD Countries Really Change its Sign?”Journal of Population Economics
17(1):45–65.
Li, Xia. 2005. “Women’s Labor Market Outcomes and Childbearing.” New Haven: Yale University. Unpublished.
Mogstad, Magne, and Matthew Wiswall. 2009. “How Linear Models Can Mask Non-Linear Causal Relationships: An Application to Family Size and Children’s Education.” Statistics Norway, Research Department, Discussion Paper No. 586.
Negro-Vilar, Andre´s. 1993. “Stress and Other Environment Factors Affecting Fertility in Men and Women: Overview.”Environmental Health Perspectives101(Supplement 2: Impact of the Environment on Reproductive Health): 59–64.
Rosenzweig, Mark R., and Kenneth I. Wolpin. 1980. “Life-Cycle Labor Supply and Fertility: Causal Inference from Household Models.”Journal of Political Economy88(2): 328–348.
Schultz, Theodore P. 2008. “Population Policies, Fertility, Women’s Human Capital, and Child Quality.” InHandbook of Development Economics, Volume Four, ed. T. Paul Schultz and John A. Strauss, 3249–3303. Amsterdam: Elsevier Science B.V.
Tielemans, Erik, Alex Burdorf, Egbert te Velde, Rob Weber, Roelof van Kooij, and Dick Heederik. 2002. “Sources of Bias in Studies Among Infertility Clients.”American Journal of Epidemiology156(1):86–92.
United Nations, Department of Economic and Social Affairs, Population Division, 2007. World Population Prospects: The 2006 Revision, Highlights, Working Paper No. ESA/P/ WP.202.
Walraven, Gijs, Caroline Scherf, Beryl West, Gloria Ekpo, Katie Paine, Rosalind Coleman, Robin Bailey, and Linda Morison. 2001. “The Burden of Reproductive-Organ Disease in Rural Women in the Gambia, West Africa.”Lancet357(9263):1161–67.
Weinberg, Clarice, and David Dunson. 2000. “Some Issues in Assessing Human Fertility.” Journal of the American Statistical Association 95(449):300–303.
Wilcox, Lynne S., and William D. Mosher. 1993. “Use of Infertility Services in the United States.”Obstetrics & Gynecology82(1): 122–127.
Agu
¨ero
and
Marks
825
Table A1
Summary Statistics by Survey
Country Survey year
Infertile (1 or 2)
Number of children
Worked last 12 months
Above primary
school Observations
Mid-income countries
Bolivia 1994 0.08 2.71 0.68 0.35 3,039
Bolivia 1998 0.06 2.74 0.58 0.36 3,696
Brazil 1996 0.15 1.67 0.62 0.49 2,065
Columbia 1995 0.12 1.55 0.67 0.52 2,377
Dominican Republic 1996 0.12 1.60 0.50 0.36 2,029
Guatemala 1999 0.05 3.39 0.27 0.08 2,555
Kazakhstan 1995 0.09 1.68 0.78 0.99 1,036
Peru 1996 0.07 2.40 0.67 0.46 7,255
Philippines 1998 0.04 2.60 0.54 0.59 4,125
Uzbekistan 1996 0.08 1.97 0.62 1.00 1,184
South Africa 1998 0.06 1.64 0.38 0.53 3,113
The
Journal
of
Human
Resources
Table A1(continued)
Country Survey year
Infertile (1 or 2)
Number of children
Worked last 12 months
Above primary
school Observations
Low-income countries
Benin 1996 0.06 2.46 0.93 0.05 3,190
Central Africa Republic 1995 0.06 2.06 0.86 0.10 3,444
Chad 1997 0.05 2.77 0.62 0.04 4,742
Comoros 1996 0.03 2.92 0.46 0.13 1,231
Ghana 1999 0.06 2.01 0.86 0.40 2,720
Guinea 1999 0.04 2.45 0.85 0.06 4,320
Kenya 1998 0.05 2.58 0.59 0.23 3,301
Kyrgyz Republic 1997 0.15 1.93 0.55 1.00 1,071
Madagascar 1997 0.04 2.39 0.83 0.22 3,737
Mali 1996 0.02 2.69 0.56 0.04 6,338
Mozambique 1997 0.05 2.17 0.66 0.03 5,427
Nicaragua 1998 0.05 2.67 0.43 0.30 3,673
Niger 1998 0.03 2.54 0.61 0.05 4,648
Nigeria 1999 0.04 2.53 0.53 0.25 4,384
Zambia 1997 0.10 2.28 0.56 0.22 4,135
Zimbabwe 1994 0.09 2.11 0.53 0.30 2,130