September 2010
Consumers confidence remains at the highly favourable level in
September 2010. All components of Consumers Confidence Index
(CCI) measuring namely income, durable goods consumption, and
job availability index in current and 6 months ahead posted
increases. However, CCI eased against the same period in
previous year.
On the other hand, consumers considered that inflation pressure
in the next 3 and 6 months will decelerate as indicated on the price
expectation index that dropped by 7.8 and 4.6 points. Price
declined most on clothing and foodstuff.
Consumer Confidence Index
Consumer confidence remains at the highly favourable level in
September 2010.
After moving down over the past two months, Consumer
Confidence Index (CCI) escalated 3.6 points to the level of 107.6. The
ascending CCI was attributed by consumer’s wide perception on current
economic condition and the expectation for the next 6 months as the index
grew by 3.8 and 3.3 points respectively.
Graph 1. Consumer Confidence Index
60.0
70.0
80.0
90.0
100.0
110.0
120.0
130.0
140.0
1 2 3 4 5 6 7 8 9 10 11 12 1 2 3 4 5 6 7 8 9 10 11 12 1 2 3 4 5 6 7 8 9
2008
2009
2010
(Index)
Current Economic Condition Index
Consumer Expectation Index
Consumer Confidence Index
Optimistic
Pessimistic
Fuels Hike
Global Economic
Crisis
CONSUMER SURVEY
Consumer Confidence Index
boosted up
Methodology
Consumer Survey-Bank Indonesia (CS-BI) is a monthly survey that has been conducted since October 1999. Since January
2007, the survey is done to more or less 4,600 households as respondents
(stratified
random sampling)
in 18 cities: Jakarta, Bandung,
Semarang, Surabaya, Medan, Makassar, Bandar Lampung, Palembang, Banjarmasin, Padang, Pontianak, Samarinda, Manado,
Denpasar, Mataram, Pangkal Pinang, Ambon, and Banten. By significance level of 99%, the sample has sampling error of 2%. Data
canvassing run through interviews by phone and direct visits in particular cities that based on rotated system. Balance Score Method
(
net balance
+ 100) has been adopted to construct the index, where the index is above 100 points indicate an optimism (positive
Higher consumers’ income due to religious holiday’s allowances has
apparently boosted the consumption for durable goods in September 2010
and finally lifted the consumer’s optimism on current economic condition
against previous month. Strengthening expectations on income and saving in
the next 6 months were triggered consumer’s optimism on economic
condition in the next 6 months.
Although increased in monthly basis, consumer confidence level
reduced in annual basis.
CCI in this reporting month dropped 3.2 points
against the same period in previous year. The downward was attributable to
the worsen consumers expectation on future economic condition and
respondent’s perception on tight job availability.
Current Economic Condition Index
Respondents were more optimistic over current economic
condition than previous month.
Higher respondents’ optimism was
revealed on Current Economic Condition Index (CECI) which climbs 3.8 points
to the level of 97.1 over previous month.
Graph 2. Current Economic Condition Index (CECI
0.0 20.0 40.0 60.0 80.0 100.0 120.0 140.0
1 2 3 4 5 6 7 8 9 10 11 12 1 2 3 4 5 6 7 8 9 10 11 12 1 2 3 4 5 6 7 8 9
2008 2009 2010
Index
Current Economic Conditions Index Current Incomes Buying Durable Goods Conditions Job Availability
Consumer confirmed that all current economic indicators posted
escalation. Consumers got higher income due to religious holiday’s
allowances which has also stimulated consumer intention to consume durable
goods. On the other hand, consumers also considered that job availability was
spread out over previous month.
Compared to the same period in the previous year, consumers stated
that economic condition was relatively stable. Although appropriate time to
consume durable goods index scaled up against previous year, however,
Consumer’s perception on
current economic condition is
Consumer Expectation Index
Consumers were more optimistic about future economic
conditions.
Stronger consumers’ optimism was emphasized on Consumer
Expectation Index (CEI) which gained 3.3 points to 18.1 over previous month.
Enhancing CEI was encouraged by strengthening consumer’s optimism on
economic condition in the next 6 months by 6.1 points, income expectation
by 2.8 points, and job availability expectation by 1.0 points.
Graph. 3
Consumer Expectation Index (CEI)
0.0 20.0 40.0 60.0 80.0 100.0 120.0 140.0 160.0
1 2 3 4 5 6 7 8 9 10 11 12 1 2 3 4 5 6 7 8 9 10 11 12 1 2 3 4 5 6 7 8 9
2008 2009 2010
Index
Consumer Expectation Index Incomes Expectation Economic Expectation Job Availability Expectation
Economic expectation index, income and job availability expectation
index in September 2010 mounted up over previous month, although still
lower than the same period in previous year. Lowering optimism was
significantly encountered on economic condition expectation (14.3 points),
followed by decreasing on job availability expectation and income expectation
by 4.7 and 2.1 points respectively.
Income Expectations
Consumers also more optimistic over their income in the next 6
months.
The optimism was seen on income expectation index which
increased 2.8 points to 136.4. The survey also noted that respondents with
expenditure Rp 1-3 million per month showed the stronger optimism towards
income in the next 6 months.
Respondent’s also more
optimistic over economic
condition in the next 6
months
Price Expectations
Respondents believed that pressure on prices will soften in the
next 3 and 6 months.
The survey reported that price expectation index in the
next 3 and 6 months dropped each by 7.8 and 4.6 points. According to
respondents, diminishing pressure on prices in the next 3 and 6 months will
primarily occurred on clothing and foodstuff group. On clothing, the index
moved down by 10.4 and 5.8 points for the next 3 and 6 months prices, while
on foodstuff, the index fell by 8.5 and 4.8 points respectively.
Graph 4.
Price Expectation Index for the next 3 and 6 months
‐1.00 0.00 1.00 2.00 3.00 4.00 5.00 6.00
130.0 140.0 150.0 160.0 170.0 180.0 190.0 200.0
1 2 3 4 5 6 7 8 9 101112 1 2 3 4 5 6 7 8 9 101112 1 2 3 4 5 6 7 8 9 101112 1 2 3
2008 2009 2010 2010
Price Expectation Index 3 months ahead Price Expectation Index 6 months ahead Cummulative Inflations in 3 months
Index
Notes
: Index = 100 indicates that consumer expect prices will still be stable, index > 100 indicates
consumer expect prices will increase, and index < 100 indicates consumer expect prices will decrease
Downturn trend on prices were envisaged to keep on until 3 months
ahead. Seasonal factor related harvesting time which started in several
following months were attributable as the role factor in lowering price,
substantially on foodstuff.
Expectations of Savings and Interest Rates
Although saving interest rate in the next 6 months was
predicted to decelerate, consumers show a higher optimistic on saving
amount in the next 6 months.
The survey revealed that saving interest rate
expectation in the next 6 months will go down by 0.5 point to the level of
119.3. However, although interest rate expectation were predicted to
decrease, respondents remain optimistic that their saving will arise as they are
confidence on their higher income in the next 6 months. The index mounted
by 3.0 points over previous month.
Pressure on prices in the
next 3 and 6 months
moved down
The upwarding on income expectation and diminishing pressure on
prices in the next 3 and 6 months were regarded to stimulate consumers’
intention to consume which promoted consumer’s optimism on future
economic condition.
Graph. 5
Expectation Indexes on Interest Rates and Total Savings in the next 6 months
0
5
10
15
20
25
90
100
110
120
130
140
1 2 3 4 5 6 7 8 9 101112 1 2 3 4 5 6 7 8 9 101112 1 2 3 4 5 6 7 8 9 101112 1 2 3
2008
2009
2010
2011
Savings
Growth
in
6
months
Interest
Rates
Expectation
Index
in
6
months
ahead
Savings
Expectation
Index
in
6
months
ahead
Index
(%)
Notes
: Index = 100 indicates that consumer expect saving deposit and interest rate will still be
stable, index > 100 indicates consumer expect saving deposit and interest rate will increase, and
index < 100 indicates consumer expect saving deposit and interest rate will decrease
Expectations on Economic Conditions
Respondents were getting sanguine on economic condition in the
next 6 months.
The optimism was revealed on rising index by 6.1 points to
the level of 116.1. Higher optimism was mainly shown by respondent who has
diploma educational background.
Table 1. Consumer Confidence, Price Expectations, Consumption Plans, and Economic Indicators (Index)
Sep Oct Nov Dec Jan Feb Mar Apr May Jun Jul Aug Sep
A Consumer Confidence Index (CCI) 110.84 110.01 111.00 108.66 110.5 105.3 107.4 110.7 109.9 111.4 105.7 104.0 107.6
Present Situation (CECI) 96.59 96.78 97.71 96.67 98.4 94.7 96.4 99.6 100.0 101.4 96.1 93.3 97.1
Expectations (CEI) 125.09 123.24 124.28 120.65 122.6 115.9 118.5 121.7 119.8 121.3 115.3 114.8 118.1
Appraisal of Present Situation -2.8 3.8
Current Incomes 123.97 124.93 124.11 123.13 125.5 118.6 121.7 126.1 124.4 126.2 120.6 117.7 121.6 Buying durable goods Conditions 81.28 82.21 84.90 81.12 85.2 87.3 85.3 87.5 89.6 91.4 86.8 80.5 85.8 Employment Conditions 84.53 83.20 84.13 85.76 84.5 78.0 82.1 85.3 85.9 86.7 80.9 81.7 83.8 (before Oct 2004: Unemployment Condition)
Expectations for 6 Months Hence of -0.5 3.3
Incomes 138.48 137.32 139.28 136.75 141.1 132.5 135.3 136.7 134.7 137.4 132.6 133.6 136.4 Economic Conditions 130.35 127.28 128.77 122.11 122.7 114.4 117.7 122.2 119.5 122.3 112.6 110.0 116.1 Employment Conditions 106.42 105.11 104.81 103.10 103.9 100.8 102.4 106.3 105.2 104.2 100.7 100.7 101.7 (before Oct 2004: Unemployment Expectation)
B Price Expectations for 3 Months Hence of
Prices 165.21 158.76 159.89 161.00 160.60 160.20 155.10 158.60 164.30 166.8 180.5 175.4 167.6
Foodstuff 167.00 160.80 160.64 162.97 163.50 163.40 156.00 159.60 164.20 167.8 181.2 177.2 168.7 Food, beverages, cigarettes and tobacco 161.00 154.94 155.77 157.15 156.40 155.00 149.90 153.50 156.50 160.1 170.4 170.2 161.7 Housing, electricity, gas and fuel 155.20 155.96 156.58 156.32 152.00 151.50 148.10 155.30 158.10 161.2 175.1 167.8 160.7 Clothing 150.16 138.56 139.34 137.95 135.50 136.40 131.20 133.70 142.10 148.8 155.9 156.3 145.9 Health 140.64 135.38 136.63 137.91 135.90 136.10 133.90 133.60 138.80 141.0 146.6 146.0 140.2 Transportations, communications and financial services 146.85 142.60 142.25 141.35 137.50 137.90 134.30 136.40 142.00 149.6 157.4 155.6 150.5 Education, recreation, and sports 141.34 137.28 138.96 140.05 138.00 137.20 138.20 141.40 145.90 149.4 154.9 151.0 143.0 C Price Expectations for 6 Months Hence of
Prices 156.95 156.24 157.92 158.80 161.20 164.30 161.10 159.30 162.50 163.1 170.1 161.5 156.9
Foodstuff 158.23 158.42 158.39 160.51 162.10 166.00 161.70 160.50 163.00 164.1 171.0 162.5 157.7 Food, beverages, cigarettes and tobacco 153.36 154.25 154.44 154.89 156.90 158.90 156.70 154.50 158.00 157.9 163.5 157.9 153.1 Housing, electricity, gas and fuel 150.84 154.32 155.72 155.40 153.20 153.10 148.60 154.10 157.30 157.3 165.8 156.0 153.1 Clothing 141.71 137.41 140.52 139.90 140.10 144.40 143.10 140.30 145.20 147.1 148.4 145.2 139.4 Health 140.19 136.73 138.06 138.87 140.00 140.80 136.70 137.20 139.10 141.2 146.5 139.2 138.9 Transportations, communications and financial services 143.37 143.86 142.59 143.90 142.80 145.50 143.60 144.90 147.30 148.3 153.0 147.9 143.7 Education, recreation, and sports 140.98 138.61 143.10 144.73 146.20 147.70 145.30 144.20 146.10 146.1 150.8 144.2 141.9 D Economic Indicator within 6 Months
Avaibility of Goods & Services 138.59 136.40 132.70 133.48 138.30 134.20 135.50 137.60 138.70 141.5 140.0 136.4 135.2 Interest Rate 115.20 113.34 115.44 116.31 117.90 114.90 117.00 116.20 117.10 117.8 117.9 119.8 119.3 Current savings 104.44 104.70 106.58 105.94 106.40 105.20 106.90 105.00 105.80 106.5 103.7 103.0 106.1 Savings for 6 months hence 124.99 125.93 128.21 126.75 129.80 125.60 126.20 127.00 125.00 127.3 124.3 123.0 126.0
Descriptions 2009 2010
Table 2. Respondent Figures (percentages)
Sep Oct Nov Des Jan Feb Mar Apr May Jun Jul Aug Sep
Gender
Male 59.83 57.55 57.82 58.31 59.80 58.60 59.00 58.80 57.70 57.40 58.90 58.3 60.1 Female 40.17 42.45 42.18 41.69 40.20 41.40 41.00 41.20 42.30 42.60 41.10 41.7 39.9
Household Expenses
Rp. 1 million - Rp. 3 million 59.49 60.94 60.21 59.35 58.70 61.20 58.10 59.80 59.70 60.90 58.90 60.6 58.9 Rp. 3 million - Rp. 5 million 30.10 28.35 28.39 29.66 30.90 28.70 30.80 30.30 29.60 28.80 31.10 29.3 30.5 Rp. 5 million and over 10.42 10.71 11.41 10.99 10.40 10.00 11.20 9.90 10.70 10.30 10.00 10.1 10.5
Ages
20-40 years 58.48 61.12 63.93 62.16 57.60 59.50 59.10 60.30 61.10 60.50 59.30 61.2 58.7 41-60 years 38.34 35.89 33.00 34.23 38.40 36.60 36.50 35.60 34.90 35.90 37.10 34.6 37.9 60 years above 3.18 2.99 3.08 3.61 3.90 3.90 4.40 4.10 4.00 3.50 3.50 4.3 3.4
Educational Level
High School 48.39 47.69 47.65 47.59 45.90 46.10 46.10 50.30 49.40 51.70 50.70 50.2 50.6 Diploma 13.08 13.42 12.90 13.21 13.40 13.90 13.50 12.50 13.10 12.10 13.80 13.6 13.0 University 34.00 34.35 35.24 34.59 35.40 35.00 35.20 33.10 33.20 32.20 30.80 32.1 32.4 Graduate/Post Graduate 4.53 4.53 4.21 4.60 5.30 5.00 5.20 4.10 4.40 4.00 4.70 4.1 4.0
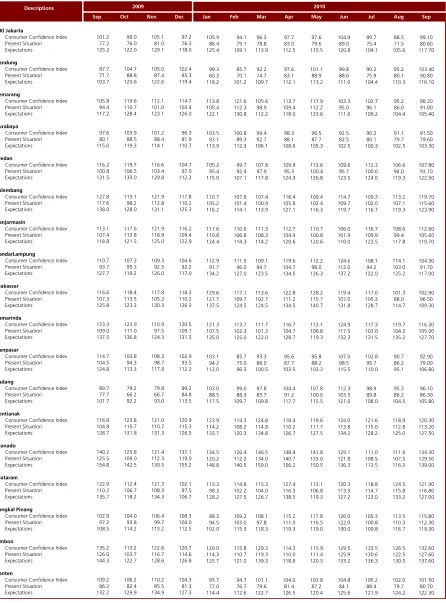
Table 3. Consumer Confidence by Region (Index)
Sep Oct Nov Dec Jan Feb Mar Apr May Jun Jul Aug Sep
DKI Jakarta
Consumer Confidence Index 101.2 99.0 105.1 97.2 105.9 94.1 96.3 97.7 97.6 104.9 89.7 88.5 99.10 Present Situation 77.2 76.0 81.0 76.3 86.4 79.1 78.8 83.0 79.6 89.0 75.4 71.5 80.60 Expectations 125.2 122.0 129.1 118.0 125.4 109.1 113.9 112.5 115.5 120.8 104.1 105.6 117.70
Bandung
Consumer Confidence Index 87.7 104.7 105.0 102.4 99.3 85.7 92.2 97.6 101.1 99.8 90.2 95.2 103.40 Present Situation 71.7 88.8 87.4 85.3 80.3 70.1 74.7 83.1 88.9 88.6 75.9 80.1 90.80 Expectations 103.7 120.6 122.6 119.4 118.2 101.2 109.7 112.1 113.2 111.0 104.4 110.3 116.10
Semarang
Consumer Confidence Index 105.8 119.6 112.1 114.7 113.8 121.6 105.6 113.7 117.9 103.3 102.7 95.2 98.20 Present Situation 94.4 110.7 101.0 103.4 105.4 112.3 98.9 109.4 112.2 95.0 96.1 86.0 91.00 Expectations 117.2 128.4 123.1 126.0 122.1 130.8 112.2 118.0 123.6 111.6 109.2 104.4 105.40
Surabaya
Consumer Confidence Index 97.6 103.9 101.2 96.3 103.5 100.8 99.4 98.3 96.5 92.5 90.2 91.1 91.50 Present Situation 80.1 88.5 88.4 81.9 93.1 89.3 92.7 88.1 87.7 82.5 80.1 79.7 79.60 Expectations 115.0 119.3 114.1 110.7 113.9 112.3 106.1 108.6 105.3 102.5 100.3 102.5 103.30
Medan
Consumer Confidence Index 116.2 119.7 116.6 104.7 105.2 99.7 107.8 109.8 113.6 109.6 112.3 106.6 107.80 Present Situation 100.8 106.5 103.4 97.0 95.4 92.4 97.9 95.3 100.4 95.7 100.6 94.0 93.10 Expectations 131.5 133.0 129.8 112.3 115.0 107.1 117.8 124.3 126.8 123.5 124.0 119.3 122.50
Palembang
Consumer Confidence Index 127.8 113.1 121.9 117.8 110.7 107.8 107.4 116.4 109.4 114.7 109.3 113.2 119.70 Present Situation 117.6 98.2 112.8 110.2 105.2 101.4 100.9 105.8 102.4 109.7 102.0 107.1 115.60 Expectations 138.0 128.0 131.1 125.3 116.2 114.1 113.9 127.1 116.3 119.7 116.7 119.3 123.90
Banjarmasin
Consumer Confidence Index 113.1 117.6 121.9 116.2 117.6 110.6 111.3 112.7 110.7 106.0 116.7 108.6 112.60 Present Situation 107.4 113.8 118.9 109.4 110.8 106.8 108.3 104.9 100.8 101.9 109.9 99.4 105.60 Expectations 118.8 121.5 125.0 122.9 124.4 114.3 114.2 120.6 120.6 110.0 123.5 117.8 119.70
BandarLampung
Consumer Confidence Index 110.7 107.3 109.3 104.6 112.9 111.5 109.1 119.6 112.2 124.6 108.1 114.1 104.30 Present Situation 93.7 95.3 92.5 92.2 91.7 96.0 94.7 104.7 98.0 112.0 94.2 103.0 91.70 Expectations 127.7 119.2 126.0 117.0 134.2 127.0 123.5 134.5 126.3 137.2 122.0 125.2 117.00
Makassar
Consumer Confidence Index 116.6 118.4 117.8 118.3 129.6 117.1 113.6 122.8 128.2 119.4 117.0 101.3 102.90 Present Situation 107.3 113.5 105.2 110.2 121.7 109.7 102.7 111.2 115.7 107.0 105.3 88.0 96.50 Expectations 125.8 123.3 130.3 126.3 137.5 124.5 124.5 134.5 140.7 131.8 128.7 114.7 109.30
Samarinda
Consumer Confidence Index 123.3 123.9 110.9 120.5 121.3 113.7 111.7 116.7 113.1 124.9 117.3 119.7 116.30 Present Situation 109.0 111.0 97.5 109.7 107.5 102.3 101.3 104.7 106.8 117.5 103.0 104.2 105.00 Expectations 137.5 136.8 124.3 131.3 135.0 125.0 122.0 128.7 119.3 132.3 131.5 135.2 127.70
Denpasar
Consumer Confidence Index 114.7 103.8 108.3 102.9 103.1 85.7 93.3 95.6 95.8 107.0 102.8 90.7 92.90 Present Situation 104.5 94.3 98.7 93.5 94.2 75.0 86.0 87.7 88.2 98.5 95.7 86.2 79.00 Expectations 124.8 113.3 117.8 112.3 112.0 96.3 100.5 103.5 103.3 115.5 110.0 95.1 106.80
Padang
Consumer Confidence Index 89.7 79.2 79.8 99.2 103.0 99.0 97.8 104.4 107.8 112.3 98.9 95.3 96.10 Present Situation 77.7 66.2 66.7 84.8 88.5 88.3 85.7 91.2 100.0 103.5 89.8 86.2 86.30 Expectations 101.7 92.2 93.0 113.5 117.5 109.7 109.8 117.7 115.5 121.0 108.0 104.5 105.80
Pontianak
Consumer Confidence Index 116.8 123.8 121.0 120.9 123.9 114.3 124.8 118.4 119.6 124.0 121.6 118.9 120.30 Present Situation 104.8 115.7 110.7 115.3 114.2 108.2 114.8 110.2 111.7 113.8 115.0 112.8 113.20 Expectations 128.7 131.8 131.3 126.5 133.7 120.3 134.8 126.7 127.5 134.2 128.2 125.0 127.50
Manado
Consumer Confidence Index 140.2 125.8 121.4 137.1 134.5 126.4 146.5 148.4 141.8 129.1 111.0 111.9 134.30 Present Situation 125.5 109.0 112.3 119.0 120.2 112.3 134.0 140.7 133.0 121.8 108.5 107.5 129.50 Expectations 154.8 142.5 130.5 155.2 148.8 140.5 159.0 156.2 150.5 136.3 113.5 116.3 139.00
Mataram
Consumer Confidence Index 122.9 112.4 121.3 102.1 113.3 114.8 115.3 127.4 113.1 120.3 118.8 124.5 121.90 Present Situation 110.2 106.7 108.3 97.5 98.3 102.2 104.0 116.3 106.8 113.3 114.7 115.8 116.80 Expectations 135.7 118.2 134.3 106.7 128.2 127.5 126.7 138.5 119.3 127.2 123.0 133.2 127.00
Pangkal Pinang
Consumer Confidence Index 102.8 104.0 106.4 108.3 98.3 109.2 108.1 115.2 117.8 126.0 105.3 113.5 115.80 Present Situation 97.2 93.8 99.7 104.0 94.5 103.0 97.8 111.0 116.5 122.0 100.8 110.3 112.30 Expectations 108.5 114.2 113.2 112.5 102.0 115.3 118.3 119.3 119.0 130.0 109.8 116.7 119.30
Ambon
Consumer Confidence Index 135.2 113.2 122.6 120.7 120.0 115.8 129.3 114.3 115.9 129.5 133.5 126.5 132.60 Present Situation 126.0 103.7 116.7 114.6 114.3 110.7 119.3 110.0 111.4 125.9 130.6 122.5 127.60 Expectations 144.3 122.7 128.6 126.8 125.7 121.0 139.3 118.6 120.3 133.2 136.3 130.5 137.60
Banten
Consumer Confidence Index 109.2 106.2 110.2 104.3 95.7 94.7 101.1 104.0 103.8 104.8 105.2 102.0 101.50 Present Situation 86.2 82.4 85.5 81.3 77.0 76.7 79.6 81.4 87.2 84.1 88.4 79.7 80.70 Expectations 132.2 129.9 134.9 127.3 114.4 112.6 122.7 126.5 120.4 125.6 121.9 124.2 122.30