Monetary Policy Review
May 2010
The Monetary Policy Review (MPR) is published monthly by Bank Indonesia after the Board of Governors’ Meeting each February, March, May, June, August, September, November, and December. This report is intended as a medium for the Board of Governors of Bank Indonesia to present to the public the latest evaluation of monetary conditions, assessment and forecast for the Indonesian economy, in addition to the Bank Indonesia monetary policy response published quarterly in the Monetary Policy Report in January, April, July, and October. Specifically, the MPR presents an evaluation of the latest developments in inflation, the exchange rate, and monetary conditions during the reporting month and decisions concerning the monetary policy response adopted by Bank Indonesia.
Board of Governors
Darmin Nasution Deputi Gubernur Senior
Hartadi A. Sarwono Deputi Gubernur
Siti Ch. Fadjrijah Deputi Gubernur
S. Budi Rochadi Deputi Gubernur
Muliaman D. Hadad Deputi Gubernur
Ardhayadi Mitroatmodjo Deputi Gubernur
Daftar Isi
I. Monetary Policy Statement ...3
II. The Economy and Monetary Policy ...6
Developments in the World Economy ...6
Economy Growth in Indonesia ...9
Inflation ...11
Rupiah Exchange Rate ...13
Monetary Policy ...14
Interest Rates ...14
Funds, Credit, and the Money Supply ...17
The Stock Market ...18
Government Securities Market ...19
Mutual Funds Market ...20
Condition of the Banking System ...20
I. MONETARY POLICY STATEMENT
The global economic recovery is moving ahead with increasing momentum. The economies of the US, Japan and other Asian nations are showing steady improvement. The global economic recovery process is outperforming earlier forecasts. In Q1/2010, China reported 11.3% annual growth, the highest level achieved in the past 3 years. Supporting this is the latest assessment by the IMF (WEO April), which projects world economic growth in 2010 at a more robust 4.2% compared to the originally predicted 3.9%. The improved optimism for economic growth and more buoyant activity in the world economy has boosted the volume of world trade. In this regard, global commodity prices are on an upward trend, a factor that is now spurring global inflation albeit on a low scale. Even so, the global economic recovery is still daunted by risks from the debt crisis in Greece, Portugal and Spain that could trigger negative sentiment on world financial markets.
Concerning prices, inflationary pressure remains low and under control. Prices in April 2010 were influenced by non-fundamentals in the volatile foods category. However, inflationary pressure stayed remarkably low in core items and the administered prices category. Taken together, April inflation was recorded at 0.15% (mtm) or 3.91% (yoy), up from the 0.14% deflation (mtm) in March 2010. Inflation in the volatile foods category was fuelled largely by increased prices for some seasonings, such as red chilli peppers, tomatoes, shallots and garlic, as well as several vegetable varieties. These price surges are predicted to be temporary, being caused by disruptions in supply and distribution brought on by adverse weather conditions in some farming production centres. Inflationary pressure from administered prices was again low due to the absence of strategic government decisions related to prices. No significant pressure was recorded in core inflation, due to the appreciating trend in the rupiah. Added to this, inflationary pressure from externals was also minimal, due to movements in global commodity prices that despite some increases remained within modest limits. Inflationary pressure from supply-demand interaction is expected to stay low, given the adequate support of supply-side response to rising demand. In regard to expectations, inflation expectations remained subdued and in decline. The low inflation of the past several months and appreciating trend in the rupiah have maintained a healthy level of inflation expectations.
the domestic economy will also lead to increased equity and reinvested earnings, particularly in the non-oil and gas sector. In response to these developments, international reserves on 30 April 2010 stood at 78.6 billion US dollars, equivalent to 6.2 months of imports and servicing of official external debt.
The solid performance in the balance of payments has contributed to the strengthening of the rupiah. The rupiah has maintained an upward trend in response to the rising wave of capital inflows into Asia. The high returns on Asian investments offer particular incentive for foreign investors to channel their funds to Asian financial markets, including Indonesia. On the domestic front, investor perceptions were reassured by the secure condition of economic fundamentals, Favourable investor perceptions were reflected in stable indicators for investment risk in Indonesia, which have sustained keen foreign investor interest in Indonesia. During April, the rupiah recorded 1.5% average appreciation to Rp 9,027 to the US dollar before closing the month at Rp 9,012 to the US dollar, up 0.87% from the previous month’s close. Accompanying the strengthening trend in the rupiah was subdued volatility. Volatility in the rupiah fell to 0.23% in April 2010 from 0.45% one month earlier.
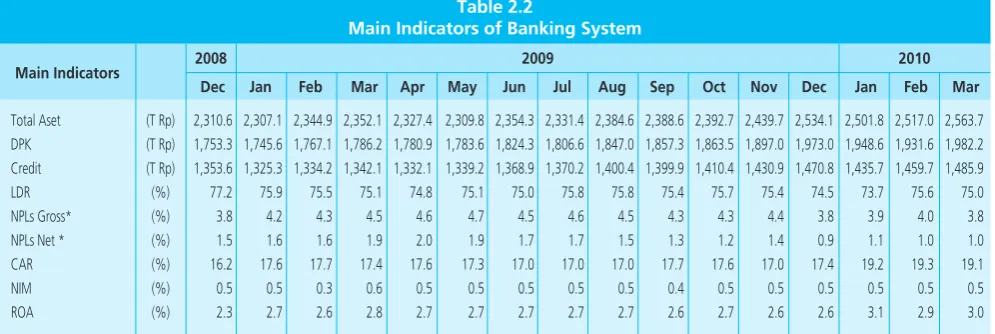
At the micro level, conditions in the national banking system remain stable. Reflecting this is the still comfortable level of the capital adequacy ratio (CAR) at 19.1% in March 2010. Similarly, the gross non-performing loans (NPLs) ratio held below 3.8% with the net NPLs ratio at 1%. In March 2010, depositor funds registered 11.9% growth (yoy), up from growth in the preceding month at 9.3% (yoy).
On 5 May 2010, the Board of Governors’ Meeting at Bank Indonesia resolved to hold the BI Rate at 6.5% with an interest rate corridor as stated earlier. In the assessment of the Bank Indonesia Board of Governors, the 6.50% level in the BI Rate remains consistent with the 5%+1% inflation target for 2010 and is also conducive to the economic recovery process and operation of banking intermediation.
II. THE ECONOMY AND MONETARY POLICY
The world economic recovery process is moving ahead in most areas, although overshadowed by the fiscal crisis in Europe. The downgrading of the sovereign credit ratings for Greece and Portugal triggered waves of negative sentiment on global financial markets with impact on financial markets in Asia. The strengthening recovery in advanced economies (US, Canada and Japan) and in Asia (China and India) has provided a positive boost to the Indonesian economy, visible in steady gains. Concerning prices, inflation stayed low and well under control during the month under review. Inflation in April 2010 resulted mainly from non-fundamental factors. The exchange rate also appreciated further over the preceding month. In the banking sector, various indicators like before point to the solid condition of the banking system.Developments in the World Economy
The recovery in the world economy is now gathering momentum.
through the trade channel. In contrast, the Eurozone growth lagged behind due to the effects of the fiscal crisis in several European Union member nations.
An upbeat tone has returned to the US economy, as indicated by strengthening performance in US consumption and production
despite a lending crunch and high unemployment. US household
consumption mounted further in response to the easing of CPI inflation, while US non-farm payrolls for March 2010 surprised observers with positive growth. Rising employment coupled with low inventory levels has ultimately spurred renewed growth in production, reflected in a markedly increased growth in US capacity utilisation and production indices (Graph 2.1). Analysed by consumption, the positive trend in retail sales offers confirmation of improvement in household purchasing power. Even so, future recovery in household consumption remains daunted by tight access to credit brought on by the ongoing deleveraging process in the banking system and strict lending standards.
The improvement in the Japanese economy came in response to
mounting exports alongside strengthening domestic demand.
Japan’s exports are steadily improving in response to the faster than predicted recovery in Asia’s economies and growing volume of world trade (Graph 2.2). Rising exports driven by more vigorous external performance also provided a boost to industry. As a result, the rate of worker dismissals began to ease and Japanese unemployment has resumed gradual decline. Japan’s retail sales indicator is up in response to the spillover effects of improvement in the Japanese economy, reflected in renewed growth on the stock market, conducive labour market conditions and Japanese corporate earnings.
In similar developments, European production and household confidence indicators improved further amid high levels of unemployment. In regard to fundamentals, European economies have charted steady supply and demand-side improvement. Reflecting this is the relative improvement in household consumption and retail sales indicators. Besides this, a consumer confidence survey also points to hopeful signs for continued recovery in the Eurozone economies. In the industrial world, the Purchasing Manager Index (PMI) survey indicates that manufacturing and services have entered an expansionary phase as exports have resumed positive growth. Despite this, the fiscal crisis in the PIGS nations (Portugal, Graph 2.1 US Production Index
and Capacity Utilization
Italy, Spain and Greece) has potential to slow the pace of the ongoing recovery.
Global financial market performance hit a turbulent period on negative sentiment over Goldman Sachs and the downgrading of ratings for Greece and Portugal. Global stock markets took a beating from the Goldman Sachs scandal and the announcement of lower sovereign ratings for Greece and Portugal after budget deficits and external debt exceeded forecasted levels. Loss of investor risk appetite triggered an offloading of higher-risk assets, including stocks, and renewed flight to safe haven assets reflected in appreciation in the US dollar and Japanese yen. However, these market jitters were confined to the financial markets of Europe. Risk premia for emerging markets have maintained a generally improving trend and investors continue to hunt emerging market assets offering high returns.
The upward trend in commodity prices is expected to begin stoking inflationary pressure on a global scale, albeit at a low level. In some emerging markets, inflationary pressure is now on the rise, despite remaining muted in advanced economies. The overall 2010 inflation forecast for developed nations eased slightly in April to 1.53% (yoy), while inflation in developing economies was revised upwards to 5.29% (yoy). The brisk pace of economic improvement in developing nations have generated stronger inflationary pressure compared to advanced nations, where economic recovery is moving at a slower pace.
In Asia, some nations have begun normalising their policies to bring down inflationary pressure. After tightening policy through an increase in the reserve requirement, the Indian central bank raised its repo and reverse repo rates by 25 bps to 5.25% and 3.75%. To curb inflationary pressure from external developments, Singapore’s central bank (MAS) adjusted the value of its dollar currency. Similarly, the People’s Bank of China (PBoC) has allowed the yuan to appreciate gradually against the US dollar. In contrast, central banks in eastern Europe remain in a relaxation phase, reflected in further decline in central banks rates in Hungary (-25 bps), Russia (-25 bps) and Serbia (-50 bps). In the Latin American region, Brazil became the first country to announce a rate hike with an increase of 75 bps to 9.5%, surpassing market expectations.
Economic Growth in Indonesia
Indonesia’s economic growth in Q1/2010 is forecasted to soar beyond earlier predictions. The latest indicators for Q1/2010 suggest that growth in domestic demand is on track. Estimates point to the continued strength of household consumption in line with rising public purchasing power and buoyant consumer confidence. Similarly, investment charted high estimated growth in response to more vigorous demand from trading partner nations, a more conducive investment climate at home and the initiation of government infrastructure projects. In other developments, the improvement in the global economy has stimulated exports, which now have potential to outperform earlier forecasts. Imports are also forecasted to rise in response to strengthening domestic and external demand. In Q1/2010, economic growth reached an estimated 5.7% (yoy), ahead of the preceding quarter. in early Q2/2010, mounting external demand is expected to boost exports and domestic investment and thus maintain high levels of economic growth during Q2/2010. On the supply-side, the more vigorous sectoral performance in Q1/2010 is predicted to carry forward into Q2/2010, lead by the trade, hotels and restaurants and the agriculture sectors. Similarly, the transport and communications and the electricity, gas and water utilities sectors are forging ahead with high growth.
Household consumption is expected to maintain vigorous growth.
The strength of household consumption is bolstered by developments in various leading consumption indicators. Consumption of durable goods, Graph 2.3 Growth of Vehicle Sales
��������
�������
��� ��� ��� �� �� �� �� �� ���
��������
���� ���� ����
such as cars, motorcycles (Graph 2.3) and electronics (Graph 2.4) is on the rise. The retail sales index also reported high growth for March 2010, buoyed by the categories of food and tobacco, clothing and accessories and stationery. Further indication of household consumption growth came from brisk growth in such indicators as real M1, real consumption credit and credit card transactions (Graph 2.6). The buoyant trend in household consumption growth is also bolstered by improved public purchasing power from stronger incomes in export-oriented regions, the 5% pay hike for civil servants, military and police and the increases in the 2010 provincial minimum wage levels. Household consumption is predicted to expand more aggressively in Q2/2010, bolstered among others by the organisation of the 2010 election election of regional government chiefs.
Investment is projected to chart vigorous growth for Q1/2010, carrying forward into the coming quarter. Developments in leading investment indicators point to rising investment growth. Investment growth is bolstered mainly by realised construction and infrastructure investment, indicated by high levels of cement consumption. Besides this, various regulatory improvements and the launching of government infrastructure programmes have brought a more conducive direction to the investment climate. Rising investment growth is also reflected by various leading investment indicators. In February 2010, rising imports of capital goods and raw materials reflected a positive direction in non-construction investment (Graph 2.7). A similar trend was also evident in rising
cement consumption growth (Graph 2.6) as of March 2010, consistent with increased realisation of construction sector and infrastructure projects. Demand for heavy equipment is edging upwards in response to improvement in the global economy followed by expansion in the mining, estates and infrastructure sectors. Despite this, indications of stronger investment have not been supported by improvements in financing, as evident from muted growth in investment credit and leasing (Graph 2.8).
The renewed pace of global economic activity combined with mounting commodity prices points to strong gains in export performance. Reflecting this is the upward trend in international market commodity prices that has bolstered global trade volume, as reflected in the Baltic Dry index for March 2010. The upward trend in production indices, consumer confidence levels and business sentiment in Japan and the United States as of March 2010 provided added boost for accelerated export growth. The accelerating trend in export growth is forecasted to carry forward into Q2/2010, particularly for exports of mining and
Graph 2.4Sales of Electronic Products
manufactured products to the US, Europe and China. Analysed by sector and commodity, growth in non-oil and gas exports was again driven by exports of industrially processed resource-based commodities, such as palm oil, and mining products, notably coal.
Import growth in Q1/2010 is also predicted higher in line with mounting levels of domestic and external demand. This is consistent with movement in leading import indicators, which show that imports have entered an upward phase in the cycle when compared to the earlier quarter. More vigorous import performance is also visible in increased VAT revenues from imports and demand for imports from major trading partners. Growth in non-oil and gas imports mounted significantly in March 2010 to 68.58% (yoy) compared to the same period one year before. Analysed by category of use, this growth was driven mainly by consumer goods imports, followed by imports of raw materials. In contrast, the lowest increase was recorded in imports of capital goods (Graph 2.10). For the time being, overall import growth is driven by more vigorous expansion in imports of raw materials and intermediate inputs.
Sectoral performance in Q1/2010 is estimated to have strengthened from the preceding quarter. Manufacturing growth is on a positive trend, driven by more robust export demand. Similarly, higher growth in the trade, hotels and restaurants sector was bolstered by more vigorous performance in the wholesale trade subsector (imports). Activity also mounted in the construction sector following cuts in home mortgage interest rates. In other sectors, transport and communications is enjoying vibrant growth buoyed by performance in the telecommunications subsector. Upbeat performance in the estates subsector also boosted the fortunes of the agriculture sector as a whole.
Inflation
Concerning prices, inflationary pressure remains low and under control. Prices in April 2010 were influenced by non-fundamentals in the volatile foods category. However, inflationary pressure stayed remarkably low in core inflation and the administered prices category. CPI inflation in April reached 0.15% (mtm) or 3.91% (yoy, Graph 2.11), having climbed from the previous month recorded at -0.14% (mtm) or 3.43% (yoy). Inflation in April 2010 was fuelled mainly by higher food prices, led by seasonings and vegetables, offsetting the effect of falling rice prices related Graph 2.7 Investment Indicators
Graph 2.8 Growth of Investment Credit and Leasing
Graph 2.9 Export Growth by Sector
to the ongoing harvest season. However, developments in fundamentals and administered prices did not result in any significant contribution to inflation in April 2010.
Pressure from core inflation remained mild. The subdued level of core inflation is explained by the appreciating trend in the rupiah and low inflation expectations. In other developments, the adequate supply-side response to mounting demand has kept inflationary pressure from the output gap to a minimum.
In disaggregation by expenditure category, April CPI inflation was driven mainly by food stuffs (Graph 2.12). The index rise in the food stuffs category is explained by mounting pressure from seasonings and vegetable prices. Another category generating significant upward pressure on CPI inflation was processed foods with a contribution of 0.04%.
Administered prices inflation was minimal during the month under review in the absence of government rulings on strategic items. The inflationary contribution in this category is explained by an 0.04% rise in cigarette prices. Other than this, the smooth operation of the household fuel conversion programme helped contain inflation in this category. Taken together, administered prices inflation in April remained low at 0.23% (qtq) or 2.39% (yoy).
In contrast to the historical trend, volatile foods inflation recorded a surprising inflationary surge during the harvest season. Inflation in the volatile foods category was recorded at 0.34% (mtm), or in annual terms at 6.39% (yoy). This contrasts to similar periods in earlier years, when the volatile foods category almost consistently recorded deflation1. The onset of the harvest season toward the end of the month caused rice prices to ease by about 1.6% (mtm), following an almost 3% drop in the preceding month (mtm, Graph 2.13). Besides the harvest, an added factor keeping rice prices under control was the successful operation of the Rice for the Poor (Raskin) programme by the National Logistics Agency (Bulog). While rice was in abundant supply, rising pressure came from price escalation for various non-rice commodities, such as miscellaneous seasonings and vegetables. Price increases were driven mainly by red chilli peppers, tomatoes, shallots, garlic and some vegetable varieties. These price surges are predicted to be temporary, being caused by disruptions in supply and distribution brought on by adverse weather conditions in some
Graph 2.12 Inflation by Category of Goods and Services (%, mtm) Graph 2.10 Import by Commodities
Graph 2.11 Inflation
1 In April last year, volatile foods recorded deflation at -1.53% (mtm).
agricultural production centres. Rice prices are expected to sustain only minimum impact from increases in fertiliser prices, a development reflected in the January 2010 adjustment in the government procurement price in which any increased costs of production will be absorbed by farmers. At the same time, escalating global market prices food commodities have had only limited impact on domestic prices. Among others, this is reflected in the downturn in domestic cooking oil prices despite the upward trend in international prices for CPO.
Pressure from core inflationary was again low and stable in line with muted pressure from external factors and subdued inflation expectations. During the month under review, core inflation reached only 0.09% (mtm), down from 0.15% (mtm) in the preceding month and bringing the annual rate of core inflation to 3.70% (yoy). From the external side, the subdued level core inflation was supported by appreciation in the rupiah that amid indications of rising international commodity prices acted as an effective curb on pressures from imported inflation. A further effect of this was to maintain low public expectations of inflation during a period of public controversy over increases in electricity billing rates. The minimal disruption from external and domestic factors also maintained a comfortable level of public inflation expectations (Graphs 2.15 and 2.16). Added to this was only limited demand-pull pressure with demand growth offset by adequate levels of capacity utilisation.
Rupiah Exchange Rate
The surge of foreign capital pouring into Asia since early 2010 has bolstered the appreciating trend in the rupiah. The positive condition of Indonesia’s economic fundamentals combined with relative attractiveness of investment returns compared to other nations stimulated higher inflows of foreign capital into the domestic financial market. In average terms, the rupiah strengthened 1.5% in April 2010 to Rp 9,027/ USD, compared to Rp 9,163/USD one month earlier (Graph 2.17). At month-end, the rupiah closed 0.87% higher at Rp 9,012/USD compared to closing one month earlier. Despite continued gains, the rupiah nevertheless charted more stable movement compared to the earlier quarter, as
reflected in a drop in volatility from 0.45% (March 2010) to 0.23% (Graph 2.18).
Graph 2.14 Herbs and Spices Inflation (yoy) Graph 2.13 Volatile Food Inflation and Rice
Graph 2.15 Retailer Inflation Expectation (Bank Indonesia RetailSales Survey)
Besides capital inflows, appreciation in the exchange rate was also driven by the solid fundamentals of the domestic economy. Forecasts of sustained improvement in economic growth and the expected robust current account surplus underpinned the surge in investor
confidence in the domestic financial market. The solid performance in exports, which has bolstered the expected current account surplus, has generated added supply of foreign currency to the domestic market and in so doing strengthened domestic economic resilience and provided added cushioning for the rupiah exchange rate against external sector turbulence.
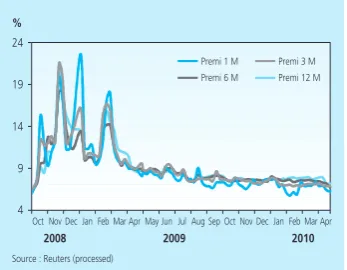
The robust condition of domestic economic fundamentals has been influential in the upgrading of investment risk in Indonesia. The continued susceptibility of global financial markets to turmoil has not affected investor perceptions of risk concerning investment in Indonesia. At the end of April, risk indicators for investment in Indonesia began showing improvement. The EMBIG spread held steady at around the 260 bps mark (Graph 2.21). The yield spread for Indonesia global bonds over US T-Notes was largely stable at 170 bps during the month. The CDS spread, indicating risk for Indonesian bonds, similarly remained stable at 162 bps compared to the previous month-end. Swap premia, another indicator of risk, were unchanged, a development indicative of comparatively low pressure on the rupiah (Graph 2.22).
The high yields on rupiah investments compared to other nations in the region are a key attraction bringing foreign capital into the domestic economy. Broad interest rate differentials have prompted a rush of foreign capital pouring into Asia, with benefits also for Indonesia. The subdued level of risk indicators has enabled Covered Interest Rate Parity (CIP) to maintain a widening trend. In April 2010, Indonesia’s CPI stood at 4.32%, ahead of other countries in the region including the Philippines, Malaysia and Korea (Graph 2.23).
Monetary Policy
Interest Rates
Like before, monetary policy transmission to short-term interest rates operated smoothly. In April 2010, the average overnight interbank
rate saw further decline while the BI Rate held steady at 6.50%. The Graph 2.18 Rupiah Exchange Rate Volatility Graph 2.16 Consumer Inflation Expectation
(Bank Indonesia Consumer Survey)
daily average overnight interbank rate was recorded at 6.09%, down 6 bps from one month earlier. The easing in the overnight interbank rate is consistent with the growing excess liquidity in the banking system, particularly in short tenors. This reflects a downward trend in interbank market risk perceptions. Improving perceptions of counterparty risk were reflected not only in overnight rates, but also in interbank rates in longer tenors. Alongside the decline in the O/N interbank rate, interbank rates in longer tenors also eased in varying magnitude (8-11 bps). Despite this, rates in the 27-30 day tenor were up 5 bps over the previous month to reach 6.56%, a condition explained by the micro structure of the money market with interbank transactions seldom recorded in this tenor.
Interbank transaction volume was up in April 2010. In analysis of monthly developments, average daily volume (lending and borrowing) on the overnight interbank market and in all interbank tenors was up in April 2010 from volume in preceding months. This not only reflects the upbeat pace of economic activity but also confirms the improving bank perceptions of country risk and attests to the success of policy actions in extending the SBI maturity profile in order to deepen the money market.
Monetary policy transmission through the bank interest rate channel to deposit and lending rates again operated smoothly. The weighted average 1-month deposit rate came to 6.77% in March 2010, having eased from 6.93% one month earlier. Similar movement was also recorded with average decline in deposit rates for various tenors, while 12-month deposit rates underwent the steepest cuts at 88 bps. Despite the decline, a considerable spread remains between short-term (1 and 3-month) and 12-month deposit rates. This reflects the intensive efforts of banks to offer customers added incentive to hold funds in longer-term deposits.
In analysis by category of bank, foreign and joint venture banks again represented the most important contribution to decline in deposit rates. Foreign and joint venture banks, however, offer the lowest level of deposit rates compared to all other bank categories. Conversely, deposit rates are highest at regional development banks. This reflects the drive by banks and particularly regional development banks to mobilise customer funds.
Similarly, indications for March 2010 point to further decline in loan interest rates. Loan interest rates (averaged over working capital, investment and consumption credit) are projected to decline further in line with improving risk perceptions in the banking system and the downward Graph 2.19 Foreign Capital Flows into Asia
Stock Markets
Graph 2.20 Appreciation/Depreciation Exchange Rate Average 2010 (ytd)
Graph 2.21 Indonesia Risk Perception Indicator
movement in bank deposit rates (Graph 2.23). The steepest drop was recorded in rates for consumption credit, followed by investment credit and working capital credit rates.
In analysis by category of bank, foreign and joint venture banks contributed the most to decline in lending rates, with particularly steep reductions in rates for investment credit and working capital credit. In average terms, foreign and joint venture banks, cut loan interest rates by 31 bps, more than for any other category of bank. Analysed by level, the highest rates for working capital credit were recorded in the regional development bank category. Private banks charged the steepest rates for investment credit, while rates for consumption credit ranked highest among the foreign and joint venture banks. The high consumption credit rates charged by foreign and joint venture banks are consistent with the predominance of consumption credit within the total lending portfolios of these banks.
Graph 2.22 Premium Swap
Graph 2.23 CIP Indicator in Asia Countries
Table 2.1
Development of Various Interest Rates
Interest Rate (%)
BI Rate 7.75 7.5 7.25 7.00 6.75 6.50 6.50 6.50 6.50 6.50 6.50 6.50 6.50 Deposit Guarentee 8.25 7.75 7.75 7.50 7.25 7.00 7.00 7.00 7.00 7.00 7.00 7.00 7.00 1-month Deposit (Weighted Average) 9.42 9.04 8.77 8.52 8.31 7.94 7.43 7.38 7.16 6.87 7.09 6.93 6.77 Base Lending Rate 13.94 13.78 13.64 13.40 13.20 13.00 12.96 13.01 12.94 12.83 12.65 na na Working Capital Credit 14.99 14.82 14.68 14.52 14.45 14.30 14.17 14.09 13.96 13.69 13.75 13.68 na Invesment Credit 14.05 14.05 13.94 13.78 13.58 13.48 13.20 13.20 13.03 12.96 13.24 13.21 na Consumption Credit 16.46 16.48 16.57 16.63 16.66 16.62 16.67 16.53 16.47 16.42 16.32 16.36 na
2009 2010
Mar Apr May Jun Jul Aug Sep Oct Nov Dec Jan Feb Mar
����������������������������
�
� � �� �� ��
��������� ��������� ��������� ����������
���� ���� ����
��� ��� ��� ��� ��� ��� ��� ��� ��� ��� ��� ��� ��� ��� ��� ��� ��� ��� ���
�
���� ���� ���� ���� ���� ��� ��� ��� ��� ��� ���
����
���� ����
���� ��������
��������� ����� �����������
���� ���� ���� ����
Funds, Credit, and the Money Supply
The growing demand for credit is consistent with the pace of economic recovery. Similarly, funding positions are also on the rise. In March 2010, funding growth reached 11.0% (yoy), ahead of the previous month’s expansion of only 9.3% (yoy) (Graph 2.25). As a result, the bank funding position mounted by Rp 9.1 trillion to Rp 1,982.2 trillion. In analysis by component, funding growth again relied mainly on expansion in time deposits, even in spite of the progressive decline in deposit rates. This is explained by the dominant share of bank funding held by individual depositors, most of whom keep funds in rupiah-denominated time deposits. Alongside this, the contribution of foreign currency deposits to funding growth widened from 1.3% (yoy) to 4.6% (yoy) in March 2010, with growth recorded mainly in foreign currency demand deposits held by non-financial company private customers. This appears to have resulted from steady appreciation in the rupiah.Monetary policy transmission through the credit channel is showing
an improving trend in response to growing domestic demand. In
March 2010, credit growth (including channelling) reached 10.7% (yoy), ahead of 9.4% (yoy) one month earlier (Graph 2.25). Credit expansion as of March 2010 was recorded at Rp 15.1 trillion (1.0%, ytd). This shows that lending has improved over the past year and is even surpassing performance in 2007. Indications point to demand-side and supply-side contributions to credit growth. On the demand side, improvement in domestic economic conditions has increased demand for credit. However, in regard to credit supply in the banking system, one factor contributing to increased lending is the progressive easing in loan interest rates.
Analysed by category of use, credit expansion was fuelled mainly by consumption credit. Growth in consumption credit during March 2010 reached 27.8% (yoy), Consumption credit provided the main force driving credit expansion (Graph 2.26). Investment credit growth has also improved with expansion at 13.1% (yoy) during the same period. At the same time, the previously negative growth in working capital credit has turned around with renewed positive 1.9% expansion (yoy). Analysed by currency, stronger growth during March was visible mainly in indications of sustained improvement in rupiah-denominated lending (18.5%, yoy). However, foreign currency credit (USD-denominated) recorded negative growth, mainly from the effect of exchange rate appreciation in Graph 2.24 Development of Various
Interest Rates
Graph 2.25 Development of Funds, Credits, and BI Rate
Graph 2.26 Credit Growth by Usage
2010. In disaggregation by sector, the more buoyant credit growth was driven mainly by the miscellaneous sector, consistent with the trend in consumption credit.Nevertheless, credit growth in March 2010 was also attributable to contributions from the mining, social services, transport and the electricity, gas and water utilities sectors. Besides this, mining sector lending measured as a share of total credit growth surged dramatically in March 2010. Looking forward, mining and manufacturing are set to contribute more to the acceleration in credit expansion in response to the improvement in domestic and eternal economic conditions.
Monetary policy transmission in the economic liquidity channel was reflected in the corrective trend in M1. Growth in M1 economic liquidity, which had maintained an upward trend since October 2009, slipped to only 9.7% (yoy) in March 2010 from the previous month’s level of 13.7% (Graph 2.27). This is explained by the high volume of personal tax payments during March 2010. In addition, the public is showing keener interest in holding funds in time deposits. The combination of these developments resulted in an improvement in M2 growth from 10.4% (yoy) one month earlier to 11.4% (yoy) in March 2010.
In March 2010, the M1 position fell Rp 18.l7 trillion from end of year to Rp 503.1 trillion. This decline in M1 was nevertheless below that for the same period in past years, a development indicative of rising economic activity. The M2 and Rupiah M2 positions narrowed by Rp 5.2 trillion and Rp 14.7 trillion from year end due to reduction in quasi-money components at the beginning of the year. M2 movement in March 2010 was ahead of the similar periods over the past 3 years. This points to renewed strengthening of economic activity among the population during March 2010.
The Stock Market
Stock market performance continued to chart new gains. At
end-April, the JSX Composite Index closed at 2,971, ahead of the March 2010 closing position of 2,777. Domestic factors played a key role in the index growth, buoyed by growing investor optimism for Indonesia’s economic condition reflected in low interest rates, mild inflation and buoyant economic growth. The bullish JSX Composite placed Indonesia’s stock exchange as the third best performing market in Asia after Vietnam and Singapore (Graph 2.29).
Graph 2.27 Growth of Currency in Circulation (Nominal)
Graph 2.28 Growth of Currency in Circulation (Real)
Graph 2.29 JCI and Regional Index
During April 2010, foreign investors booked a Rp 0.07 trillion net purchase in daily trading, down from the preceding month. This decline resulted from the wait-and-see stance by foreign investors regarding the global economic outlook. Even so, the drop in the net foreign purchase did not diminish share trading volume, which instead mounted to Rp 5.3 trillion per day in April 2010 from Rp 4.7 trillion per day one month before (Graph 2.30). This indicates that April stock trading was driven more by domestic investors eager for second-tier shares. In analysis by sector, index growth was driven more by second-tier stocks in the trading and consumer goods sectors. However, commodity-based sectors such as mining are on an upward trend, as indicated by the 11.9% climb in the Baltic Dry Index.
Government Securities Market
Improving performance was also visible on the government securities market, with yield declining evenly across all tenors. Investors on the market are imbued with optimism for the Indonesian economy due to minimal inflationary pressure and the relative stability in the exchange rate. As a result, yield on government securities averaged 8.5%, representing a drop of 34.3 bps. In analysis by tenor, yield on government securities in short, medium and long tenors eased by 31 bps, 43 bps and 49 bps. When compared to the recent crisis period (October 2008), yield on short, medium and long-term government securities has fallen by 1275 bps, 1089 bps and 1032 bps. In addition to domestic factors, the reduced yield on government securities in April 2010 is also explained by upbeat conditions on global financial markets. Furthermore, the declining term premium on government securities and competitive returns offered by Indonesia compared to other countries in the region2 hold particular attraction investors, and have fuelled capital inflows on the government securities market.
In April 2010, the net foreign purchase on the government securities market reached about Rp 15.6 trillion, up from the March 2010 net foreign purchase of only about Rp 11.6 trillion. With foreign capital inflows on the rise, market liquidity for government securities also improved. Trading volume in government securities improved on average to Rp 6 trillion per day in April 2010 from the March 2010 average at Rp 5.5 Graph 2.30 JCI and Average Daily Trading
Volume
������������
� � � � � ��
���� ���� ���� ����
�������������������������������������� ���������
� � � � �� �� � � � � �� �� � � � � �� �� � � ���
����� ����� ����� ����� ����� �����
2 The term premium is measured by the yield spread between long-term and short-term government securities. Indonesia’s competitive position is evident from a comparison of real yield (after allowing for inflation) with other countries in the region.
Graph 2.31 Government Securities Trading Value
������������ �
� � � � � ��
� �� �� ��
�������������������������������������� �������������������
���� ���� ���� ���� ���� ����
trillion per day (Graph 2.31). Mounting trading activity on the government securities market was matched by frequency of daily trading, which climbed to 314 transactions per day in April 2010 from the March 2010 frequency recorded at 298 transactions per day (Graph 2.32).
Mutual Funds Market
The fortunes of the mutual funds market have strengthened considerably in response to improved performance in underlying assets, led by stocks and government securities. High-growth categories of mutual funds include equity funds, fixed income and mixed funds, while debt securities funds were generally stable. Indices for equity funds, fixed income funds and mixed funds were up by 4.6%, 1.7% and 2.3%. Even so, gains charted by mutual funds lagged behind performance on the stock market, where the JSX Composite mounted by 6.9% (Graph 2.33).
Condition of the Banking System
The banking sector continues to chart robust performance. Key banking indicators, such as the capital adequacy ratio (CAR), non-performing loans (NPLs), net interest margin (NIM) and return on assets (ROA), reflected healthy developments. NPLs in March 2010 were down on the preceding month at 3.8% and the CAR again reported a solid position at 19.1%, well above the 8% minimum mandated by BI. At the same time, ROA was up slightly from one month earlier at 3.0% while NIM held stable at 0.5% (Table 2.2).
Graph 2.32 Government Securities Trading Frequency
Graph 2.33 Mixed Mutual Fund Index, Permanent Income, and Stocks
������������
� ����� ����� ����� ������ ������ ������
������������������������
���� ���� ���� ����
� � � � � �� � � � � � �� � � � � � �� �
� �� ��� ��� ��� ��� ���
������������������� ������������ ����
���� ���� ���� ���� ���� ����
III. MONETARY POLICY RESPONSE
In the Board of Governors Meeting convened on 5 May 2010, Bank Indonesia decided to maintain the BI Rate at 6.5%. At this level, the BI Rate is regarded consistent with achievement of the 2010 and 2011 inflation target, set at 5%±1%, while also conducive to measures to bolster the economic recovery process, financial stability and bank intermediation.
Table 2.2
Main Indicators of Banking System
Main Indicators
Total Aset (T Rp) 2,310.6 2,307.1 2,344.9 2,352.1 2,327.4 2,309.8 2,354.3 2,331.4 2,384.6 2,388.6 2,392.7 2,439.7 2,534.1 2,501.8 2,517.0 2,563.7
DPK (T Rp) 1,753.3 1,745.6 1,767.1 1,786.2 1,780.9 1,783.6 1,824.3 1,806.6 1,847.0 1,857.3 1,863.5 1,897.0 1,973.0 1,948.6 1,931.6 1,982.2
Credit (T Rp) 1,353.6 1,325.3 1,334.2 1,342.1 1,332.1 1,339.2 1,368.9 1,370.2 1,400.4 1,399.9 1,410.4 1,430.9 1,470.8 1,435.7 1,459.7 1,485.9
LDR (%) 77.2 75.9 75.5 75.1 74.8 75.1 75.0 75.8 75.8 75.4 75.7 75.4 74.5 73.7 75.6 75.0
NPLs Gross* (%) 3.8 4.2 4.3 4.5 4.6 4.7 4.5 4.6 4.5 4.3 4.3 4.4 3.8 3.9 4.0 3.8
NPLs Net * (%) 1.5 1.6 1.6 1.9 2.0 1.9 1.7 1.7 1.5 1.3 1.2 1.4 0.9 1.1 1.0 1.0
CAR (%) 16.2 17.6 17.7 17.4 17.6 17.3 17.0 17.0 17.0 17.7 17.6 17.0 17.4 19.2 19.3 19.1
NIM (%) 0.5 0.5 0.3 0.6 0.5 0.5 0.5 0.5 0.5 0.4 0.5 0.5 0.5 0.5 0.5 0.5
ROA (%) 2.3 2.7 2.6 2.8 2.7 2.7 2.7 2.7 2.7 2.6 2.7 2.6 2.6 3.1 2.9 3.0
2008 2009 2010
Dec Jan Feb Mar Apr May Jun Jul Aug Sep Oct Nov Dec Jan Feb Mar
* Provisional Figures
* Using 2000 base year (BPS-Statistic Indonesia) 1) end of week
2) weighted average 3) end period closing 4) closed file
Sources : Bank Indonesia, except stock market data (BAPEPAM), CPI, export/import and GDP (BPS)
Latest Indicators
FINANCIAL SECTOR
P R I C E S
EXTERNAL SECTOR
QUARTERLY INDICATOR
INTEREST RATE & STOCK One month SBI 1) Three month SBI 1) One month Deposit 2) Three month Deposit 2) One week JIBOR 2) JSX Indices 3)
MONETARY AGGREGATES (billions Rp) Base Money Quasi Money (Rupiah) Time Deposit Saving Deposit Foreign Currency Deposit Broad Money Rupiah Claim on Business Sector Credit by DMBs
CPI - monthly (%, mtm) CPI - 1 year (%, yoy)
Rp/USD (endperiod,midrate) Non oil/gas Export (f.o.b, million USD) 4)
Non oil/gas Import (c$f, million USD) 4)
Net International Reserve (million USD)