THE MICROSOFT GLOBAL ORTHO PROGRAM
Wolfgang Walcher a, Franz Leberl b, Michael Gruber c
a Microsoft Bing Imagery Technologies, 1900 15th Street, Boulder, Colorado, [email protected] b Graz University of Technology, Inst. of Computer Graphics and Vision, Austria
c Microsoft Bing Imagery Technologies, Graz, Austria
Commission IV, WG IV/2 - Automatic Geospatial Data Acquisition and Image-Based Databases
KEY WORDS: Transnational, Photogrammetry, Automation, Ortho-Rectification, Aerial Camera, Digital Elevation Model
ABSTRACT:
Wide area and thus continental mapping extending beyond national borders is a novel concept in civilian photogrammetry. The Microsoft Global Ortho Program was launched in the Spring of 2009 as a result of Microsoft’s need for global geo-data at a high geometric resolution and radiometric excellence. By fall of 2012 more than 10 million km2 of the USA and 14 European countries will have been covered by seamless 30 cm GSD color-, 60 cm GSD false-color infrared ortho-mosaics and a 1 meter GSD digital surface model. The ortho-maps are being published to Microsoft’s Bing Maps Internet mapping portal.
The Global Ortho Program was designed for highly and unprecedented automated mapping of essentially entire continents. In 2011, exclusive of flight operations, the product output per person has been measured in excess of 275,000 square km per year. We describe research efforts that made this achievement possible. Those include a specially designed aerial sensor (Ultracam G), logistics simulation for fight planning and optimization, in-flight blur detection and subsequent automatic blur removal, modeling and removal of atmospheric and environmental conditions, automated shear detection and DTM refinement, an IT architecture to process > 200,000 aerial images/day, and for creating over 1,000,000 km2 ortho-imagery and DSM data in 24 hours.
While addressing these issues, we provide ideas how this might affect the future of spatial infrastructure initiatives.
1. Motivation for the Global Ortho Program
Online mapping portals like Microsoft Bing Maps have distinguished themselves from earlier services by an imagery-rich global experience. Users are expecting high-resolution, recent imagery of any place in the world. With commercial satellite imagery being restricted to resolutions of 50 cm or less, aerial imagery may be preferable. However, such coverage has not been very conducive to global applications. This, in 2009, triggered a Microsoft-decision for the Global Ortho Program. The goal: Cover the USA and Western Europe with 30 cm resolution orthophoto imagery in 2 years or less. The Bing Maps Imagery Technologies team (BITs) in Boulder, Colorado was tasked with executing the program.
Global Ortho is not a one-off project; it plans to extend into new territories and continuously update aging imagery.
2. Program Scope
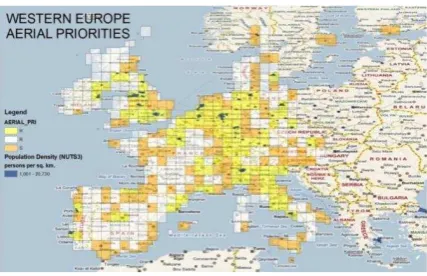
Phase 1 of the Global Ortho Program covers the 48 states of the conterminous USA and 14 countries in Western Europe. Figure 1 (USA) and Figure 2 (EU) show the respective maps overlaid with the 1° x 1° cell grid [see section 3]. Phase-1 comprises close to 1,400 complete and partial 1°-cells with ~10.4 mio km2 of land. By April 2012 the program covered > 99% of the US and 66% of the European terrain, well ahead of schedule. Transnational aerial mapping of this scale has no precedence, although one can assume that there are past or present non-publicized governmental satellite mapping projects of even larger size and much higher costs like the $7.3 Billion EnhancedView contract awarded by US National Geospatial-Intelligence Agency (NGA) [EnhancedView, 2012]
Aerial mapping programs could be related to one another via the number of pixels generated. In 2011, Global Ortho created 8,400,000 km2 of in-spec 30-cm orthomosaics, Color InfraRed (CIR) mosaics and other by-products. The 2011 Global Ortho pixels were > 30 times bigger than the average annual output of
the USA National Agriculture Imagery Program (NAIP) [NAIP, 2009]. That program creates 1m GSD color imagery of about one third of the continental USA every year. At one pixel per square meter, this equates to a multi-year average of about 3 trillion pixels per year. For comparison, in calendar year 2011, Global Ortho was creating 112 trillion pixels. This very likely makes Global Ortho the largest commercial aerial mapping program to date.
Figure 1: 1° grid in USA. Colors describe priorities by population density (H-high, S-standard, R-rural).
3. Program Logistics and Aerial Acquisition
Irregular national borders complicate any orthophoto project. Global/transnational coverage supports efficiency. Therefore the well- established 1° x 1° grid as defined by the US-NGA serves well to spatially organize the Global program. The 1° cell or “block” is a production unit with an average area of ~8,000 km2. All specifications, planning, processing, quality control and product publishing are based on those blocks. Partial cells exist near water and along denied areas.
The North-South dimension of each cell is approximately 111 km while East-West dimensions decrease with latitude. Flight direction is standardized to N-S unless terrain or airspace restrictions force a different pattern. Flight plans minimize the number of flight lines for a cell. High forward overlaps at 85% are needed for fully automated aerotriangulation and dense image matching. Therefore, a typical cell will be covered by 12 to 20 N-S flight lines producing ~ 1,700 exposures.
Population density causes slight variations in specifications. About 10% of the areas are urban with denser flight lines to minimize building lean in ortho-products [thus High, Standard and Rural population densities in Figs 1 and 2].
To collect imagery per cell within a single 6-hour-aerial sortie, the novel UltraCam-G [UC-G] camera was built [section 5]. High productivity also was made possible by means of a novel project simulation tool. Individual airplane characteristics, flight plan (altitude, lines, turns, etc.), historic weather patterns, daily sun angle, leaf on-off seasons, seasonal snow cover, technical, logistical and localized environmental factors enter into scenarios for the forecast of a globally optimized solution.
Figure 3: Simulated flight pattern over the N-E US for a 6-month period. Color indicates different flight dates.
The forecast over a period of 12 months has proven to be within ± 4% of actual acquisition totals. As a result of this optimization, only 12 UC-Gs, operated by experienced regional aerial photography firms, were required for all aerial work. These UC-Gs and aircraft collected > 1 mio km2 in Oct 2011.
4. Global Ortho Data Products
Global Ortho produces a 30 cm RGB true color and 60 cm false color infrared (CIR) orthophoto (Figs 4, 5). A digital surface model DSM [and DTM] gets created for use in image rectification. Only the RGB-product is published to Bing Maps. The 1° grid, as the smallest unit of data production, is a seamless image mosaic with a 200 meter buffer into adjacent
cells or bodies of water. Each color-ortho has a twin CIR mosaic, even though at a lower resolution [1 CIR-pixel = 4 RGB-pixels]. The CIR product is not published to Bing Maps but can be purchased from DigitalGlobe.
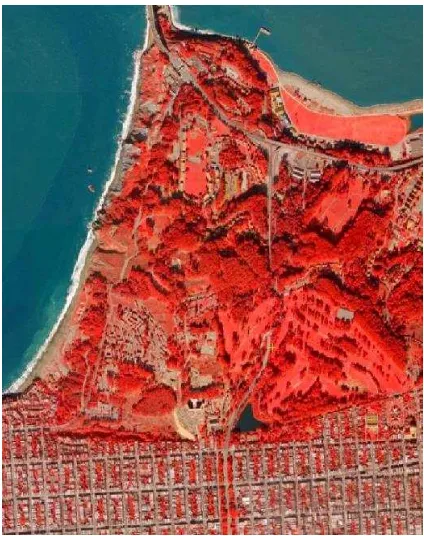
Figure 4: Color RGB orthophoto mosaic, Presidio in San Francisco, CA. Area shown is ~ 2.5 km by 3.0 km
Figure 5: Color Infrared (CIR) ortho mosaic of area in Fig.4
measureable in a way that can be implemented in computer programs. At the same time the old adage applies, namely that 100% perfection is impossible to achieve. Conversion of standard aerial trade practices into computer code reveals their often very vague language, and that expectation of flawless perfection is unrealistic.
A discussion of all quality measures and specifications is beyond this publication. However, we can describe the most important specification, namely on absolute positional accuracy. Table 1 below lists the minimum requirements for absolute horizontal errors. It is important to mention that to date, with 90% program completion, all tests so far have shown an RMS error of less than ± 2 meter in x and y directions.
Block Designation
CE95 Accuracy Requirements
~ Equivalent RMSE in X and Y High Population 10 ft / 3 m 4 ft / 1.2 m
Standard 15 ft / 4.5 m 6 ft / 1.8 m
Remote 20 ft / 6 m 8 ft / 2.4 m
Table 1: Minimum absolute positional accuracy requirements by class of block. In practice, to date all “Remote” blocks have meet or
exceeded the “Standard” accuracy requirement.
The vertical errors of the DSM affect the XY-accuracy, especially with a wide-angle UC-G. DSM postings are at 1 m (Figure 6). This in turn produces the DTM for ortho-rectification. The DSM is available from Bing Maps, the DTM data has not been released as a product.
The DSM is created from highly overlapping 75 cm resolution UC-G panchromatic images, using global optimization as it is currently being used globally [Hirschmüller, 2005, 2008]. The product is sampled at a 1 m grid spacing, but the true horizontal resolution is closer to 1.5 m in most cases. The vertical accuracy of the DSM has been measured at ± 1 m on solid surfaces using ground truth.
Figure 6: Visualization of ~3 km2 near the Boeing facilities north of
Seattle, WA as a detail from the nation-wide DSM. Point density at 1 m; nominal vertical error is at ± 1 m on solid surfaces.
It is worth mentioning that the RGB, CIR, and DSM data are all created from the same UC-G images and are therefore perfectly aligned in time and space.
5. UltraCam G: Aerial Camera for Large Area Orthos
An aggressive program timeline and cost plan resulted in the development of a novel aerial camera concept in the form of the UC-G. While the stitching of large images from smaller tiles was retained, the novel camera inverts the role of panchromatic and color imaging and pan-sharpening [Weidner
Centeno, 2009]. A wide swath with almost 30K cross-track pixels and high photogrammetric elevation accuracy was achieved. The later was especially important to avoid the dependency on pre-existing elevation models for the creation of high-quality ortho products.
The UC-G came about in 2009 at Microsoft Photogrammetry in Graz, Austria. This team has a history of developing innovative aerial cameras [Leberl et al., 2003]. Figure 7 and 8 illustrate a 7-cone camera with a larger format, but lower resolution panchromatic as well as a smaller format higher resolution color component. The panchromatic image is formed using the proven technology of the UltraCam Lp with 2 camera heads, using precision calibration [Ladstädter et al., 2010]. The focal length is at 40 mm for a relatively wide field of view of 80° across the swath. This produces a strong photogrammetric solution and serves as the geometry backbone of the UC-G. The color and IR components of the UC-G get collected via another 5 optical cones [as illustrated in Fig. 8] of which 4 are used for the RGB-data, one for the NIR-image.
Figure 7: The UltraCam-G technology is based on the design of the UltraCam family (Senor Unit, Data Storage Unit and User Interface
Panel) but has a new 7-cone concept shown on the right.
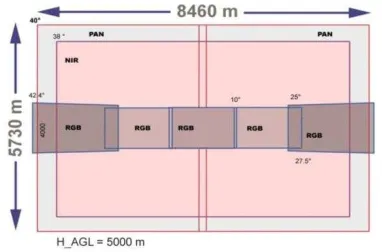
Figure 8: Frame format of the UltraCam-G. At a flying height above ground of 5000 m (16400 ft.) the swath covers > 8 km. Pan and RGB
cover the full swath, NIR has a slightly reduced format.
The panchromatic image has an aspect ratio ~ 3:2. Two 40 mm optical lenses collect light onto a 90 Mpixel panchromatic area CCD array each.
The RGB color is a narrow rectangular frame at 28,200 pixels cross track and about 3,900 pixels along track. The RGB is registered to the panchromatic channel and covers the entire ground but at a smaller forward overlap. Figure 9 illustrates the 3 components (pan, RGB, NIR) of an UC-G image.
overlap of 85% for the pan-images results in a 10% forward overlap of the RGB images.
Figure 9: The 3 image planes of one UC-G frame showing the city of Rome, Italy -- flight direction from left to right. (NIR image is reduced)
6. Ultracam-G Accuracy Experiment
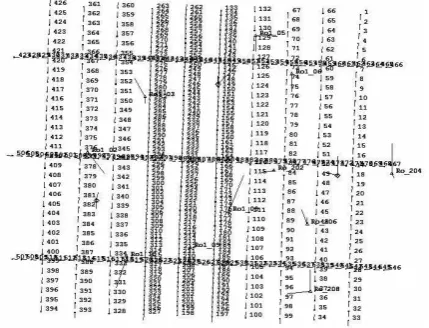
The horizontal system accuracy should be of the order of one color pixel (30 cm). To assess the UC-G capabilities, a test was performed in 2009 over Rome, Italy (Fig.10). The BINGO/UltraMap-workflow for aero-triangulation was applied to the high overlap panchromatic images with their 75 cm pixels. A σ0 was achieved at 0.96 and the RMSE values of ground control points and check points was at ± 0.4 GSD of the panchromatic camera, equal to 30 cm. This geometric performance meets the hoped-for ±1 pixel of the higher resolution RGB image.
Figure 10: Flight layout in Rome [Italy], 546 images, 13 flight lines.
We conclude from those triangulation results that the DSM will support the horizontal accuracy for the RGB product specified in Table 1. Tests with ground truth confirm a vertical DSM-error at ~ 1 and 1.5 times the input pixel size: an RSM-DSM-error at ± 1m gets achieved from 75cm input pixels. The horizontal error due to relief and vertical objects in the RGB-orthos is largest at the edge of the field-of-view at +/- 40° and roughly equal to the vertical error.
7. About Manual Work versus Full Automation
A core innovation is the level of automation that had a team of about 25 people create over 9 million km2 of ortho-imagery in a two years time frame. Automation requires large engineering investments, costly sensors and IT-infrastructure, but results not only in reduced variable costs, but also in predictability, repeatability and scalability of processes, and in the elimination or minimization of human error. The latter is especially significant with highly repetitive tasks. Figure 11 compares manually measured shears [geometric discrepancies along edges/seams of ortho-patches] with automatic measurements and shows a rather significant difference between manual and automated results.
Predictability: Given a set of input data one can foretell the expected properties of the output data along with timelines and resource consumption. This contrasts with approaches relying on “best business practices” or “commercially reasonable efforts”.
Repeatability: Given a set of input data, multiple runs of the same process will create exactly the same results. This permits one to re-think entire workflows, for example with respect to intermediate data that can be recomputed instead of stored. Scalability: Throughput should increase linearly with increased computing, storage and networking capacity.
In this context, automation as not a simple “translation to software” of established manual processes. Processes optimized for humans make the best possible use of human strengths and as a result they often require frequent and intermittent human judgment. By definition those judgment calls are complicated or even impossible to automate.
Instead, once a process is predictable, repeatable, and scalable, it is possible to automatically create multiple different versions of a data product simultaneously. Instead of making multiple human decisions during product creation, the human operator now simply looks at the resulting product variants, picks the most suitable one, and discards all others.
Figure 11: Comparison of over 12,000 manual measurements for image shear to the automated measurements. Offsets from the x=y diagonal
indicate human measurement errors.
operator can use this process to determine optimal settings for such conditions and then train the system to use those settings for all subsequent grid cells with similar conditions. This approach is the very reason for the scale of the IT processing architecture described in the following section.
8. Workflow Management and IT Environment
Processing millions of aerial images for thousands of photogrammetric blocks, potentially multiple times each, does not only require an IT infrastructure of the highest levels. Even more important are tools for process scheduling and data management. For this, Microsoft has developed the proprietary Imagery Processing Framework (IPF). IPF is a general-purpose architecture and used by BITs for all Bing Maps processing and publishing. Principally, it reflects the technologies used by all global internet search providers for their various processing centers. In its core IPF has multiple very large distributed MS SQL Server databases to keep track of processes and data. Currently IPF manages over 2,500,000,000 individual files and 30 million current or past processing tasks along with metadata, hardware status and other vital system information.
IPF is implemented within one of Microsoft’s data centers and accessed remotely from the BITs location in Boulder, Colorado, USA. The current hardware implementation is comprised of approx. 2,400 servers with 24,000 processor cores and 71 petabytes (71,000,000 gigabytes) of available disk storage space. Global Ortho does only require a relatively small percentage of the available processing and storage infrastructure. However, a peak processing capacity in excess of 1 million km2 of Global Ortho data per 24 hours has been achieved and is key to our approach to automation.
9. Some Key Innovations
The Global Ortho processing workflow follows the traditional sequence of aerial acquisition, aerotriangulation and bundle adjustment, DSM and DTM creation, orthorectification and mosaicking, radiometric processing, and final product formatting and QC. However, because of the requirements for scale and automation discussed earlier, the implementation of these individual steps in most cases required innovative approaches. A detailed discussion of all those innovations would far exceed the scope of this publication. Several BITs team members and Microsoft researchers are preparing a series of publications describing individual topics in some detail. Intellectual properties protection limits such publishing activity to patent-pending innovations. Below we highlight a few of those.
Motion Blur: To reduce the need of re-flying an area because of blurred imagery the UC-G software has a novel and unique in-flight capability to detect camera motion that causes motion blur. The camera captures and stores in real-time all the parameters necessary to later algorithmically remove such motion blur from the imagery. The detailed description of this blur detection and removal feature can be found in [Schickler, Shah 2012].
Radiometric Adjustment: All image processing employs 16-bits per color band to make maximum use of the UltraCam’s dynamic range of almost 14 bits. Conversion from the 16 to an 8-bit color space is one of the very last processing steps. To create radiometrically uniform and well balanced output images, first all impactful atmospheric and lighting conditions are removed. Then tonal adjustment and color balancing is
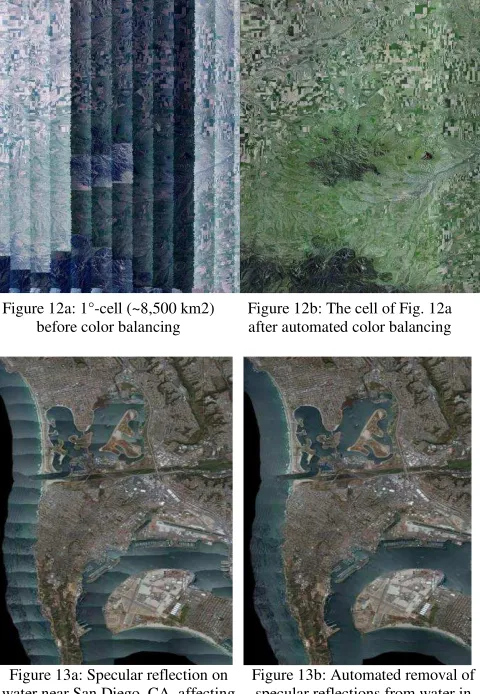
applied to all images of a block. Novel approaches for both processes have been developed by BITs in cooperation with Microsoft Research. Figures 12a and 12b show the same 1°- cell containing 1700 UC-G images before and after applying these processes. In this example, weather changes had resulted in several partial flight missions many days apart resulting in extreme radiometric differences (Figure 12a). Figure 12b shows that same cell after automated color balancing. Specular Reflection: Similar algorithms have been developed to physically model, detect and then suppress the impact of specular reflection, especially on water. In traditional mapping processes such artifacts are often edited and removed by a labor intensive process. In the Global Ortho production process such reflections are almost entirely removed without any user interaction. Figure 13b shows the result of this automated process applied to the image shown in Figure 13a Figure 13a.
Figure 12a: 1°-cell (~8,500 km2) before color balancing
Figure 12b: The cell of Fig. 12a after automated color balancing
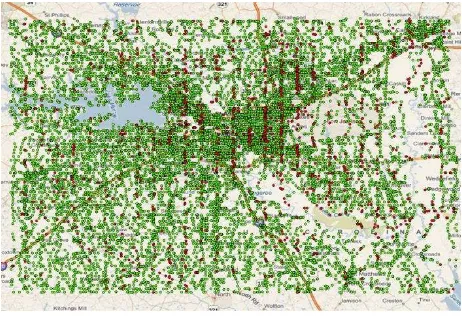
Figure 14: Automated shear analysis along seam lines. 2134 locations (red) out of over 30,000 (green) have questionable shear.
10. Results
A most significant achievement of the Global Ortho Program has been that today it is slightly ahead of schedule while far exceeding the initially expected quality specifications. The program required a number of research questions to be resolved. These included the issue of efficiency and cost in sensing with a novel camera that promises color imagery of large areas with minimum relief displacement of buildings and vegetation, automation of aerial triangulation, dense DEM-creation and seamless orthophoto products from separately collected patches. It also required the setup of a large computing facility to process 200,000 input images for a project area of 1,000,000 km2 per 24-hour period.
The absolute horizontal accuracy of the RGB orthophoto-product was expected to be within ± 1.2 m r.m.s. for urban, and ± 3 m for rural areas [representing ±3 to ± 6 meter Circular Error at 95% probability]. Measurements have shown that the actual absolute horizontal accuracy r.m.s. is the range of ±1m not exceeding ±2m. This horizontal accuracy can be achieved without the use of any survey ground control but with complete reliance on on-bard differential GPS and IMU- measurements. However, we use up to 4 control points per 1°-cell for reasons of quality assurance and to avoid vertical bias which could affect vertical accuracy of the DSM. Vertical accuracy of the DSM is found to be within ± 1 m.
Throughput and productivity have not been limited by compute power or by human labor, but by the rate at which aerial imagery can be acquired. The IPF processing environment is capable of processing the entire imagery harvest of a whole year worth of flying in about one week. Given the current levels of quality control and inspection the annual production rate per person is between 300,000 and 400,000 km2. With only minor changes to the product specifications this rate could be increased even further. For example, applying “Standard” quality specifications to high population areas [see Table 1] would almost entirely eliminate the need for manual QC. The Global Ortho Program’s scale and aggressive timeline have triggered a number of innovations in hardware, software, logistic, processing and more. Many of these innovations are now being introduced in other BITs projects and will find their way into new generations of UltraCam sensors, UltraMap software [Reitinger et al., 2012], and Microsoft photogrammetry tools.
11. Outlook
Completion of the initial coverage for the US and Western Europe was originally expected for the early fall of 2012, thus within 30 months from kick off in March 2010. However, already starting in the summer of 2012, we also expect to begin a new project addressing updates of select areas on an as-needed basis. The main focus of Bing Maps is to extend the coverage footprint of the Global Ortho Program. This will, at least in part, be done in close cooperation with external partners. At the time of this writing several national and international organizations have engaged in talks about expanding Global Ortho into their areas of interest.
While this project explores potentials with most advanced computing architectures, algorithms, sensors and procedures, we all know that what is “most advanced” today, will be widely available tomorrow. Therefore such a project is a preview of
Hirschmueller, H. (2005): Accurate and efficient stereo processing by semi-global matching and mutual information. Proceedings of the IEEE Conference on Computer Vision and Pattern Recognition, pp. 807-814
Hirschmueller, H. (2008): Stereo vision in structured environments by consistent semi-global matching. IEEE Transaction on Pattern Analysis and Machine Intelligence PAMI 30 (2) pp. 328-341. International Archives of the Photogrammetry, Remote Sensing and Spatial Information Sciences, Melbourne, Australia. Reitinger B. (2012) UltraMap V3 – A Revolution in Aerial Photogrammetry. International Archives of the Photogrammetry, Remote Sensing and Spatial Information Sciences, Melbourne, Australia.