Summary Fluxes of water and carbon dioxide from short-ro-tation Salix viminalis L. were measured at leaf, tree and stand scales using porometer, chamber and micrometeorological techniques, respectively. At all three scales, instantaneous water use efficiency exhibited a similar dependence on vapor pressure deficit (δe) with values of 21, 13 and 10 g CO2 per kg H2O for δe of 0.5, 1.0 and 1.5 kPa, respectively. The fluxes of CO2 and H2O plotted against incident light above the stand differed in magnitude according to scale, with highest and lowest values being obtained for leaf- and stand-level measure-ments, respectively. At the tree level, the fluxes of CO2 and H2O reflected the social position of the sample trees with the domi-nant tree having higher values than the subdomidomi-nant tree. Average long-term water use efficiency, estimated from stand-level measurements, was 6.3 g dry biomass per kg of transpired water. This value is high compared with values for other tree species and may be associated with a high foliar nitrogen concentration. We conclude that water availability will be a critical factor in short-rotation willow forestry despite the relatively high water use efficiency of the species.
Keywords: CO2 fluxes, micrometeorology, open-top chamber, short-rotation forestry, transpiration.
Introduction
There is increasing interest in fast-growing short-rotation wil-low forestry. In 1994, about 12,000 ha of farmland was under short-rotation willow cultivation in southern Sweden, and the land area used for short-rotation forestry is increasing at an annual rate of 2000--3000 ha. The profitability of such cultiva-tion is highly dependent on the annual yield of wood. In southern Sweden, the addition of fertilizers is economically viable, but the use of irrigation is not. Therefore, willow plantations have to rely on precipitation. In southern Sweden, precipitation during the growth season varies between 350 and 550 mm (Eriksson 1992) except for a narrow belt along the west coast where it reaches 750 mm, which implies that water availability may be a crucial growth factor at many willow sites. It is therefore important to determine the water demands of willow and how water uptake is related to growth.
Informa-tion on the relaInforma-tionship between uptake of carbon dioxide and uptake of water will also increase our understanding of the interaction between the biosphere and the hydrosphere.
Water use efficiency, which is a useful parameter because it appears to be a conservative plant (species) property (e.g., Tanner and Sinclair 1983), is usually defined as the ratio of dry matter production to total evaporation or to transpiration only. Water use efficiency is considered instantaneous when it refers to the ratio of net fluxes of carbon dioxide and water vapor.
Lindroth et al. (1994) found large seasonal variation in leaf-level water use efficiency of willow which they attributed to variation in allocation. Cienciala and Lindroth (1995b) analyzed tree-level water use efficiency of willow based on direct measurements of fluxes of water and carbon dioxide and concluded that instantaneous water use efficiency is primarily a function of vapor pressure deficit (cf. Bierhuizen and Slatyer 1965). However, no attempt was made to determine the effects of scale on the fluxes of carbon dioxide and water, and so it is not known whether the results obtained at the leaf or tree level can be extrapolated to the stand level. Therefore, we have analyzed fluxes of carbon dioxide and water measured at the leaf, tree and stand levels to quantify water use efficiency of willow.
Material and methods Site and stand
Measurements were made in mid-September 1990 (leaf level) and summer 1992 (tree and stand levels) from a short-rotation stand situated at Ultuna (59.3° N, 17.4° E, altitude 5--6.5 m), near Uppsala, Sweden. The stand was planted in 1984 with two Salix viminalis L. plants (cuttings) per square meter on a clay soil. The cuttings were taken from Clone 77-683, which was later found to comprise a mixture of at least two clones (Ver-wijst 1990). The plot was approximately rectangular in shape, 225 m long in the north--south direction, and 125 m wide in the east--west direction. From June to September during each year, except in 1991, the stand was irrigated and fertilized daily with a drip irrigation system. In 1990, total irrigation was 66 mm, and the total supply of nitrogen was 102 kg ha−1. The
corre-Water use efficiency of short-rotation
Salix viminalis
at leaf, tree and
stand scales
ANDERS LINDROTH and EMIL CIENCIALA
Swedish University of Agricultural Sciences, Department of Ecology and Environmental Research, Section of Biogeophysics, Box 7072, S-750 07 Uppsala, Sweden
Received March 2, 1995
sponding values in 1992 were 327 mm and 50 kg ha−1, respec-tively. The fertilization and irrigation regime resulted in plants with a high nutrient status: foliar nitrogen concentrations were typically 3--4% during the season (e.g., Rytter and Ericsson 1993). The stand was cut in January 1987 and February 1991. Leaf- and tree-level measurements were made about 50 m south of the mast from which the micrometeorological meas-urements were made.
The growing season (threshold 5 °C) at Ultuna normally lasts from mid-April to the end of October. The mean (1931--1960) annual air temperature is 5.8 °C and mean annual pre-cipitation (not corrected for wind-induced, evaporation and adhesion errors) is 554 mm.
Biometric measurements
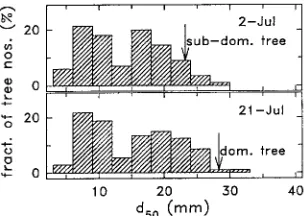
Stem diameters at a height of 0.5 m of about 200 randomly selected trees were measured at 2--3-week intervals during the growing season on a subplot surrounding the chamber trees. Stem diameter distributions for July 2 and July 21 are shown in Figure 1. Stem diameters of the measured trees showed a bimodal distribution as a result of the large numbers of sup-pressed and dying trees (Cienciala and Lindroth 1995a). The leaf areas of a subsample of 3--4 trees were measured destruc-tively with a leaf area meter (LI-3000, Li-Cor Inc., Lincoln, NE) at the same time as the diameter measurements were made. All leaves were removed from the sample trees, and leaf area (LA) to dry weight ratios were determined after drying for 1 week at 80 °C. Total leaf area was determined from the total leaf dry weight per tree. A relationship between stem diameter and LA was then determined and used to estimate the LA of the chamber trees at the beginning of the enclosure period (Cienciala and Lindroth 1995a). At the end of the enclosure period, the LA of the chamber trees was measured destruc-tively with a leaf area meter, and the LA increment during the chamber enclosure period was obtained by linear interpola-tion. The leaf area per unit of ground area at the end of July was supplied by T. Verwijst (Swedish Univ. Agric. Sci., Uppsala, personal communication).
Leaf flux measurements
Leaf-level fluxes of water and carbon dioxide were measured on intact leaves on September 12--14, 1990, with a porometer
(LCA2, ADC, Hoddesdon, Herts, U.K.) equipped with a 20 × 50 mm PLC chamber. Measurements were made on randomly selected, fully developed leaves located about 50 cm from the tops of the trees. The leaves were held in a horizontal position during measurement, which typically took less than 1 min per sample. Because the S. viminalis leaves, which are about 200 × 15 mm, did not fit inside the chamber, the leaf area of each sample was estimated as an average width of the part enclosed in the chamber times the chamber length. All leaf-level data are average values of measurements made on two to three samples within a 3-min period.
Tree flux measurements
Tree-level measurements of water and carbon dioxide fluxes have been described in detail by Cienciala and Lindroth (1995a, 1995b). Briefly, transpiration and assimilation of whole trees were measured in a ventilated open-top chamber, completely enclosing the crown of one tree. The circular cham-ber, 4 m tall and 0.4 m in diameter, was covered with transpar-ent polyethylene foil. Air was vtranspar-entilated from the top, down through the chamber at a constant rate of 0.063 m3 s−1 corre-sponding to an average wind speed of 0.5 m s−1 within the chamber. Typical wind speed during the daytime at 1 m above the stand was 2 m s−1. Because wind speed decreases down-ward through the canopy, a ventilation rate of 0.063 m3 s−1 was considered to be representative of average conditions. The effects of the chamber on the climate inside were relatively small (Cienciala and Lindroth 1995a, 1995b).
To measure the water and carbon dioxide concentration of the air before and after it had passed the crown, air was drawn continuously through two 8-mm diameter polyethylene tubes to an LI-6262 gas analyzer (Li-Cor Inc.). The flow rate in the sample tubes was 1 liter min−1, and it took 15 s for the air to reach the gas analyzer. A complete set of measurements of the concentration differences took 10 min. During this period, the sample air was switched after 5 min, so that air previously leading to the sample channel was now directed to the refer-ence channel and vice versa. Switching was done by solenoids controlled by the datalogger. In this way, errors caused by an offset in the calibration of the gas analyzer were substantially reduced. Calculations were performed as described by Cien-ciala and Lindroth (1995a, 1995b).
Chamber studies were performed on one subdominant tree (July 4--5) and one dominant tree (July 24--26) (see Figure 1).
Stand flux measurements
Stand-level fluxes of carbon dioxide and water were estimated from measured gradients, net radiation and energy storage. The mast used for the gradient measurement was positioned about 90 m from the northern edge and 50 m from the eastern edge of the stand. For measurements of temperature, humidity and carbon dioxide gradients, an interchange system was used. Temperature and humidity measurements were made as de-scribed by Lindroth and Halldin (1990).
In the basic interchange system, two pairs of sensor units were used at consecutive height intervals to allow calculation of the Bowen ratio at two levels. The height difference for each
pair of sensor units was 75 cm. The lowest measurement level was normally 10--20 cm above the top of the highest shoots in a nearby area surrounding the mast. The measurement levels were adjusted successively as the stand increased in height. Air inlets for measurement of carbon dioxide differences were installed at the two lowest interchange levels. Air was drawn from the inlets through 10-m long × 8-mm diameter polyeth-ylene tubing to an LI-6262 gas analyzer at a flow rate of 1 liter min−1. The analyzer was used in differential mode, and be-cause the inlets were interchanged once during each 10-min measurement cycle, the offset in the differential measurement was effectively zero. The sensors were connected to a data logger (CR-21X, Campbell Scientific, Logan, UT) which also controlled the reversal of the sensors every 5 min.
Net radiation was measured with a Bruno Lange LXV055 net radiometer, mounted at the end of a 2-m long boom extend-ing horizontally from the top of the ladder. Soil heat flux was measured at two places by heat flux plates at 10 cm depth. Heat storage between the soil surface and 10 cm depth was esti-mated by the calorimetric method from soil temperature meas-urements, assuming that the irrigated soil was at field capacity. A detailed description of the estimation of evaporation based on the Bowen ratio method is given by Lindroth and Iritz (1993) and only the part that concerns estimation of carbon dioxide fluxes is outlined here.
By combining the equations for energy balance and flux gradient relationships for heat and water, the turbulent diffu-sion coefficient, K, can be expressed as:
K= Rn−S ρ(cp∂θ/∂z+λ∂q/∂z)
, (1)
where Rn is net radiation, S is soil heat flux, ρ is air density, cp is specific heat of air at constant pressure, ∂θ/∂z is the potential temperature gradient, λ is latent heat of vaporization of water, and ∂q/∂z is the specific humidity gradient. It is assumed here that the turbulent diffusion coefficients are similar for heat, water and carbon dioxide. The flux of carbon dioxide, Fc, was estimated as:
Fc=ρK∂C/∂z, (2)
where ∂C/∂z is the carbon dioxide weight fraction gradient. Water use efficiency was then estimated as the quotient of half hourly carbon dioxide to water vapor fluxes. Measurements were made from the beginning of June to mid-October.
Flux measurements from small fields are inherently difficult because of the limited fetch. However, Iritz and Lindroth (1995) concluded that, if the gradients are measured within the so-called constant flux layer, the depth of which is mainly a function of distance from the leading edge and surface rough-ness, the measured fluxes are adequately representative of the short-rotation forest despite the short fetch.
Results and discussion
Instantaneous water use efficiency, WUEi
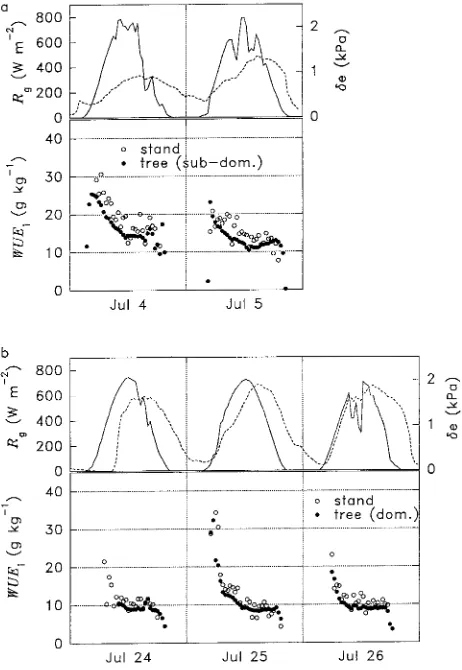
Diurnal variation in WUEi was similar at both the tree and stand levels (Figures 2a and 2b), and was slightly higher in the morning than in the afternoon. Instantaneous water use effi-ciency estimated from stand fluxes was slightly larger than WUEi estimated from tree fluxes as a result of a difference in the vapor pressure deficit of the stand and the tree chamber. (Vapor pressure deficits refer to local conditions, i.e., within-chamber conditions for leaf- and tree-level measurements and ambient conditions for stand-level measurements.) The tem-perature in the tree chamber was typically about 1 °C above ambient (Cienciala and Lindroth 1995b), resulting in a higher vapor pressure deficit in the tree chamber and thus a lower WUEi than in the stand. The nonsymmetrical diurnal pattern of WUEi was also explained by the dependence on vapor pressure deficit. The vapor pressure deficit curve was similar to the temperature curve, i.e., the maximum was normally reached
several hours after noon.
Instantaneous water use efficiency was fairly constant dur-ing the middle of the day with typical noon values of 12--15 g kg−1 for July 4--5 and slightly lower values of 8--12 g kg−1 for July 24--26 as a result of higher vapor pressure deficits at the end than at the beginning of the month (Figures 2a and 2b). In July, the leaf area index was high, close to 7, and so water and carbon dioxide fluxes from the soil surface were probably negligible compared with those from the canopy, which ex-plains the relative consistency between the tree-level and stand-level data.
At solar irradiances above 50 W m−2, WUE
i showed a similar dependence on vapor pressure deficit at the leaf, tree and stand scales; it decreased rapidly with increasing vapor pressure deficit up to about 1 kPa followed by a slower de-crease at higher vapor pressure deficits (Figure 3). This behav-ior is in good agreement with the theory that water use efficiency is proportional to the inverse of vapor pressure deficit (Bierhuizen and Slatyer 1965). Among scales, WUEi values were remarkably similar at a particular vapor pressure deficit, although the scatter was largest for the leaf-level val-ues. These results emphasize the importance of specifying the environmental conditions under which a certain value of water use efficiency is determined (Lindroth and Cienciala 1995).
Water and carbon dioxide fluxes
The responses of carbon dioxide and water fluxes per unit of leaf area to incident light above the canopy are shown in Figure 4. The fluxes of carbon dioxide per unit of leaf area were highest at the leaf level and lowest at the stand level. The likely reason for these differences is that fluxes were plotted against incident and not intercepted light. Incident light is most representative of the conditions under which the leaf-level measurements were made, whereas it is least representative of the conditions under which the stand-level measurements were made. It was not possible to plot the fluxes against intercepted light because the necessary information about leaf distribu-tions was not available
The dominant and subdominant sample trees had leaf areas
of 1.6 and 1.8 m2, respectively, compared with the stand-aver-age leaf area of about 7 m2 per unit of ground area and a density of about 12 trees per m2. Thus, most trees must have had much lower water and carbon dioxide fluxes per unit leaf area than the dominant and subdominant trees in order for the commu-nity to conform to the stand values. We conclude that the dominant trees are very competitive and account for the major part of the fluxes (cf. Èermák and Kuèera 1987, 1990, Köstner et al. 1992). These results illustrate the difficulties associated with scaling up from leaf to tree to stand level (cf. Leverenz et al. 1982). When scaling from the tree to stand level, attempts have been made to minimize errors caused by variations in foliage distribution and leaf type (i.e., shade versus sun leaves) along the vertical axes of individual trees by introducing a complex scaling parameter, e.g., Èermák (1989) used the solar leaf equivalent area.
Long-term water use efficiency
The dependency of water use efficiency on vapor pressure deficit complicates the interpretation of water use efficiency values with respect to the relationship between biomass pro-duction and water uptake. More representative values of WUE,
Figure 3. Leaf-, tree- and stand-level instantaneous water use effi-ciency (WUEi) versus vapor pressure deficit (δe).
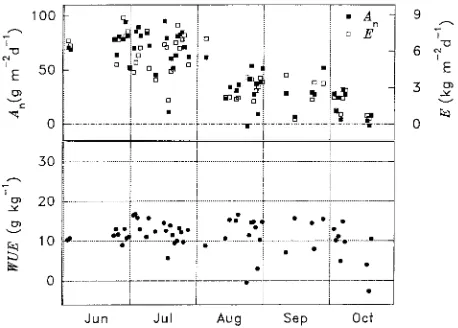
i.e., long-term WUE (WUEl), can be calculated if the fluxes of carbon dioxide and water are integrated over time periods that are long enough to include respiration losses, e.g., 24 h. Long-term WUE was relatively constant over the season (Figure 5) with an average value (± SD) of 11.3 ± 4.1 g kg−1. Variation increased when fluxes were small, and there were days with negative fluxes of carbon dioxide and negative water use efficiencies. Summation of fluxes over the whole season, based on the data in Figure 5, gave a water use efficiency of 11.5 g kg−1, which is slightly larger than the average of the daily values. Assuming that all of the net carbon dioxide flux is fixed in organic compounds, this value corresponds to 6.3 g dry biomass per kg of water transpired.
There are few published data of long-term water use effi-ciency. Most of the reported WUEl values are in incompatible units, and information about nitrogen status is not available. Nitrogen status is important because foliar nitrogen concentra-tion affects assimilaconcentra-tion and maximum stomatal conductance (Schulze et al. 1994). The willow plants used in this study had high foliar nitrogen concentration, and this may explain why we obtained a WUEl as high as 6.3 g kg−1 (cf. Lindroth et al. 1994, Cienciala and Lindroth 1995b) compared with pre-viously published values of 2.9 to 5.9 g kg−1 for a range of tree species (Polster 1950), 2.5 g kg−1 for oak (Èermák et al. 1991) and 4.8 g kg−1 for spruce (Cienciala et al. 1994).
It has been estimated that an annual production of 10--12 Mg of dry stemwood per ha is required to make the short-rotation cultivation of willow profitable. This amount of production would require a leaf production of about 4--5 Mg ha−1 and a root production of 4--6 Mg ha−1 (R. Rytter, Swedish Univ. Agric. Sci., Uppsala, personal communication), i.e., a total annual production of about 18--23 Mg ha−1. Based on a water use efficiency of 6.3 g kg−1, we calculated that this production rate corresponds to the transpiration of 286--365 mm of water. Persson and Lindroth (1994) estimated that, on average, tran-spiration constituted about 66% of total evaporation for short-rotation willow forests. Accordingly, 430--555 mm of water must be available for evaporation to achieve a total annual
production of 18--23 Mg ha−1. Because the average precipita-tion during the growing season is 350--550 mm in southern Sweden and precipitation is not ideally distributed according to plant demands, we conclude that water will be a crucial factor in determining the profitability of short-rotation willow forestry in southern Sweden.
Acknowledgments
This work was supported by grants from the Swedish National Science Research Council (S-AA/FO 09382-324, G-GU 09382-321) and by the Swedish National Board for Industrial and Technical Develop-ment. Emil Cienciala acknowledges a travel grant from the Swedish Council for Forestry and Agricultural Research. Finally, we warmly thank Prof. Jan-Erik Hällgren for his assistance with the porometer measurements.
References
Bierhuizen, J.F. and R.O. Slatyer. 1965. Effects of atmospheric con-centration of water vapor and CO2 in determining transpiration--photosynthesis relationships of cotton leaves. Agric. Meteorol. 2:259--270.
Èermák, J. 1989. Solar equivalent leaf area: an efficient biometrical parameter of individual leaves, trees and stands. Tree Physiol. 5:269--289
Èermák, J. and J. Kuèera. 1987. Transpiration of fully grown stands of spruce (Picea abies (L.) Karst.) estimated by the tree-trunk heat balance method. In Forest Hydrology and Watershed
Measure-ments. IAHS Publ. No.167, Vancouver, B.C., Canada, pp 311--317. Èermák, J. and J. Kuèera. 1990. Scaling up transpiration data between
trees, stands and watersheds. Silva Carelica 15:101--120.
Èermák, J., J. Kuèera and M. Stepankova. 1991. Water consumption of full-grown oak (Quercus robur L.) in a floodplain forest after the
secession of flooding. In Floodplain Forest Ecosystem, Vol. II. Eds.
M. Penka, M. Vyskot, E. Klimo and F. Vasicek. Elsevier, Amster-dam, Oxford, New York, Tokyo, pp 397--417.
Cienciala, E. and A. Lindroth. 1995a. Gas-exchange and sap flow
measurements of willow trees in short-rotation forest. I. Transpira-tion and sap flow. Trees 9:289--294
Cienciala, E. and A. Lindroth. 1995b. Gas-exchange and sap flow
measurements of willow trees in short-rotation forest. II. Diurnal and seasonal variation of stomatal response and water use effi-ciency. Trees 9:295--301.
Cienciala, E., A. Lindroth, J. Èermák, J-E. Hällgren and J. Kuèera. 1994. The effects of water availability on transpiration, water poten-tial and growth of Picea abies during a growing season. J. Hydrol.
155:57--71.
Eriksson, B. 1992. Klimat. In Jordbruket----Sveriges Nationalatlas. Eds. Å. Clason and B. Granström. SNA Förlag, Stockholm, pp 14--21.
Iritz, Z. and Lindroth, A. 1995. Energy partitioning in relation to leaf area development of short rotation willow coppice. Agric. For. Meteorol. In press.
Köstner, B.M.M., E.-D. Schulze, F.M. Kelliher, D.Y. Hollinger, J.N. Byers, J.E. Hunt, T.M. McSeveny, R. Meserth and P.L. Weir. 1992. Transpiration and canopy conductance in a pristine broad-leaved forest of Nothofagus----an analysis of xylem sap flow and eddy
correlation measurements. Oecologia 91:350--359.
Leverenz, J., J.D. Deans, E.D. Ford, P.G. Jarvis, R. Milne and D. Whitehead. 1982. Systematic spatial variation of stomatal conduc-tance in a Sitka spruce plantation. J. Appl. Ecol. 19:835--851. Figure 5. Bottom: Stand-level long-term water use efficiency (WUEl),
Lindroth, A. and E. Cienciala. 1995. Measuring water use efficiency of eucalypt trees with chambers and micrometeorological tech-niques----comment. J. Hydrol. 169:281--283.
Lindroth, A. and S. Halldin. 1990. Gradient measurements with fixed and reversing temperature and humidity sensors above a thin forest. Agric. For. Meteorol. 53:81--104.
Lindroth, A. and Z. Iritz. 1993. Surface energy budget dynamics of short-rotation willow forest. Theor. Appl. Clim. 47:175--185. Lindroth, A., T. Verwijst and S. Halldin. 1994. Water-use efficiency of
willow: variation with season, humidity and biomass allocation. J. Hydrol. 156:1--19.
Persson, G. and A. Lindroth. 1994. Simultaneous evaporation from short-rotation forest: variations within and between seasons. J. Hydrol. 156:21--45.
Polster, H. 1950. Die Physiologischen Grundlagen der Stofferzeugung im Walde. Bayericher Landwirtschaftsverlag Gmbh, München, pp 96.
Rytter L. and T. Ericsson. 1993. Leaf nitrogen analysis in Salix viminalis (L.) forest stands growing on agricultural land. Z.
Pflan-zenernähr. Bodenk. 156:349--356.
Schulze E.-D., F.M. Kelliher, C. Körner, J. Lloyd and R. Leuning. 1994. Relationships among maximum stomatal conductance, eco-system surface conductance, carbon assimilation rate, and plant nitrogen nutrition: a global ecology scaling exercise. Annu. Rev. Ecol. Syst. 25:629--660.
Tanner, C.B. and T.R. Sinclair. 1983. Efficient water use in crop production: research or re-search? In Limitations to Efficient Water
Use in Crop Production. Eds. H.M. Taylor, W.R. Jordan and T.R. Sinclair. Am. Soc. of Agron., Madison, WI, pp 1--27.
Verwijst, T. 1990. Clonal differences in the structure of a mixed stand of Salix viminalis in response to Melampsora and frost. Can. J. For.