Indonesian economic outlook in the
midst of global challenges
Muhammad Chatib Basri
Harvard Kennedy School
and
Short term problems:
macroeconomic stability
The macroeconomic impact of the global volatility
3
The Fed
interest
rate hike
Risk of
capital
outflow
Risk of assets
re pricing
Exchange rate
depreciation
Improve trade
balance
or
Deteriorate trade
balance
Slow
down of
China
Declining
commodity
price
Wealth effect
Slow down
growth
Bank Indonesia: interest rate ↑
Govt tighten fiscal
Bank Indonesia: lower interest
rate
Govt: Expand fiscal
Imported
inflation
Solution
:
FDI export oriented ↑ →
BoP +
Declining
oil price
Government
Revenue
Problem in
Euro and
-10
-5
0
5
10
15
2005
2006
2007
2008
2009
2010
2011
2012
2013
2014
2015
GDP Growth
(Countries, annual, 2015 data is q1 data, percent, last data in the bracket)
Source: CEIC, World Bank
Indonesia (4.71)
China (7.0)
India (7.51)
South Africa (1.3)
Rusia (-2.2)
Greece (0.35)
-3
-1
1
3
5
7
9
2005
2006
2007
2008
2009
2010
2011
2012
2013
2014
2015
GDP Growth
(ASEAN countries, annual, 2015 data is q1 data, percent, last data in the bracket)
Source: CEIC, World Bank
Thailand (3.04)
Indonesia (4.71)
Vietnam (6.13)
Philippines (5.16)
GDP Growth
4,4
4,5
4,6
4,7
4,8
4,9
5
5,1
5,2
-6
-4
-2
0
2
4
6
8
Mar, 2014 Apr, 2014 Mei, 2014 Jun, 2014 Jul, 2014 Agu, 2014 Sep, 2014 Okt, 2014 Nov, 2014 Des, 2014 Jan, 2015 Feb, 2015 Mar, 2015
GDP Growth
Private Cons
Govt Exp
Inv
Export
Import
GDP
GDP Growth
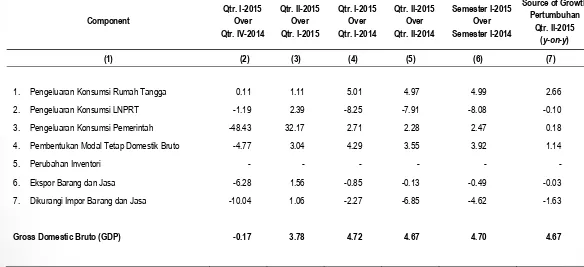
[image:8.720.40.624.207.474.2]8
Table 5
Growth Rate of GDP By Expenditure Base Year 2010
(percent)
Component
Qtr. I-2015
Over
Qtr. IV-2014
Qtr. II-2015
Over
Qtr. I-2015
Qtr. I-2015
Over
Qtr. I-2014
Qtr. II-2015
Over
Qtr. II-2014
Semester I-2015
Over
Semester I-2014
Source of Growth
Pertumbuhan
Qtr. II-2015
(
y-on-y
)
(1)
(2)
(3)
(4)
(5)
(6)
(7)
1.
Pengeluaran Konsumsi Rumah Tangga
2.
Pengeluaran Konsumsi LNPRT
3.
Pengeluaran Konsumsi Pemerintah
4.
Pembentukan Modal Tetap Domestik Bruto
5.
Perubahan Inventori
6.
Ekspor Barang dan Jasa
7.
Dikurangi Impor Barang dan Jasa
Gross Domestic Bruto (GDP)
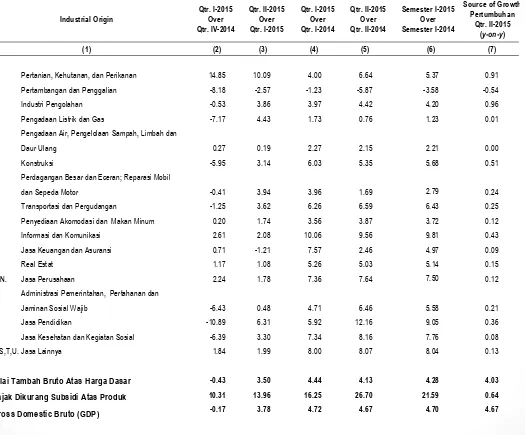
9
Table 2
Growth Rate of GDP By Industrial Origin Base Year 2010
(percent)
Industrial Origin Qtr. I-2015 Over Qtr. IV-2014 Qtr. II-2015 Over Qtr. I-2015 Qtr. I-2015 Over Qtr. I-2014 Qtr. II-2015 Over Qtr. II-2014 Semester I-2015 Over Semester I-2014Source of Growth Pertumbuhan
Qtr. II-2015 (y-on-y) (1) (2) (3) (4) (5) (6) (7)
A. Pertanian, Kehutanan, dan Perikanan B.
Pertambangan dan Penggalian C.
Industri Pengolahan
D.
Pengadaan Listrik dan Gas
E.
Pengadaan Air, Pengelolaan Sampah, Limbah dan Daur Ulang
F.
Konstruksi
G.
Perdagangan Besar dan Eceran; Reparasi Mobil dan Sepeda Motor
H.
Transportasi dan Pergudangan
I.
Penyediaan Akomodasi dan Makan Minum J.
Informasi dan Komunikasi
K.
Jasa Keuangan dan Asuransi L.
Real Estat
M,N. Jasa Perusahaan
O.
Administrasi Pemerintahan, Pertahanan dan Jaminan Sosial Wajib
P.
Jasa Pendidikan
Q.
Jasa Kesehatan dan Kegiatan Sosial R,S,T,U.Jasa Lainnya
Nilai Tambah Bruto Atas Harga Dasar
Pajak Dikurang Subsidi Atas Produk
Gross Domestic Bruto (GDP)
Source:
CEIC
0
2
4
6
8
10
12
14
16
18
20
6
8
10 12
2
4
6
8
10 12
2
4
6
8
10 12
2
4
6
8
10 12
2
4
6
8
10 12
2
4
6
8
2010
2011
2012
2013
2014
2015
Inflation
(yoy growth, percent)
Group Spending
CPI
Jul 2015
CPI
Aug 2015
MOM
Jul 2015
MOM
Aug 2015
YOY
Aug 2014
YOY
Jul 2015
YOY
Aug 2015
Contr
Headline
121.26
121.73
0.93
0.39
3.84
7.26
7.18
7.18
1 Foodstuff
130.57
131.38
1.95
0.62
1.07
8.25
8.60
1.45
2
Food, beverages, cigarettes and
tobacco
122.59
123.27
0.51
0.55
6.30
7.83
7.91
1.27
3 Housing, water, electricity, and fuel
119.38
119.65
0.18
0.23
5.97
7.94
7.30
1.19
4 Clothing
109.16
109.20
0.41
0.03
4.40
3.34
3.12
0.50
5 Health
115.71
116.49
0.53
0.67
4.96
6.25
6.58
0.97
6 Education, recreation and sport
110.27
111.63
0.30
1.23
3.80
3.82
4.24
0.48
7
Transportation, communication and
finance
116.87
116.78
0.73
-0.07
1.66
7.99
7.92
1.31
CPI by Expenditure
-1
0
0
1
0
2
0
3
0
4
0
5
0
No
Type of Tax
2014
Realization
Revised 2105
State Budget
Target
Δ%
(2014-2015)
Δ%
(2014-2015)
2014 as of July
31
2015 as of
July 31
A
Non Oil and Gas Income Tax
(PPh)
458,692.28
629,835.35
37.31 258.486,23 293.521,34
13.55
B
.
VAT and Luxuries
taxes
408.995,74
576.469,17
40,95
216,137.27 202.701,81 (6,22)
C
Land taxes
23.475,71
26.689,88
13,69
1,049.73
558,07
(46,84)
D Oil and gas taxes
87.446,35
49.534,79
(43,35)
51,876.00
31.375,54
(39,52)
E
Total A+B+C+D
897.456,86
1.244.723,88
38,69
479,001.27 499.738,89 4,33
F
Total A+B+C+D+E
984.903,21
1.294.258,67
31,41
530,877.27 531.114,43 0,04
Tax Revenue realization as of July 31
st
,
0
2
0
0
4
0
0
6
0
0
8
0
0
1
0
0
0
1
2
0
0
1
4
0
0
Jun-00
Mei-01
Apr-02
Mar-03
Feb-04
Jan-05
Des-05
Nov-06
Okt-07
Sep-08
Agu-09
Jul-10
Jun-11
Mei-12
Apr-13
Mar-14
Feb-15
P
a
lm
O
il
(U
S
D
o
lla
rs
p
e
r Me
tr
ic
T
o
n
)
0
2
0
4
0
6
0
8
0
1
0
0
1
2
0
1
4
0
1
6
0
Jun-00
Mei-01
Apr-02
Mar-03
Feb-04
Jan-05
Des-05
Nov-06
Okt-07
Sep-08
Agu-09
Jul-10
Jun-11
Mei-12
Apr-13
Mar-14
Feb-15
C
ru
d
e
O
il
(U
S
D
o
lla
rs
p
e
r B
a
rr
e
l)
0
5
0
0
,0
0
,2
0
,4
0
,6
0
,8
1
,0
1
,2
0
1
2
3
4
5
6
7
8
9
Source: CEIC
-5
-4
-3
-2
-1
0
1
2
3
4
5
Real Interest Rate
(Monthly, Gov.Bond 10y, %)
Indonesia
US
China
Japan
Germany
Indonesia
Russia
Brazil
South Africa
Australia
Source: CEIC
80
100
120
140
160
180
200
220
Exchange Rates
Short and long term challenges
Short term:
Potential growth is limited
--> stabilization over
growth
Medium-long term:
focus on supply constraint
Medium term and long-term
issues: how to improve
productivity
In technology: no self discovery
Source: Authors’ calculation using UN
-Comtrade data
based on SITC classification
24
Capability to undertake complex task is
still behind other middle income
countries
If products could not be
made in Indonesia, where
else can they be made?
From observed trade data,
Indonesia made progress in
improving capability to
export products requiring
more complex task (but so
does Vietnam)
Why matters? It reflects
institutional capacity and
ability to accumulate and
channel knowledge into
productive activities
25
Source: Atlas of Economic Complexity (Hausmann and Hidalgo et.al)
Not yet able to manage complex tasks?
Development challenges are beyond
macro-stability
26
Brazil
China
India
Indonesia
Malaysia
Philippines
Thailand
Vietnam
Characteristics (2013)
Population (person mn)
200.4
1,357.4
1,252.1
249.9
29.7
98.4
67.0
89.7
GDP Per Capita (in PPP, USD)
5,823
3,583
1,165
1,810
6,998
1,581
3,438
1,029
Density (person/sq km)
24.0
144.6
421.1
137.9
90.4
330.0
131.2
289.3
Real Exchange Rate Movement (%)
2003-2013 (average
68.3
31.4
-0.3
6.4
2.5
39.2
25.0
50.9
PISA Test Score (2012)
Math
391
613
351*
375
421
427
511
Science
406
580
348*
382
420
438
528
Broadband Penetration
Fixed (wired)-broadband subscriptions per
100 inhabitants (2013)
10.08
13.36
1.16
1.3
8.22
9.12
7.36
5.62
Policy anticipation
Short term
•
Increase aggregate
demand:
•
cash transfer,
•
cash for work,
•
tax incentive for
companies to keep their
workers
Medium term
•
Infrastructure
•
Human capital: Attract
FDI for technology spill
over
•
Tax incentive for R&D,
training, export oriented
sector