echnology
T
ournal of
J
Journal of Technology Education
Editor JAMES LAPORTE, Technology Education, 144 Smyth Hall, Virginia Polytechnic Institute and State University, Blacksburg, VA 24061-0432 (540) 231-8169 Internet: [email protected]
Associate Editor MARK SANDERS, Virginia Polytechnic Institute and State University
Assistant ANN HUTCHENS, Virginia Polytechnic Institute and to the Editor State University
Editorial Board SHARON BRUSIC, Virginia Polytechnic Institute and State University
DENNIS CHEEK, Rhode Island Department of Education
PATRICK FOSTER, Educational Consultant, Arizona
MARC DE VRIES, Pedagogical Technological College, The Netherlands
JAMES HAYNIE, North Carolina State University
ANN MARIE HILL, Queens University, Canada
COLLEEN HILL, Educational Consultant, Long Beach, California
THEODORE LEWIS, University of Minnesota
STEVE PETRINA, University of British Columbia, Canada
MICHAEL SCOTT, The Ohio State University
KAY STABLES, Goldsmiths University of London, England
KEN VOLK, Hong Kong Institute of Education
ROBERT WICKLEIN, The University of Georgia
JOHN WILLIAMS, Edith Cowan University, Australia
The views expressed in this publication are not necessarily those of the Editor or the Editorial Review Board, nor the officers of the Council on Technology Teacher Education and the International Technology Education Association.
Copyright, 1999, Council of Technology Teacher Education and the International Technology Education Association
Contents
From the Editor
2 Herding Cats in the Midst of the Swinging Pendulum by James E. LaPorte
Articles
5 Technology Education in the Finnish Primary Schools by Ari Alamäki
18 Identification of Quality Characteristics for Technology Education Programs: A North Carolina Case Study
by Aaron C. Clark
27 Elementary Children’s Conceptions of Structural Stability: A Three Year Study
by Brenda J. Gustafson, Patricia M. Rowell & Dawn P. Rose
45 Content or Process as Approaches to Technology Curriculum: Does It Matter Come Monday Morning?
by Theodore Lewis
60 Talking Technology: Language and Literacy in the Primary School Examined Through Children’s Encounters with Mechanisms by Eric Parkinson
Miscellany
74 Scope of the JTE Editorial/Review Process
Manuscript Submission Guidelines Subscription information
From the Editor
Herding Cats in the Midst of the Swinging Pendulum
Historians adamantly adhere to the notion that the best way to understand the future is through understanding the past. This is based, at least in part, on the fact that history tends to repeat itself. A corollary to this in education is the analogy of the swinging pendulum. When I began my teaching career some 33 years ago, the pandemonium that resulted from Soviet leadership in the space race, as manifested by the successful launch of the satellite Sputnik, had begun to ebb. The pendulum had started to swing away from highly structured curricula, based to a large extent on behaviorist theory. It also began swinging away from the concomitant emphasis on mathematics and science.
As the pendulum continued its cyclical journey past the midpoint, emphasis was increasingly placed on a more flexible form of education, perhaps in some respects a reincarnation of the original ideals of a liberal education; that is, an education that liberates the mind from the toil of everyday life. The emphasis was on the humanities and social sciences. Personal development, creativity, and self-expression were highly regarded. The leisure time purpose of industrial arts that some thought was the most significant impediment to a legitimate and defensible curriculum, grew in prominence and acceptance.
In many forward-looking schools, students were given the opportunity to custom-design their own educational experiences by selecting from a menu of “modular” courses of varying lengths that would best meet their personal interests. “Open” school designs, in which there were no walls separating classes, were constructed. Due to lofty idealism that was not properly tempered by practical reality, the pendulum began to swing the other way. It was
accelerated by the poor performance of United States students on internationally standardized tests in mathematics and science. This led to, among other things, an emphasis on standards of learning and achievement test performance.
The pendulum has probably not yet reached the full extent of its swing toward a highly structured, accountability-driven curriculum. Elective courses in art and music are still struggling for enrollment, for example. But if we believe in the tenets of historians, in due time the pendulum will reverse its direction and begin, once again, its inevitable travel in the opposite direction.
consensus on the most effective ways in which to use computers for teaching and learning.
Technology education has embraced computer use in a variety of different ways, arguably with more divergence than any other subject in the school. Computers have most certainly enabled us to do a variety of new and exciting things that we have never been able to do before; they are interactive and “hands-on.” For many of the other subjects in the school, computers have resulted in a more active and individualized learning environment. But from a relative perspective, computers in technology education have resulted in a more sedentary, passive experience for students. For example, computers play a pivotal role in nearly all of the modular programs that are sweeping across the U.S. and other countries as well. In many of these programs, the students remain largely seat-bound for the majority of the instructional time. In this issue, Gustafson, Rowell, and Guilbert describe the perceptions that elementary students have about structures. The technology now exists that enables students to design, build, and test such structures in the virtual reality of the computer without ever leaving their seats. “Activities” of the past are rapidly becoming “passivities.”
The excitement that has resulted from the use of computers is refreshing and engaging. But the dynamics of the change causes one to ponder. As we continue to discard the tools that we used in the past in favor of computers, are we ignoring some of the fundamental developmental needs of the students we serve? Is there something to the hesitancy in curriculum change that the teachers in Finland exhibited, as reported by Alamaki in this issue? Have we put
technological content in such a primal position that we are ignoring process, the dichotomy that Lewis addresses herein? Is there something very unique that occurs developmentally when students work with real tools and materials? Are such experiences tantamount to successful, meaningful problem solving, as Atkinson’s (1999) work in the last issue suggests? Could it be that those experiences contribute significantly to the development of the individual, but have virtually nothing to do with technology education as we have defined it nor the outcomes we think we are achieving? And if all of this is true, is there an age at which such activity is no longer appropriate?
Some wag might one day soon think about how sedentary life has become with the proliferation of the computer into every aspect of our existence, from school to the work place, from religion to entertainment. That person might think about the unique sense of satisfaction that comes from creating something with one’s own hands, and that this is a fundamental need of humans. That person might further become concerned about how people spend their leisure time in this electronic age. As history repeats itself, the wag might even reinvent the other six Cardinal Principles of Secondary Education (1918) without even realizing it!
how many cats we can take with us on that swinging pendulum. We have to decide which ones we will choose. We may decide to continue to leave in the closet the cats representing worthy leisure time activity, psychomotor skill development, consumer literacy and other vestiges of our past. But one way or another, someone will see to it that all the cats will somehow get to the other side as the pendulum swings.
References
Commission on the Reorganization of Secondary Education of the National Education Association (1918). Cardinal Principles of Secondary Education. Washington, DC: U. S. Government Printing Office, 7-16.
Atkinson, E. S. (1999). Key factors influencing pupil motivation in design and technology. Journal of Technology Education, 10(2), 4-26.
Articles
Technology Education in the
Finnish Primary Schools
Ari Alamäki
Introduction
Technology Education in Primary School
This study focuses on the practices and potential of technology education in Finnish primary schools, where technology education is a compulsory school subject. As in many other countries, the content of technology education is currently being discussed and debated in Finland. For example, Autio (1997), Kananoja (1997), Kankare (1997), Kantola (1997), Lind (1996), and Parikka and Rasinen (1993) argue in their studies that more up-to-date technological content is needed.
Finland has a long tradition of teaching practical school subjects. Since 1866, educational handwork (sloyd) has been a compulsory school subject for both boys and girls (Kantola, 1997). Finnish technology education, called “technical work” in the national curriculum guidelines, is a school subject in which pupils design and make products by using different materials, machines, processes, techniques and tools (e.g. Kankare, 1997). This emphasis on designing and making is an essential part of Finnish technology education. It is believed that such experiences develop pupils’ knowledge, personal qualities, and psychomotor skills (Peltonen, 1995; Suojanen, 1993). As with the traditional (sloyd) programs that preceded it, there is general belief that the design and build approach used in contemporary technology education programs enhances the pupils’ creativity, dexterity, diligence, initiative, problem solving, self-image, and preparation for work.
As technology education has evolved in Finland, more content has been introduced, including such areas as electricity, electronics, machinery, and computers. Construction kits for teaching control technology have also been adopted. In addition, technology education classes now offers pupils the opportunity to service and repair their bicycles, mopeds, and other technical equipment. These areas, combined with the more traditional sloyd (craft and design), have made Finnish technology education more diverse than in other Scandinavian countries.
____________________________
In informal discussions among teachers and teacher educators, there seems to be a general feeling that technology education in Finnish primary schools is out of date, emphasizing older technological processes such as the making of wooden and metal items. Even though technology education has been updated to an extent, there is a general feeling that there should be more connection to the modern technological world than that which exists presently. The technological concepts of communication, construction, energy, manufacturing, and
transportation are rarely reviewed from ecological, economical, cultural, and social viewpoints. The activities in which the pupils are engaged determine the kinds of technological knowledge and processes they learn. These activities must therefore be upgraded.
The Finnish School System
The Finnish comprehensive school provides compulsory basic education to pupils between the ages of 7 and 16. It is divided into a six-year lower level (grades 1-6), which corresponds internationally to primary education, and a three-year upper stage (grades 7-9), corresponding to lower secondary education. This study focused on technology education at the primary school level, where pupils are between 7 and 13 years old.
In the third grade of the primary school, it is compulsory that all pupils study technology education. After that they have to choose either technology education or textile work. As one might expect, boys usually choose the former and girls choose the latter. Pupils who have chosen technology education study it for at least two hours a week from third through sixth grades.
In Finnish primary schools, technology education is usually taught by regular classroom teachers. Today these teachers must hold a master’s degree in education and most have studied technology education as part of their teacher preparation program. A separate technology education room is provided for instruction, with an ideal maximum of 16 students in the facility at one a time.
The national curriculum reform in 1994 gave schools noticeably more freedom in developing their own curricula (Kohonen & Niemi, 1996). The national core curriculum and curricular guidelines are very vague, providing only brief outlines. Though this allows for local flexibility, it also increases the diversity in the way in which technology education is taught from one school to another. In the latest national core curriculum, the main emphasis is on the “idea-to-product” process, with the pupil fully engaged in designing
(Opetushallitus, 1994). Although, the designing and making of products remains as the central part of the national curriculum guidelines, the need for a broader technological understanding and capability is also mentioned.
Research Questions
The research questions of the study are summarized as follows:
industry, and the kinds of tasks performed by students in technology education.
2. What goals of technology education are accomplished in primary school? This question focused on the extent to which the goals of the national curriculum were being realized. This included product design-based work and the extent to which students were copying designs rather than actually developing designs themselves. Information on the teaching methods used to teach design was also investigated.
Demographic data about the age of the teacher, educational background, and teaching experience were collected so that comparisons could be made. Secondarily, this study investigated how teachers define the word technology, perceived obstacles to the development of technology education, and the ideal way in which teachers would like to view technology education.
Method
Instrument
The research questions were addressed by means of a survey instrument. The main part of the instrument was modeled after instruments used in two other technology education studies (see Alamäki, 1997; Kankare, 1997). These initial instruments were shown to be acceptably valid. There was no reason to believe that the teachers would not answer truthfully. They answered anonymously and it is plausible that they viewed the questionnaire as a way for them to contribute to the development of technology education. The majority of the questions were close-ended, requiring responses on a five-point scale with the following descriptors: “never,” “seldom,” “some extent,” “often,” “very often.” The responses were assigned numerical values from 1 (never) to 5 (very often). A few open-ended questions were also included.
Sample
The study was conducted in the Finnish provinces of Oulu and Varsinais-Suomi. The former lies in northern Finland and the latter in the southwestern region. The instrument was mailed to a sample of 300 primary schools, stratified by geographic region, in the spring of 1997. One technology education teacher at each school was selected as the contact person. At the beginning of the following school year, another copy of the questionnaire was sent to non-respondents. After these two mailings, 212 (70.7%) completed questionnaires were received. By geographic strata, 104 of the responding teachers were in city schools, 28 in provincial towns, and 80 in rural areas. The data showed that the vast majority (205) of the teachers in the study were male.
technology subject teachers, whereas the remainder of them worked as regular classroom teachers. All had studied technology education in the teacher preparation program since such study is compulsory.
Procedure
The close-ended questions were analyzed quantitatively by using frequencies and averages. Chi-square testing, one-way ANOVA and Pearson correlation analysis were also applied to selected responses. The “copying teaching method” and the “design teaching method” were compared using a dependent sample t-test. The reliability coefficients of the variables concerning the goals of teaching and the teaching method ranged between .61 and .83 and were deemed acceptable. The open-ended questions were also analyzed quantitatively by using descriptive statistics, grouping similar responses together.
Results
Practices in Technology Education
The first section of the instrument focused on the use of computers in teaching technology education now and in the future. It included two close-ended and one open-close-ended questions. Analysis revealed that 15% of the respondents had the potential of using a computer in technology education and 32% felt that they would have this potential in the near future. There was not a statistically significant difference in the potential of using a computer among cities, townships and rural areas, either presently or anticipated in the future. The predominant use of computers in technology education was for drawing and planning. Use of the World Wide Web or software developed for educational purposes was rarely mentioned.
Cooperation with local industry was examined with both closed-ended and open-ended questions. Nineteen percent of the respondents indicated that they have cooperated with local industry. In most cases, this involved the donation of materials or the provision of student field trips. Examples of the latter include visits to a sawmill, a fiberboard factory, and a fishing lure manufacturer. In some cases, the teachers also received expertise from the local industry. No differences were found among geographic strata.
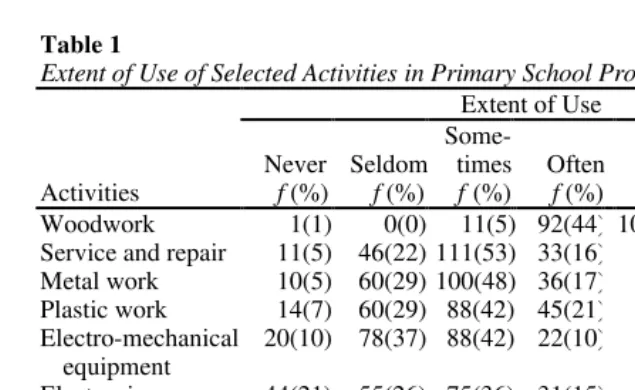
The study also investigated the kinds of activities used in technology education and their suitability to students at the primary level. Respondents were asked to rate nine selected activities. A description of each activity was
Table 1
Extent of Use of Selected Activities in Primary School Programs
Extent of Use
124(59) 52(25) 26(12) 5(2) 2(1) 209(100) 1.61 .87
Construction kits 135(64) 51(24) 20(10) 3(1) 2(1) 211(100) 1.51 .80
Internal-combustion engines
131(62) 56(27) 18(9) 5(2) 0(0) 210(100) 1.50 .75
Woodwork was clearly the most popular technological activity in Finnish primary education. The next activities in terms of popularity consisted of plastic work, metal work, service and repair of technical equipment and vehicles, electric-mechanical equipment, and electronic equipment. Least popular were construction kits, internal-combustion engines, and familiarity with
technological equipment. In addition to the nine listed activities, respondents were asked to list one other activity. Leather, rattan, mosaic work, and building model airplanes were among those listed most often. When age, education, school location, and work experience were considered, the only statistically significant result was that those teachers who hold degrees in technology education use more activities that are related to electro-mechanical equipment than those who did not hold such degrees (p=.01).
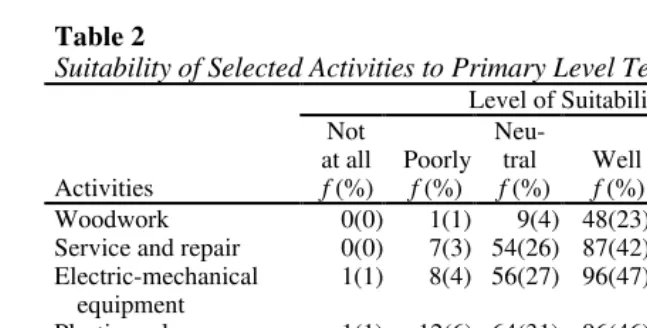
The teachers generally felt that all of the nine prescribed activities could be suitable for technology education at the primary level (see Table 2).
Table 2
Suitability of Selected Activities to Primary Level Technology Education Level of Suitability
Woodwork 0(0) 1(1) 9(4) 48(23) 150(72) 208 4.67 .58
Service and repair 0(0) 7(3) 54(26) 87(42) 59(29) 207 3.96 .83 Electric-mechanical
equipment
1(1) 8(4) 56(27) 96(47) 45(22) 206 3.85 .89
Plasticwork 1(1) 12(6) 64(31) 96(46) 34(16) 207 3.73 .82
Metalwork 0(0) 12(6) 71(34) 91(44) 33(16) 207 3.70 .81
Electronic equipment 7(3) 18(9) 57(28) 82(40) 42(20) 206 3.65 1.00 Construction kits 8(4) 16(8) 87(42) 72(35) 22(11) 205 3.41 .92 Familiarity with
technical equipment
24(12) 65(32) 74(36) 31(15) 11(5) 205 2.71 1.03
Internal-combustion engines
27(13) 65(32) 74(36) 29(14) 9(4) 204 2.65 1.02
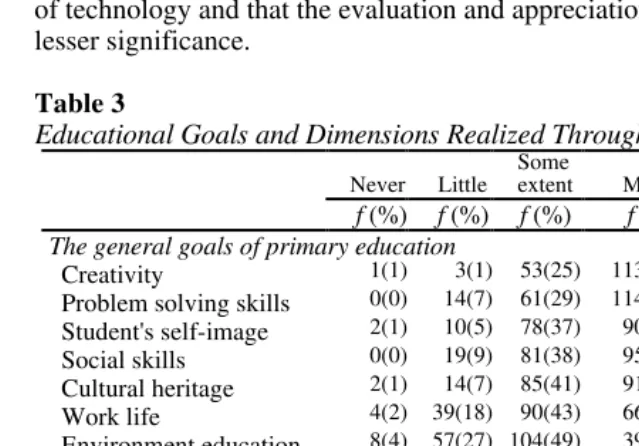
The Goals of Teaching
The Finnish curriculum guidelines mention creativity, cultural heritage, environmental education, entrepreneur education, self-image, problem solving skills, social skills, and readiness for work life as the general goals of a
comprehensive education. This study investigated how these general goals were manifested in technology education. The responding teachers were asked to describe the extent to which pupils’ activities in technology education corresponded to the goals.
According to the results reported in Table 3, technology education focuses most on students’ creativity. The development of problem-solving skills, self-image, cultural heritage, and social skills are also often associated with technology education. However, readiness for work life, environmental education, and entrepreneur education are associated to only a limited extent with technology education according to the responding teachers.
In addition to general goals, this study also considered activities related to product design. Product design strongly emphasizes creating products, such as that suggested in the “idea-to-product” processes mentioned earlier. Traditional product design-based work includes the development of manual dexterity, product planning, work safety, work education, and aesthetic education. The results indicated that manual dexterity was most central to the product design-based work. In addition, work education, work safety, and product planning were considered essential components. Aesthetics were considered to be a limited part of teaching and the pupils’ work.
The study also included an assessment of the three dimensions of
impact and consequences of technological processes. The appreciation of technology refers to understanding the outcomes of technological innovations as they relate to a higher standard of living. The data in Table 3 indicate that the respondents feel that technology education is most concerned with the utilization of technology and that the evaluation and appreciation of technology are of lesser significance.
Table 3
Educational Goals and Dimensions Realized Through Technology Education
Never Little Some
extent Much Very much Total
f (%) f (%) f (%) f (%) f (%) f M SD
The general goals of primary education
Creativity 1(1) 3(1) 53(25) 113(54) 41(19) 211 3.90 .73
Problem solving skills 0(0) 14(7) 61(29) 114(54) 20(10) 209 3.67 .74
Student's self-image 2(1) 10(5) 78(37) 90(43) 29(14) 209 3.64 .82
Social skills 0(0) 19(9) 81(38) 95(45) 16(8) 211 3.51 .77
Cultural heritage 2(1) 14(7) 85(41) 91(43) 17(8) 209 3.51 .78
Work life 4(2) 39(18) 90(43) 66(31) 12(6) 211 3.20 .87
Environment education 8(4) 57(27) 104(49) 39(18) 4(2) 212 2.88 .82
Enterprise education 19(9) 77(37) 84(40) 26(12) 4(2) 210 2.61 .89
The product design based goals
Manual dexterity 0(0) 1(1) 5(2) 86(41) 119(56) 211 4.53 .57
Work education 0(0) 4(2) 34(16) 106(50) 68(32) 212 4.12 .74
Work safety 0(0) 1(1) 39(18) 118(56) 54(25) 212 4.06 .68
Product planning 0(0) 4(2) 87(41) 96(45) 25(12) 212 3.67 .71
Aesthetics 1(1) 16(7) 90(42) 99(47) 6(3) 212 3.44 .70
The dimensions of technological literacy
Utilization of technol. 1(1) 12(6) 92(43) 98(46) 9(4) 212 3.48 .69
Evaluation of technol. 4(2) 45(21) 115(54) 44(21) 4(2) 212 3.00 .76
Appreciation of technol. 4(2) 66(31) 101(48) 39(18) 2(1) 212 2.85 .77
One approach used in technology education involves students in the making of artifacts using prescribed drawings or plans. In this study, the aforementioned approach is referred to as the “copying teaching method.” Pupils can also invent, design and make products by themselves. This second method is referred to as the “design teaching method.” Five statements with a five-point scale focused on each teaching method. According to the results, the teachers use the design teaching method significantly more (p<.001) than the copying teaching method. The means were 3.12 and 2.85 respectively. Thus technology education in primary school is more design-oriented.
The Obstacles to the Development of Technology Education
The study investigated obstacles to developing technology education in primary education with both closed-ended and open-ended questions. The respondents indicated that the three most significant obstacles, in order, were:
1. Lack of financial resources.
3. Lack of other accompanying resources.
The lack of financial resources determines what type of teaching materials may be purchased. In turn, this relates to the teachers’ perceptions about delivering a valid technology education program. One teacher, for example, stated, “Can anybody manage to develop technology education in a positive direction with these kinds of financial resources?” The lack of financial resources was followed by the lack of teaching ideas and the lack of other accompanying resources. The latter is related to classroom tools, machines, and other equipment that must be purchased with resources other than those used for supplies and materials. No significant differences among the respondents were found for the top three obstacles listed above. Though not at the top of the list, motivation was one of the obstacles identified. It was found that older teachers felt that they had significantly less motivation compared to younger teachers (p<.05).
The Development of Technology Education
Perceptions about technology education in the future were also investigated in this study. An open-ended question asked the respondents how or in what direction they would like to see technology education change in the future. Over one-fourth of the respondents felt that program updating was the most important goal to pursue in the future for the development of technology education. Samples of the respondents’ statements with some caveats included, “…modern technology must be included in the right amount in the curriculum in such a way that it does not become an end in itself” or “More technology should be
generally forced into the comprehensive school. But it can not take away from the diminishing number of handwork specialization courses…people have a need to do work with their hands…”.
Eighteen percent of the respondents felt that the making of products should continue in the future. Several connected this perception with the need to bolster the content as well. There seemed to be a strong sentiment about moving toward a changed program but not discarding critical elements of traditional programs. Examples of statements supporting this were:
• “I appreciate the teaching of handiwork tradition and the applying of technological integration…Therefore, teaching of technological understanding is already entitled to start from childhood.”
• “The diversified use of different materials, new work methods, and technology should nonetheless be realized without losing traditional woodworking.”
• “Generally more technology to the comprehensive school, but this may not take time from more and more important dexterity…”.
• “In technology education the final product is also important. The subject may not only be going toward technological knowledge. The making of concrete articles is very rewarding for many kids…”.
Diversification of curricular content to increase breadth was mentioned by 17% of teachers. Sample responses included, “Technology education should strive toward diversification” and “more diverse content is needed.”
Modernizing programs was mentioned by nine percent of the respondents. The term modernizing in this context refers to the need for programs to reflect contemporary society. A sample response in this category was, “More connection with these modern times.” Nine percent of the teachers mentioned creativity, such as: “Move away from wood, toward creativity and new materials” or, simply, “More creativity.” Teaching basic skills, electronics, planning, and the traditional handwork were also mentioned, but to a lesser extent.
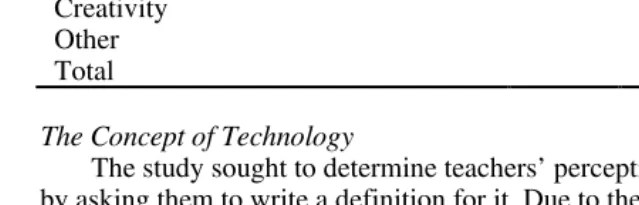
Table 4
Goals for the Future Development of Technology Education (n=118)
f %
More technological content 32 27
The making of products (handwork) 21 18
Diversification of Curriculum 20 17
Modernizing Curriculum 10 9
Creativity 10 9
Other 85 72
Total 178
--The Concept of Technology
The study sought to determine teachers’ perceptions of the word technology by asking them to write a definition for it. Due to the breadth of the responses, some of the definitions were placed in more than one category. These data are reported in Table 5.
Table 5
Teachers’ Definitions of Technology (n=170)
Definitions f %
Utilizing technical devices 61 36
Knowledge, skills, and means for doing different tasks 56 33
Technical devices and machines (artifacts) 38 22
Production process 25 15
Knowledge of how technical devices and machines work 8 5
Others 45 27
Total 233
One third of the teachers defined technology in terms of human knowledge and capability relative to accomplishing tasks. Technology was seen as know-how, or “human capital,” which helps humans satisfy their needs and wants. Examples of statements in this category are “the adapting of modern technical know-how for the needs of humans” or “an activity which is realized with the help of thinking and equipment in practice.”
Nearly a quarter of the group thought of technology in terms of artifacts. Sample definitions include “devices and machines which help the work and activity of humans” and “today’s high technology consumer products, such as mobile phones, computers, gauges, etc.” Technology was understood as a production process by 15% of the responses. Included in the “other” response category were concerns about the elimination of existing content such as, “the killer of a traditional handwork…or at least a big threat” and “everything involving dexterity is technology.”
Discussion
Woodwork is the most popular activity area in technology education in Finnish primary schools. Electricity and electronics tasks, plastic work, and service and repair are taught to a certain extent. Nonetheless, all of the activities listed in the study were considered suitable for technology education at the primary level except for those related to familiarity with technological equipment and internal-combustion engines. Computers are not yet used to a large extent in technology education, but use is expected to increase rather dramatically in the near future. There is evidence of substantial cooperation between teachers and industry. The biggest obstacle for the development of technology education is inadequate financial resources and the resultant lack of materials and equipment necessary to teach it.
The age, education, and work experience of the teacher and the school location did not seem to be related to technology education practice. The traditional goals of Finnish technology education and the general goals of primary education are clearly manifested in technology education. The practical aspects of technological literacy were considered to be essential aspects of technology education. The design-based teaching method is more commonly used than the more antiquated and less educationally sound copying-based teaching method. It appears as though most of the teachers in primary schools understand the concept of technology from a perspective that encompasses more than just new technological artifacts or computers. The definitions of the term technology, in fact, seemed to match Mitcham’s (1994) modes of technology. The study showed that the teachers felt that technology education should include more modern technological content while, at the same time, retaining traditional educational handwork.
important than what the appearance of the products produced. However, it appears that a shift is needed toward activities through which students solve real-world, technological problems. Moreover, the development of technological literacy requires experiences that are representative of all fields of technology, not just the physical elements.
A surprising result of this study was that familiarity with technological equipment was not considered very suitable for technology education at the primary school. Although the teaching of abstract and rapidly changing technical facts is not advisable, some technological concepts, principles, and their consequences and impact on nature and society can be learned through such activities. For example, as students design and make electronic or electro-mechanical equipment, the teacher could easily organize class discussion that would cause pupils to reflect upon how their work relates to society and the environment.
It was surprising to find that neither the age of the teacher nor the geographic location of the school seemed to make a difference in technology education. The respondents were optimistic about the further development of technology education in the future. This was encouraging since the teachers are the principal determinants of the curriculum. The teachers clearly felt that more financial resources were needed in order for the programs to improve. In other words, they were willing to change if the resources are available. Yet the lack of necessary resources seems to be a problem shared with technology education in most other countries. Technology education is universally one of the most expensive school subjects. Efforts to change the values of financial decision makers must continue, along with the efforts by teachers to convincingly demonstrate the values of the program relative to the cost.
One way to diversify technology education is to develop activities that correspond more closely with the modern technological world. The designing and making of products should include more theoretical elements, abstract thinking, and links to the technology that students encounter in their everyday lives. Pupils, as current and future consumers of technological products, should be able to make valid inferences about the impact of technological products and solutions on their lives. Pedagogically, more attention must be placed on developing activities that are suitable for a particular grade level.
On the other hand, the aim in developing technology education in primary schools is not to create a technology education classroom wherein pupils only read textbooks, watch videos, use computer software, and complete worksheets. The cultural, economic, natural, and social aspects, together with the
products, pupils should be taught to reflect upon the impact and consequences of technology to the society and the environment around them.
As the study indicates, teachers would be ready to include more
technological content in their teaching if they had more financial resources and teaching ideas. However, they also want to preserve the traditional design and making of products, which enjoys a long, successful history in Finnish technology education. Hence, we must not throw “the baby away with the bath water” when making decisions about technology education. More than just technological understanding is needed in the future. Although technological thinking depends on specific knowledge, many examples of powerful and productive thinking result from sharing across disciplines and situations (see Bruer, 1994; Resnick, 1987). Therefore, a multidisciplinary approach like that suggested by Petrina (1998) seems most appropriate to the development of technology education in primary education in Finland. Nevertheless, more research and many more proven examples of practice are needed to accomplish these ideals.
References
Alamäki, A. (1997). Käsityö- ja teknologiakasvatuksen kehittämisen lähtökohtia varhaiskasvatuksessa [Starting points of developing for craft and
technology education in early childhood education]. (Publication series A. Research reports No. 181). University of Turku, Finland: Faculty of Education.
Autio, O. (1997). Oppilaiden teknisten valmiuksien kehittyminen peruskoulussa. [Student’s development in technical abilities in Finnish comprehensive school]. (Research reports No. 117). University of Helsinki, Finland: Department of teacher education.
Bruer, J. (1994). Schools for thought. A science of learning in the classroom. Cambridge: The MIT Press.
Dyrenfurth, M., & Kozak, M. (Eds.), (1991). Technological literacy. 40th Yearbook. Council on technology teacher education. Illinois: MacMillan. Kananoja, T. (1997). Teacher training in technological education in Finland. In
T. Kananoja (Eds.), Seminars on technology education. Oulu, 7.-8.5.1996; 18.20.10.1996 (pp. 9-16). (Research reports No. 69). University of Oulu, Finland: Faculty of Education.
Kankare, P. (1997). Teknologian lukutaidon toteutuskonteksti peruskoulun teknisessä työssä. [The context of technology education (Technical work) in schools]. (Publication series C. Research reports No. 139). Turku, Finland: University of Turku.
Kantola, J. (1997). Cygnaeuksen jäljillä käsityönopetuksesta teknologiseen kasvatukseen. [In the footsteps of Cygnaeus: From handicraft teaching to technological education]. (Studies in education, psychology and social research 133). Jyväskylä, Finland: University of Jyväskylä.
(Studia Pedagogica 11). University of Helsinki, Finland: Department of Teacher Education.
Lindh, M. (1996). Matematiikan ja fysiikan integrointi tekniseen työhön. Virikeaineistoa yleissivistävän koulun teknologiakasvatukseen. [The integration of math and science into technology education. Practical examples for technology education in comprehensive school]. (Publication series C. Research reports No. 68). University of Oulu, Finland: Faculty of Education.
Mitcham, C. (1994). Thinking through technology. The path between
engineering and philosophy. Chigago, IL: The University of Chicago Press. Opetushallitus. (1994). Peruskoulun opetussuunnitelman perusteet. [The
curriculum guidelines for general education]. Helsinki: Valtion painatuskeskus.
Parikka, M., & Rasinen, A. (1993). Technology education experiment, curricular points of departure for the experiment, In I. Mottiers, J. Ratt & M. de Vries (Eds.), Technology education and the environment. Improving our
environment through technology education (pp. 189-206). Proceedings of PATT-6 conference, The Netherlands.
Peltonen, J. (1995). Craft and prevocational education in pre-primary and primary education. In J. Lasonen, & M-L. Stenström (Eds.), Contemporary issues of occupational education in Finland (pp. 27-41). University of Jyväskylä, Finland: Institute for educational research.
Petrina, S. (1998). Multidisciplinary technology education. International Journal of Technology and Design Education, 8(2), 103-138.
Resnick, L. (1987). Education and learning to think. Washington, DC: National Academy Press.
Identification of Quality Characteristics
for Technology Education Programs:
A North Carolina Case Study
Aaron C. Clark and Robert E. Wenig
Since its beginning, technology education has consistently pursued quality outcomes in course offerings. Especially during the past 25 years, the process of establishing standards, or outcomes, has been a major area of focus at both the national and state levels (Dugger, 1988). After interviewing North Carolina State Department of Public Instruction state officials, it was found that North Carolina had not identified indicators of quality that could be used to assess whether technology education programs throughout the state are meeting statewide curriculum goals and objectives. The identification of such quality indicators and the development of a correlated check sheet was the purpose of this study.
Program quality has been a concern for practitioners within technology education. However, what constitutes the elements of quality has not been adequately investigated. For example, Henak (1992) declared that quality learning in a technology education program comes from the content, learning process, experiences, and growth opportunities offered to students.
The problem of educational quality and its assessment extends to the whole of education. According to the Education Commission of the States (1992), even though there have been many attempts to develop educational standards, new information on assessing the quality of education provided in schools, districts, and states is lacking. The Federal Coordinating Council of Science, Engineering, and Technology (1993) added that an evaluation process is needed in each state to analyze programs so that questions about the quality of a program can be answered. Further, if responsible change efforts are to be made to establish quality in a technology curriculum, they must include a structure for an objective and critical assessment of each program in order to establish benchmarks for the process (Dyrenfurth, Custer, Loepp, Barnes, Iley, & Boyt, 1993). Many states in addition to North Carolina are working towards setting criteria for assessing quality within technology programs. If a state is to grow ____________________________
and develop better course offerings within its technology education programs, more research is needed. Professionals in technology education throughout North Carolina felt that a benchmarking process was needed and it should be directly linked to an assessment strategy. Secondarily, the results of this study would also be used in establishing criteria for North Carolina’s “Governor’s Quality Leadership Award” in education, a goal for all educational programs within the state.
Research Methodology
The Delphi technique for achieving consensus among experts was determined to be the best research method for the stated purpose of this study. Volk (1993) used the Delphi method for acquiring consensus on technology education curriculum development and Dalkey (1972) suggested the Delphi technique as a means for decision-making through the use of expert judgement. Procedures used for conducting this particular Delphi study were developed from experts on the methodology (e.g., Delbecq, Van de Ven, & Gustafson, 1986; Linstone & Turoff, 1975; Meyer & Booker, 1990). From the literature, it was determined that a four round Delphi process would be used.
The members of the panel of experts were selected by soliciting recom-mendations from administrators responsible for technology education, technology teacher educators, and personnel from the North Carolina State Department of Public Instruction. Individuals with the highest number of recommendations were selected to serve on the panel of experts. The resultant panel totaled 19 and consisted of 15 technology teachers, three vocational directors, and one technology teacher educator. This number was proportional to the total number of individuals within the state who serve in these respective positions.
Next, a review panel of three members was randomly selected from a list of those not selected to be on the panel of experts. The purpose of the review panel was to review and approve each instrument used in the study. This was done to reduce bias that might occur as a result of modifications made between rounds (Linstone & Turoff, 1975; Meyer & Booker, 1990). The format for the initial instrument was developed by reviewing examples from other Delphi studies (Meyer & Booker, 1990; Volk, 1993). The categories and quality indicators were identified principally from a list of similar items developed by the Maryland State Department of Education (1995).
Findings
Table 1
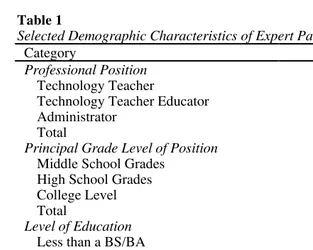
Selected Demographic Characteristics of Expert Panel Members
Category n %
Professional Position
Technology Teacher 15 78.9
Technology Teacher Educator 1 5.3
Administrator 3 15.8
Total 19 100
Principal Grade Level of Position
Middle School Grades 6 31.6
High School Grades 12 63.1
College Level 1 5.3
Total 19 100
Level of Education
Less than a BS/BA 1 5.3
BS/BA 8 42.1
MS/Med 9 47.3
EdD/PhD 1 5.3
Total 19 100
Geographic Region
704 Area Code 7 36.8
910 Area Code 6 31.6
919 Area Code 6 31.6
Total 19 100
Table 2
Years of Teaching Experience of Expert Panel Members (n=19)
Category M SD Minimum Maximum
Teaching experience in years 11 9.13 0 28
Administration experience in years .57 1.53 0 6
The initial instrument, once approved by the three-member review panel, was sent to the expert panel members. This represented Round One of the study. Panel members were allowed to edit the indicators and categories and add new ones. Those that were accepted by the majority of the panel members were retained. Similar items were combined and redundant items were eliminated. Once approved by the review panel, the resulting instrument consisted of 47 indicators of quality for technology education programs across eight categories.
education program. A rating of two represented a poor indicator of quality, one that 49% or fewer of the programs should meet. A value of three represented a fair indicator of quality, one that was appropriate for 51 percent or more for technology education programs within the state. A rating of four represented a good indicator of quality, one that 75 percent or more technology education programs should meet. Five represented an excellent indicator of quality, one that all technology education programs in the state should meet.
Table 3
Examples of Modifications Made to Indicators from Round Two of the Delphi Study
Indicator from Round Two
Modifications to Indicator for Round Three The philosophy and program
objectives address the need to teach the application of technology for the present and future needs of society
The program objectives address the need to teach the application of technology for the present and The philosophy addresses the need to
continually update and revise the
Using standard Delphi procedures, a mean cutoff value of 3.01 was used on the Likert-type scale responses. Quality indicators with a mean value of 3.01 or above were retained for Round Three and the others were discarded. It was thereby determined that the remaining indicators were appropriate for 51 percent or more of technology education programs within the state. All the categories were retained.
A One Factor Repeated Measures Analysis of Variance (ANOVA) was used to determine if one particular category was dominant over other categories according to a procedure suggested by Agresti & Finalay (1986). No significant differences were found among the categories. These data are shown in Table 4.
Table 4
One-Factor Repeated Measures ANOVA Test on Category Names from Round Two
Category Name M SD F value p
Philosophy and Mission 4.26 .57 --
--Instructional Program 4.21 .56 --
--Student Populations 4.29 .63 --
--Program Requirements 4.09 .69 --
--Safety and Health 4.11 .65 --
--Professional Development 4.42 .61 --
--Facilities/Equipment/Materials 4.35 .70 --
--Public Relations 4.25 .76 --
--OVERALL 1.42 .20
A series of Spearman correlation coefficients was calculated between the ratings of the quality indicators from Round Two compared to rankings
determined in Round Three (Gibbon 1976). This statistical process was designed to reveal the relationship between each category and its corresponding
indicators. The indicators in Round Two ranged from 1 (low) to 5 (high) while the rankings within each category went in the opposite direction (1 being the highest rank). Thus, a high negative correlation was an indicator of consensus between the two rounds.
The Facilities/ Equipment/Materials Category had a low negative correlation coefficient of minus .18 and the Public Relations category had a positive correlation coefficient of plus .44. These two categories, with their indicators, did not indicate consensus. However, the overall scores combined together had a moderate negative correlation coefficient of minus .40. This suggested that consensus was being achieved between rounds two and three overall. Suggested modifications from both panels were made to indicators from this round and incorporated into the fourth and final round. These data are shown in column two of Table 5.
The Spearman’s correlation coefficient was also calculated between the ranks and medians for Round Three. A positive high correlation would show that no outliers (effects of one or more extreme scores) were influencing the consensus reaching process for the indicators in this round. Such high positive correlations were found for all of the categories. These data are shown in column three of Table 5.
In the end, indicators that ranked in the upper 50 percent for a category were retained and the others were discarded. This reduced the indicators to a useable number and retained only those most likely to reach consensus in the final round.
permitted. Once these data were collected, the indicators were placed in a contingency table. A Chi-Square test (p<.05) was conducted to determine the quality indicators for which the panel members had reached consensus. Only one indicator did not reach the consensus criterion. That indicator required that the technology teachers and/or a vocational director prepare a written plan for a comprehensive safety and health program. It was felt by the panel of experts that this was a practice that all technology education programs must do for legal reasons and was therefore not an indicator of quality. The remaining 25 indicators, shown in Table 6, constituted the final list.
Table 5
Spearman’s Rho Correlation Coefficient between Round Two Rating and Round Three Rank (Round Two), and Round Three Rank and Median
Category r (M rate/M rank) r (M rank/Mdn)
Philosophy and Mission of Program -.90 .91
Instructional Program -.88 .98
Student Populations -.97 1.00
Program Requirements -.44 .93
Safety and Health -.82 .97
Professional Development -.63 .95
Facilities/Equipment/Materials -.18 .99
Public Relations .44 .97
Overall Total Scores for Combined Categories
-.40 .95
Table 6
Final Listing of Quality Indicators for Technology Education Programs Philosophy and Mission of Program Category:
• The program objectives address the need to teach the application of technology for the present and future needs of society.
• The philosophy and program objectives include teaching students the importance of using knowledge, materials, tools, and machines to solve problems by producing products.
• Technology teachers are actively involved in developing the philosophical and/or mission statement for the program.
• The philosophy and program objectives address the need to continually update and revise the curriculum.
Instructional Program Category:
• Course content is developed from course competencies/enabling objectives and utilizes approved curriculum guides, courses of study and professional resources.
• Course content is allowed to develop and to experiment with new technologies and areas.
Table 6 (cont.)
Final Listing of Quality Indicators for Technology Education Programs Student Populations Category:
• Technology education activities are provided for all students without bias toward gender, ethnic background, achievement, handicap, or dis-advantagement.
• All students are provided guidance about technology education course offerings at their school.
• All population types are represented in the technology education program.
• Program Requirements Category:
• Sufficient funds are budgeted for equipment and facility improvements to accomplish course objectives.
• Administration presents the attitude necessary for growth and development of technology education programs.
• The maximum number of students per period is appropriate for class
population (special populations, etc.) and appropriate for the type and kind of instructional activity(ies) conducted.
• Administration is knowledgeable of the need to continually update the technology curriculum.
Safety and Health Category:
• Technology teachers prepare and teach appropriate lessons on safety.
• Students participating in technology education classes are required to complete a written safety test on applicable equipment with 100% success.
• Professional Development Category:
• The technology teacher is provided adequate time and finances to attend at least one state sponsored workshop or function.
• Adequate funding is provided for technology teachers to participate in local, state, and national professional development according to local policy and procedures.
• The technology teacher participates in staff development activities that lead to the correlation of technology education with other related academic and vocational disciplines.
Facilities/Equipment/Materials Category:
• The technology presented is applicable to the present and future workplace.
• The appearance and arrangement of the laboratory reflect the mission and philosophy of the program.
• The technology offered in the program is up-to-date with current technological needs.
• Public Relations Category:
• Teachers and students maintain a high state of visibility through the promotion of class and student activities as a public relations strategy.
• Students promote and support technology education programs through involvement in activities, including North Carolina Technology Student Association or Career Exploration Clubs of North Carolina.
Conclusion
Using the Delphi technique, a panel of experts within the state of North Carolina reached consensus on 25 quality indicators for technology education. Three major conclusions were drawn from the information collected from this study. First, the quality indicators listed in the findings for this study were developed for technology education programs in North Carolina, but most could be used for other programs that utilize laboratory instruction. The researchers for this study feel that since expert panel members were asked to write indicators general to all technology programs within the state that each indicator could easily be articulated into other program areas related to industrial or vocational education.
Second, the final listing of quality indicators are similar to those listed in Maryland’s (1995) list of quality indicators. The 25 indicators found within this study cover the same topic areas as indicated within the Maryland listing of quality indicators. Major differences between the two lists are as follows. First, Maryland has developed hundreds of indicators and most are directly related to specific content in technology education. Maryland used a team of technology education professionals to assess program quality for schools within the state. Indicators found within this study are fewer in number and not as specific in curriculum content areas. Also, these indicators were written for school administrators with little or no background in technology education to use for program assessment.
Finally, major categories found within the study directly mirror eight of the ten categories for standards used in previous standards projects (Dugger, 1985). The researchers for this study did not pursue why expert panel members did not include categories for evaluation process and support systems. Also, the study with all categories and indicators solicited from the experts directly reflect those major areas and findings associated with the Technology for all Americans Project (1995). This reflection illustrates to the researchers that the establishment of standards and the development of quality indicators can coincide with each other and therefore, one can identify quality characteristics for programs through the establishment of standards for that same program. This process of combining the two areas together will allow technology education professionals to establish needed benchmarks for programs as we teach our students to learn to live in a technical world.
References
Agresti, A., & Finlay, B. (1986). Statistical methods for the social sciences (2nd ed.). San Francisco: Dellen Publishing.
Dalkey, N. C. (1972). Studies in the quality of life: Delphi and decision making. Lexington, MA: Lexington Books.
Delbecq, A. L., Van de Ven, A. H., & Gustafson, D. H. (1986). Group techniques for program planning: A guide to nominal group and Delphi processes. Middleton, WI: Green Briar Press.
Dugger, W. E. (1988). Evaluation of our profession over the past twenty-five years: Quantitative and qualitative benchmarks. In D. L. Householder (Ed.), Mississippi Valley Industrial Teacher Education Conference, USA, 75, (pp. 91-109). Lansing, IL: Technical Foundation of America. (ERIC Document Reproduction Service No. ED 323 332)
Dyrenfurth, M. J., Custer, R. L., Loepp, F. L., Barnes, J. L., Iley, J. L., & Boyt, D. (1993). A model for assessing the extent of transition to technology education. Journal of Industrial Teacher Education, 31(1), 57-83.
Education Commission of the States. (1992). Creating visions and standards to support them: Restructuring the education system. Denver, CO: Education Commission of the States. (ERIC Document Reproduction Service No. ED 350 676)
Federal Coordinating Council for Science, Engineering and Technology. (1993). The federal investment in science, mathematics, engineering, and technology education? Where now? What next? Report of the expert panel for the review of federal education programs in science, mathematics, engineering, and technology. Washington, DC: Author. (ERIC Document Reproduction Service No. ED 366 500)
Gibbons, J. D. (1976). Nonparametric methods for quantitative analysis. New York: Holt, Rinehart and Winston.
Linstone, H. A., & Turoff, M. (1975). The Delphi method: Techniques and applications. Reading, MA: Addison-Wesley Publishing.
Maryland State Department of Education. (1995). Quality indicators for technology education programs in Maryland. Baltimore, MD: Division of Career Technology and Adult Learning.
Meyer, M. A., & Booker, J. M. (1990). Eliciting and analyzing expert judgement: A practical guide. Washington, DC: U.S. Nuclear Regulatory Commission.
Technology for All Americans. (1995). A project to develop national standards for K-12 technology education [Brochure). Blacksburg, VA: Dugger. Volk, K. S. (1993). Curriculum development uses the Delphi technique. The
Technology Teacher, 52(4), 35-36.
Elementary Children’s Conceptions
of Structural Stability: A Three Year Study
Brenda J. Gustafson, Patricia M. Rowell & Dawn P. Rose
Background to the Study
The research reported in this paper is drawn from a much larger three-year study focused on the 1996 implementation of Problem Solving Through Technology topics in Alberta, Canada elementary science classrooms. In this three year study, we worked to characterize children’s development of techno-logical knowledge and skills during design technology problem solving activities and report on support needed by teachers to present these topics in classrooms. We also examined the Problem Solving Through Technology inquiry model presented in the Alberta Elementary Science Program (1996) and explored whether this model resembled how professionals (e.g., engineers) engaged in technological problem solving described their work.
The study commenced in September 1995, one year prior to the mandated implementation of a new Alberta Elementary Science Program (1996). In this preliminary year (Study Year One), 20 engineers were interviewed about their perceptions of technological problem solving (Rowell, Gustafson & Guilbert, 1997). One hundred fifty three children (80 male, 73 female) completed a performance based assessment related to the impending program. Three hundred thirty four children (180 male, 154 female) completed an Awareness of
Technology Survey. Data from Study Year One provided insight into children’s technological knowledge and problem solving skills prior to formal classroom instruction and information about how engineers characterized their work. In Study Year Two, six case studies were conducted on the classroom implemen-tation of the Problem Solving Through Technology topics. These case studies allowed insight into the practical problems encountered by teachers and their concerns about support needed to teach design technology in an effective manner (Rowell & Gustafson, 1998). Case studies also provided a context in which we could begin to characterize how children solved design technology problems in classrooms. Study Year Three involved locating children from Study Year One and re-administering the performance based assessment and a ____________________________
revised version of the Awareness of Technology Survey. These data showed children’s knowledge and skill development after participating in formal classroom instruction in the Problem Solving Through Technology topics and allowed for comparisons to Study Year One data.
In the research reported in this paper, we focus on one question from the Awareness of Technology Survey which was administered in Study Year One with a revised version of the question presented in Study Year Three. The question, named ‘Jane’s Tower,’ was designed to explore children’s awareness of elements which contribute to the stability of a structure. Analysis of the children’s responses to this survey question allow discussion of the following two research questions:
1. How do children’s perceptions of structural stability change over time? 2. Did the children offer more elegant, quality solutions in Study Year
Three?
Elegant solutions were those in which the child offered one simple, useful idea which would allow the tower to be stable. Later in this study, a more thorough definition of elegance is offered and in order to address this question, data were analyzed further with attention paid to children’s tendencies to provide a selective or unselective answer.
Related Literature
In recent years, there has been a growing trend towards including design technology in school programs (Layton, 1993). Arguments presented to support this trend include cultural, educational, economic, and political reasons centered on the necessity to develop children’s technological capabilities and prepare them to participate in technology-related decision-making. Research on school technology programs has included analysis of the relationship between science and technology (Gardner, Penna, & Brass, 1990 ; Layton, 1993), an exploration of the dimensions of technology (Custer, 1995; Pacey, 1983), an outline of problem solving models (Johnsey, 1995), studies of classroom experiences (Davidson, Murphy, Hennessy, & McCormick 1996; Kimbell, Stables, & Green, 1996; McCormick, Murphy, Hennessy, & Davidson, 1996; Northing, 1989; Roden, 1997), and discussion of the pedagogical implications of design technology (Anning, 1994, 1997; Davies, 1996; Kimbell, Stables, & Green, 1996; Williams & Jinks, 1985).
understanding (Alberta Education, 1996; National Research Council, 1996; Tickle, 1990). Program developers maintain that through developing knowledge and skills, children will become more technologically capable (Kimbell, Stables, & Green, 1996; Layton, 1993).
Much design technology research has focused on characterizing procedural knowledge (skills involved in knowing how to do it) and organizing this knowledge into problem solving models (Johnsey, 1995, 1997; Layton, 1993; McCormick, 1996; McCormick, Hennessy, & Murphy, 1993; McCormick, Murphy, & Hennessy, 1994; Roden, 1997). Researchers have argued that procedural knowledge underpins technological problem solving, might well be context dependent, and is used in combination with conceptual knowledge (understanding relationships among relevant concepts) and strategic knowledge (planning what to do next) to resolve dilemmas which arise during practice (Levinson, Murphy & McCormick, 1997; McCormick, 1996).
It appears that less research has focused on children’s conceptual
knowledge of design technology (Bennett, 1996; Coenen-Van Den Bergh, 1987; Levinson, Murphy, & McCormick, 1997). This situation is in contrast to science education research which includes an impressive volume of literature on children’s conceptual knowledge of science topics and the implications this knowledge has for teaching science (Driver, Guesne, & Tiberghien, 1985; Griffiths, 1994; Osborne & Freyberg, 1985).
This study is based on the assumption that research on children’s conceptual knowledge of design technology has implications for curricula and pedagogy. In particular, we explore children’s conceptual knowledge of elements that contribute to structural stability. Structural stability, of course, is only one concept which contributes to the production of a purposeful product. Other concepts such as those related to structural strength, joint reinforcement, and material selection represent some areas for future research. Structural stability is frequently associated with designs which include attention to symmetry, a lower center of gravity, an even distribution of weight over base, a stable base, a base broader than the top of the structure, or sinking supports into the ground (Salvadori, 1990). Related to stability are ideas about structural strength, which could contribute to stability. These ideas could include strengthening supports to prevent buckling and reinforcing joints to deter separation. Understanding the nature of children’s ideas about structural stability and how these ideas may or may not be influenced through participation in school programs would be useful for both teachers and program developers.
As children use conceptual and other knowledge to solve design technology problems, they should also be encouraged to achieve quality solutions
skills in a variety of contexts. In this study, we not only describe the children’s conceptual knowledge of structural stability, but also comment on whether children were able to use this knowledge in a discerning, elegant way.
Study Framework
In order to set the context for the research reported in this paper, we begin with a brief description of the Alberta program and then provide information about study instrumentation and data collection.
Alberta Program
In September 1996, a new Alberta Elementary Science Program (1996) was mandated for use in Alberta schools. One feature of this program was the inclusion of a Problem Solving Through Technology topic at each of the six grade levels. These topics were intended to provide a context in which children could develop technological problem solving capabilities and develop a conceptual understanding of the function and structure of an assortment of devices and structures. Within the revised program, children were asked to design and make structures, boats, aircraft, other vehicles that move, and mechanisms that use electricity.
In Grade One, children participate in a Building Things topic that allows them to build models of structures such as buildings, furniture, toys, water wheels and boats. These experiences provide opportunities to explore methods of fastening, joining and shaping materials and the role these methods play in structural stability. Grade Two focuses on the Buoyancy and Boats topic in which children are expected to “modify watercraft to increase its stability in water” (Alberta Education, 1996, p. B8), an idea which emphasizes the connection between stability and shape. Building With a Variety of Materials is the topic presented in Grade Three in which children construct structures which support objects, span gaps, and serve as containers or buildings. Once again the children practice building techniques which can assist them to understand the link between stability and overall shape and it is likely the children also explore how stability is connected to a stable base, symmetry and weight distribution. Grade Four features a topic entitled Building Devices and Vehicles That Move; a topic in which children build stable vehicles through constructing a symmetrical chassis and thinking about the distribution and positioning of weight over that chassis. In Grade Five, children participate in a Mechanisms Using Electricity topic in which they design and construct electrical devices such as electrical cars, fans, hoists, and burglar alarms. Some of these building projects would include concepts related to stability. Grade Six features a Flight topic in which children build gliders, parachutes, and rockets. These projects help children understand that stability is related to overall shape and weight distribution.
solutions. These criteria are repeated in Grades Five and Six and most likely would not be excluded from the more modest product evaluation performed in younger grades.
Study Method
Instrument
The instrument used was named the Awareness of Technology Surveyand featured a selection of questions intended to explore children’s ideas about concepts and skills related to the Alberta Elementary Science Program (1996). Each of the six grade levels had a different selection of survey questions with some questions being repeated at each grade level if they were judged related to the entire program (e.g., the question about structural stability).
Awareness of Technology Survey questions were either created by the authors or patterned after survey questions posed by a number of other writers (Aikenhead, 1988, Coenen Van Den Bergh, 1987; DES, 1992; Gadd & Morton, 1992 a,b; Harrison & Ryan, 1990; Rennie, 1987; Rennie, Treagust, & Kinnear, 1992; Symington, 1987). Consultations with provincial government personnel familiar with the new elementary science program who had additional exper-ience with developing test items for provincial scexper-ience achievement exams were used to validate survey items with respect to the new program.
Piloting
Sections of the Awareness of Technology Survey were piloted with a group of 140 children in grades one through six (ages 5-12). Grade One children who had yet to develop adequate reading skills had questions read to them as a group; this approach was used despite the fact that the Grade One survey contained little writing. Children’s oral questions and advice as well as teacher comments were noted. Written survey responses were analyzed to check whether they addressed the original intent of the questions and, subsequently, revisions were made to wording and format. From this piloting experience, the Awareness of Technology Survey was constructed which was used in Study Year One. A revised version of this same survey that asked children to elaborate more on their answers was used in Study Year Three
Selecting the Children and Administering the Survey