Reemployment Bonuses
Christopher J. O’Leary
Paul T. Decker
Stephen A. Wandner
A B S T R A C T
Targeting reemployment bonus offers to unemployment insurance (UI) claimants identified as most likely to exhaust benefits is estimated to reduce benefit payments. We show that targeting bonus offers with profiling models similar to those in state Worker Profiling and Reemployment Services systems can improve cost effectiveness. Since estimated average benefit payments do not steadily decline as the eligibility screen is gradually tightened, we find that narrow targeting is not optimal. The best candidate is a low bonus amount with a long qualification period, targeted to the half of profiled claimants most likely to exhaust their UI benefit entitlement.
I. Introduction
Between 1984 and 1989, four reemployment bonus experiments were conducted on unemployment insurance (UI) recipients in Illinois, New Jersey, Washington, and Pennsylvania. These experiments offered lump sum payments to UI recipients who began new jobs within a prescribed period and remained employed for at least four months. The bonuses were designed to speed reemployment of UI
recip-Christopher J. O’Leary is a senior economist at the W. E. Upjohn Institute for Employment Research. Paul T. Decker is Vice President for Human Services Research at Mathematica Policy Research, Inc. Stephen A. Wandner is director of research and demonstrations for the Employment and Training Administration in the United States Department of Labor. The authors thank Walter Corson, Randall Eberts, Lori Kletzer, Jeffrey Smith, Robert Spiegelman, Stephen Woodbury, and seminar participants at the W. E. Upjohn Institute for useful suggestions. Kenneth Kline, Lauren Beaumont, and Susan Miller provided excellent research assistance. Funding for this work was provided by Mathematica Policy Research, the W. E. Upjohn Institute for Employment Research, and the U.S. Department of Labor. Opinions expressed do not necessarily represent those of the funding organizations. The authors accept responsibility for any errors which may remain. The data used in this article can be obtained beginning October 2005 through September 2008 from Ken Kline, W.E. Upjohn Institute for Employment Research, 300 South Westnedge Avenue, Kalamazoo, MI 49007 <Kline@UpjohnInstitute.org>
[Submitted September 1998; accepted September 2003]
ISSN 022-166X E-ISSN 1548-8004 © 2005 by the Board of Regents of the University of Wisconsin System
ients and thereby reduce UI benefit payments. Findings from the four experiments demonstrated that, as expected, the reemployment bonuses reduced UI payments. However, the reductions in payments were usually not large enough to fully cover the costs of paying and administering the bonuses (Decker and O’Leary 1995). The bonuses, therefore, were not cost-effective from the perspective of the UI system.
In 1993, the federal government passed laws requiring states to establish Worker Profiling and Reemployment Services (WPRS) systems to target reemployment ser-vices to UI recipients expected to face long unemployment spells.1The passage of the WPRS legislation was based largely on evidence that providing targeted UI recipients with reemployment services reduced UI payments enough to pay for the costs of pro-viding the services (Corson et al. 1989; Meyer 1995). Federal legislation proposed in 1994 would have permitted states to offer a targeted reemployment bonus, but the pro-posal was not enacted. Currently, reemployment bonuses are not among the reemploy-ment services that states may offer. In 2003, however, the Bush administration proposed a targeted reemployment bonus as a feature of new personal reemployment accounts.
Although the experiments demonstrated that a nontargeted bonus is not cost-effec-tive, targeting reemployment bonuses to a segment of the UI recipient population using the WPRS approach might yield different findings. This would depend on the extent to which those targeted for the bonus offer respond to the offer, and whether those responding would have had relatively long UI spells in the absence of the offer. This paper examines that question using data from the two most policy-relevant experiments—those in Pennsylvania and Washington. We calculate bonus effects for subgroups of recipients defined according to their predicted probability of exhausting UI benefits. We then investigate whether the bonus effects on UI receipt are larger for recipients with higher predicted probabilities of exhaustion. We also examine whether the net benefits of a bonus offer are likely to vary according to the predicted proba-bility of exhaustion, and if so, whether one can use the probabilities to target the bonus offer so as to make it cost effective. While small sample sizes preclude strong conclusions, the initial results presented here suggest a potential role for targeting in making reemployment bonuses cost-effective and a useful policy tool.
II. The Reemployment Bonus Experiments and
Eligibility Screening
The first bonus experiment conducted in Illinois during 1984–85 esti-mated a 1.15 week reduction in the average duration of UI compensated unemployment in response to a $500 bonus offer for reemployment within 11 weeks (Woodbury and Spiegelman 1987). Subsequent experiments, attempting to validate the impressive Illinois findings, yielded more modest effect estimates. A 1985–86 experiment in New Jersey involving a bonus offer that declined with the duration of unemployment and reached zero after 12 weeks generated a more modest reduction in UI duration (Corson et al. 1989). To identify the ideal bonus amount and offer duration, two
additional experiments involving 11 different treatments were conducted in 1988–89, in Pennsylvania (Corson et al. 1992) and Washington (O’Leary, Spiegelman, and Kline 1995).
The bonus experiments had relatively few eligibility requirements for UI recipients to be included in the treatment or control groups. In the Washington experiment, the only condition was to meet the standard state UI eligibility requirement on prior earn-ings. To ensure that bonuses were directed to permanently separated employees, the Illinois and Pennsylvania experiments had additional requirements that recipients not have a specific date for recall to their prior job, and that they not be affiliated with a union hiring hall. The New Jersey experiment had all these conditions and also required that recipients be at least 25 years of age with at least three years on the prior job. The New Jersey requirements focused the experiment on recipients who were likely to be permanently displaced from a long-term job.
The eligibility conditions in these experiments were as inclusive as possible because there was no consensus on what screens might be adopted for an ongoing program. The inclusive sample design provided for ex post evaluation of eli-gibility restrictions. In this paper, we accomplish this by simulating the effects of dif-ferent targeting rules defined according to an estimated probability of UI benefit exhaustion.
III. Worker Profiling and Reemployment Bonus Effects
All states are now using WPRS systems to target reemployment serv-ices (Wandner 1997). Worker profiling is a two-step process: In the first step, perma-nently separated workers are identified by screening out those expecting recall to their previous employer and those subject to an exclusive union hiring hall agreement. The second step is to determine which of these permanently separated workers are expected to be long-term benefit recipients. In most states, this step involves predict-ing a recipient’s probability of exhaustpredict-ing UI benefits uspredict-ing a logit model estimated on historical state data (Olsen et al. 2002). The dependent variable in these logit mod-els is usually a binary outcome—whether or not the full UI benefit entitlement is exhausted. The independent variables in the model commonly include educational attainment, job tenure, employment growth in the previous industry and occupation, and the local unemployment rate. Variables for age, gender, and race are prohibited by civil rights considerations. When a worker opens a new claim for UI benefits, their personal and labor market characteristics are entered into a profiling equation to predict their probability of benefit exhaustion.
educa-tional attainment, job tenure, industry, and local unemployment rates. The Washington model also controls for each claimant’s previous occupation.2
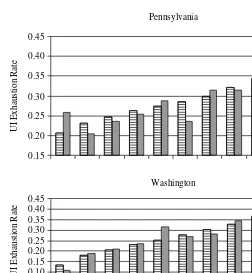
Based on the ordering of predicted probabilities of UI benefit exhaustion, Figure 1 shows the mean predicted probability of exhaustion for decile groups of the compar-ison samples contrasted to the actual proportion exhausting benefits in that group. The actual exhaustion rates tend to be higher for decile groups with higher predicted exhaustion rates.3For example, in Washington the actual exhaustion rate is 45 percent for the top decile group, compared with 11 percent for the bottom decile group. These findings also demonstrate that the predictive power of the model—even when used to
2. Details of the profiling models used are given in O’Leary, Decker, and Wandner (1998).
3. Because the results presented in Figure 1 were calculated using the same sample that was used to esti-mate the profiling model, these findings do not provide a truly fair test of the predictive power of the profil-ing model. The findprofil-ings presented later in the paper may therefore depend on havprofil-ing somewhat greater predictive power than would be available to a state that uses a similar regression model. On the other hand, states that develop more refined models of UI exhaustion may have comparable or even superior ability to predict exhaustion rates.
Figure 1
Predicted and Actual UI Exhaustion Rates
Pennsylvania
0.15 0.20 0.25 0.30 0.35 0.40 0.45
0.15 0.10 0.05 0.20 0.25 0.30 0.35 0.40 0.45
UI Exhaustion Rate
Washington
1 2 3 4 5 6 7 8 9 10 Decile of Predicted UI Exhaustion Rate
UI Exhaustion Rate
predict within sample—is somewhat modest.4That is, the model is unable to isolate groups of claimants who have either extremely high or low exhaustion probabilities. Prediction performance of the models is constrained, in part, by exclusion of the pro-hibited variables on age, gender, and race. Despite the limitations of the models, these are representative of what states have to work with in their actual WPRS programs.
Once the benefit exhaustion model has been estimated, the next step in developing rules for targeting bonus offers to claimants is to set an exhaustion probability to serve as the threshold for offering a bonus. To examine the effects of various targeting rules, we order predicted exhaustion probabilities from lowest to highest and compute treatment effects for marginal and cumulative decile groups in the distribution.
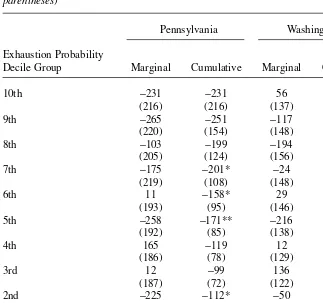
Estimates of the effect of the mean bonus offer on UI receipt are presented in Table 1 for differing bonus offer targeting thresholds defined at deciles of the distri-bution of the predicted UI exhaustion probability.5The first row of the table reports that the estimated mean effect of bonus offers made to the top 10 percent of the dis-tribution of predicted UI exhaustion probability in Pennsylvania is to reduce UI pay-ments by $231, but to increase them by $56 in Washington. Lowering the offer threshold by ten percentage points of the distribution, the marginal effects for the 9th decile group are −$265 in Pennsylvania and −$117 in Washington with the cumula-tive effects for the top 20 percent of the sample being −$251 in Pennsylvania and
−$40 in Washington. The rows of Table 1 present estimates of bonus offer effects as
the bonus offer threshold is gradually lowered in ten percentage point steps of the pre-dicted UI benefit exhaustion distribution. Estimates are given both for the marginal and cumulative groups in the distribution. Estimates are computed by contrasting ben-efit receipt of treatment group members with control group members in the same range of predicted probability of UI benefit exhaustion.
The estimates in Table 1 do not provide clear guidance for selecting the probability threshold that would maximize estimated bonus effects. For the Pennsylvania experi-ment, the 10th, 9th, 7th, and 2nd decile groups have the largest estimated effects. For the Washington experiment, the 8th and 5th decile groups have the greatest estimated effects.
These findings suggest that although the bonus offers may have larger effects on UI receipt for groups with higher predicted probabilities of benefit exhaustion, that is not necessarily the case. So that narrowly targeting bonus offers to those most likely to exhaust—such as those only in the top decile group—may not maximize the overall response. Given that targeting only the top of the distribution does not appear to be effective, we instead focus the rest of our analysis on the effects of targeting the bonus offer using two thresholds further down in the distribution—the 75th percentile and the 50th percentile.
4. Model performance can also be judged by contrasting the predicted probability of exhaustion between those who actually exhaust UI benefits and those who do not. For the control group, the mean predicted prob-ability among those who actually exhausted benefits was 1.6 percentage points higher in Pennsylvania and 2.0 percentage points higher in Washington than those who did not exhaust.
IV. Net Benefits of Targeted Bonus Offers
To examine the net benefits of targeted bonus offers, Table 2 presents estimates of all the elements required for computations: UI effects, bonus costs, and earnings effects. These estimates are presented for the top 25 percent and top 50 per-cent predicted as most likely to exhaust UI and for the full samples for each experi-ment. For additional insight, estimates are presented for both the mean of all bonus offers tested in each state as well as for the offer that generated the best net benefit results in both states: the low bonus amount/long qualification offer (O’Leary, Decker, and Wandner 1998).
Table 1
Effects of Combined Treatments on UI Benefit Dollars Paid Per Claimant for Decile Groups of the Predicted Probability of UI Benefit Exhaustion (Standard errors in parentheses)
Pennsylvania Washington
Exhaustion Probability
Decile Group Marginal Cumulative Marginal Cumulative
10th −231 −231 56 56
(216) (216) (137) (137)
9th −265 −251 −117 −40
(220) (154) (148) (101)
8th −103 −199 −194 −89
(205) (124) (156) (85)
7th −175 −201* −24 −72
(219) (108) (148) (74)
6th 11 −158* 29 −53
(193) (95) (146) (66)
5th −258 −171** −216 −82
(192) (85) (138) (60)
4th 165 −119 12 −72
(186) (78) (129) (55)
3rd 12 −99 136 −45
(187) (72) (122) (50)
2nd −225 −112* −50 −40
(184) (67) (115) (47)
1st −121 −113* 50 −30
(186) (63) (104) (44)
Sample size 5,199 5,199 12,144 12,144
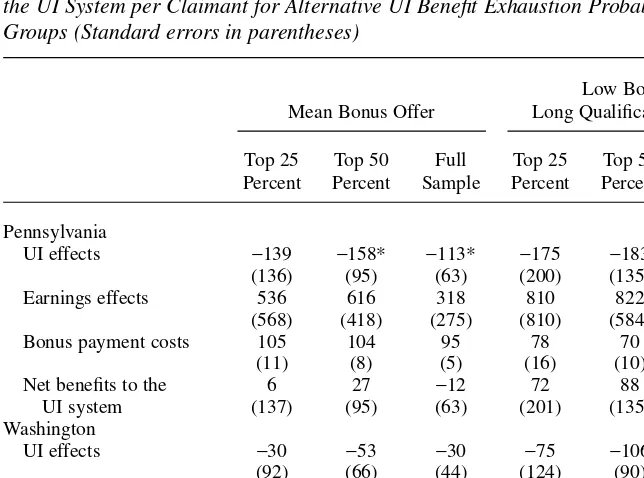
We take the perspective of the UI system to evaluate the effect of targeting on the esti-mated net benefits of the bonus offers. The UI system benefits from a bonus offer to the degree that UI payments decline and UI tax revenues rise from increased earnings. At the same time, the UI system incurs the costs of paying and administering the bonuses. For the combined bonus treatments, the estimated UI effects tend to be greater for the targeted recipients than for the full sample. For example, in Pennsylvania the esti-mated reductions in UI receipt are $139 for the top 25 percent of recipients and $158 for the top 50 percent of recipients, compared with $113 for the full sample. In Washington, the estimated reductions in UI receipt are $30 for the top 25 percent and $53 for the top 50 percent, compared with $30 for the full sample. Neither experi-ment provides any evidence that bonus effects on UI receipt are larger when narrowly targeted to the top 25 percent of recipients compared to targeting the top 50 percent. Estimated effects on earnings in the year after an initial UI claim show a consistent pattern: effects are larger for the targeted groups than for the full sample. For exam-ple, in Pennsylvania the estimated bonus effects on average earnings are $536 and $616 for the top 25 and 50 percent of recipients, respectively, compared with $318 for the full sample. A similar pattern exists for the Washington effects on earnings— estimated effects for the targeted recipients are higher than for the full sample— although all of the Washington estimates are negative.
Just as the UI benefit savings from the bonus offers tend to be greater when targeted to recipients with higher exhaustion probabilities, it also appears that the bonus costs are greater for the targeted groups. In both Pennsylvania and Washington, bonus pay-ment costs are slightly higher for the top 25 and 50 percent of recipients than for the full sample. The differences are modest in Pennsylvania, where the average bonus costs are $105 and $104 for the top 25 and top 50 percent of recipients, compared with $95 for the full sample. The differences are similarly small in Washington: $110 and $119 for the top 25 and top 50 percent, compared with $105 for the full sample.
Estimated net benefits to the UI system are computed as the dollar value of savings measured by UI effects, plus UI tax contributions on additional earnings, minus the sum of bonus payment and program administration costs. The current average UI tax contri-bution rates on earnings are 1.00 percent in Pennsylvania and 1.15 percent in Washington. Program administration cost was estimated to be $33 per offer in Pennsylvania and $3 in Washington (Corson et al. 1992; O’Leary, Spiegelman, and Kline 1995). Because of restricted sample sizes, the net benefit estimates presented in Table 2 are imprecisely estimated. Nonetheless, the pattern of point estimates is informative.
Targeting offers improves the estimated net benefits of the mean bonus offers. In both experiments, the net benefits per recipient are negative when estimated for the full sample: −$12 per recipient in Pennsylvania and −$86 per recipient in Washington.
In Pennsylvania, targeting improves net benefits per recipient to $6 for the top 25 per-cent of recipients, and to $27 for the top 50 perper-cent. In Washington, targeting the offers failed to generate positive net benefits, but estimated net costs are lower when targeting to the top 50 percent. Because the estimated net benefits are no greater for the top 25 percent than for the top 50 percent, they provide no indication that more exclusive targeting on the highest probabilities of exhaustion is a better strategy.
treatment in Pennsylvania offered a bonus equal to three times the weekly benefit amount (WBA) for reemployment within 12 weeks. This treatment was estimated to generate positive mean net benefits of $26 per offer, with estimated net benefits of $72 and $88 per offer respectively when targeting the top 25 percent and top 50 percent of the distribution of predicted exhaustion probabilities. In Washington the similar treat-ment offered a bonus of two times the WBA for reemploytreat-ment within about 13 weeks. Point estimates of net benefits reported in Table 2 are positive for the full and targeted samples with an estimated net benefit of $46 when targeted to the top half of the pre-dicted UI exhaustion probability distribution in Washington.
Among the 11 different bonus designs evaluated in Pennsylvania and Washington, the most cost-effective treatment design and targeting plan to emerge combines a low bonus amount with a long qualification period, targeted to the 50 percent most likely to exhaust UI benefits.6For example, a bonus amount set at three times the WBA,
Table 2
Estimated UI Effects, Earnings Effects, Bonus Payment Costs, and Net Benefits to the UI System per Claimant for Alternative UI Benefit Exhaustion Probability Groups (Standard errors in parentheses)
Low Bonus/ Mean Bonus Offer Long Qualification Offer
Top 25 Top 50 Full Top 25 Top 50 Full Percent Percent Sample Percent Percent Sample
Pennsylvania
UI effects −139 −158* −113* −175 −183 −114
(136) (95) (63) (200) (135) (91) Earnings effects 536 616 318 810 822 363 (568) (418) (275) (810) (584) (391) Bonus payment costs 105 104 95 78 70 59
(11) (8) (5) (16) (10) (7) Net benefits to the 6 27 −12 72 88 26
UI system (137) (95) (63) (201) (135) (91) Washington
UI effects −30 −53 −30 −75 −106 −74
(92) (66) (44) (124) (90) (59) Earnings effects −412 −106 −722 −260 649 119
(1,509) (849) (526) (2,287) (1,399) (897) Bonus payment costs 110 119 105 62 64 52
(6) (4) (3) (6) (5) (3)
Net benefits to the −88 −70 −86* 7 46 20
UI system (94) (67) (45) (127) (92) (60)
*Statistically significant at the 90 percent confidence level in a two-tailed test. **Statistically significant at the 95 percent confidence level in a two-tailed test.
with a qualification period 12 weeks long, and targeted to the half of claimants most likely to exhaust their UI benefit entitlement would be a good design. As summarized in Table 2, such a bonus offer should promote quicker return to work and on average generate net savings to the UI trust fund.
V. Caveats
Targeting with profiling models improves the appeal of the reemploy-ment bonus program for employreemploy-ment policy. However, two potential behavioral effects might reduce cost-effectiveness for an operational program (Meyer 1995): First, an actual bonus program could have a displacement effect. Displacement occurs if UI claimants who are offered a bonus increase their rate of reemployment at the expense of other job seekers not offered a bonus. Second, there is also the risk that an operational bonus offer program could induce an entry effect. That is, the availability of a reemployment bonus might result in a larger proportion of unemployed job seekers entering the UI system.
If entry and displacement effects are sizeable, actual program cost-effectiveness will be lowered. However, targeting low bonus amount—long qualification period offers only to those most likely to exhaust UI should reduce both these risks. Targeting would introduce uncertainty that a bonus offer would be forthcoming upon filing a UI claim, which should reduce the chance of a large entry effect. Also, tar-geting should reduce any potential for displacement, since a smaller proportion of claimants would receive the bonus offer.7
VI. Summary and Conclusions
Unemployment insurance (UI) provides labor force members with partial wage replacement during periods of involuntary unemployment. In performing this income maintenance function, the system potentially prolongs unemployment spells (Decker 1997). To reduce avoidable joblessness, most states require active job search by UI beneficiaries. In terms of carrot and stick incentives, such work search rules represent the stick.
In the 1980s, reemployment bonuses were tested as positive reemployment incentives by field experiments in the federal-state UI system. Reemployment bonuses were intended to speed return to work in a manner that would benefit employees, employers, and the government. Claimants were still provided the income security of UI, but if they returned to work sooner, system costs may have been lower. The original findings from the experiments did not generate over-whelming support for reemployment bonuses. We have reexamined the evidence to evaluate whether bonuses targeted to those most likely to exhaust UI benefits would be cost-effective.
Profiling models similar to those used by states as part of their Worker Profiling and Reemployment Services (WPRS) systems were used to identify UI claimants most likely to exhaust their benefits. Using such models to target reemployment bonus
offers to those claimants most likely to exhaust UI can increase the cost-effectiveness of bonus offers by generating larger average reductions in UI benefit payments than nontargeted bonus offers. However, estimated average benefit payments do not steadily decline as the eligibility screen is gradually tightened.
For several bonus designs, offers made to the top half of the distribution of claimants most likely to exhaust resulted in bigger benefit payment reductions than offers made to the top quarter of the distribution. While targeting may reduce bene-fit payments, however, it does not guarantee that bonus offers will yield positive net benefits. The average size of bonus payments is also significant.
The single treatment design that emerged as the best candidate for a targeted reem-ployment bonus is a low bonus amount with a long qualification period and a four-month reemployment requirement, targeted to the half of claimants most likely to exhaust their UI benefit entitlement. Our estimates suggest that such a targeted bonus offer would yield appreciable net benefits to the UI trust funds if implemented as a permanent program.
References
Corson, Walter, Paul T. Decker, Shari Miller Dunstan, and Anne R. Gordon. 1989. “The New Jersey Unemployment Insurance Reemployment Demonstration Project: Final Evaluation Report.” Unemployment Insurance Occasional Paper 89-3. Washington, D.C.: U. S. Department of Labor.
Corson, Walter, Paul Decker, Shari Dunstan, and Stuart Kerachsky. 1992. “Pennsylvania Reemployment Bonus Demonstration Final Report.” Unemployment Insurance Occasional Paper 92-1. Washington, D.C.: U. S. Department of Labor.
Davidson, Carl, and Stephen A. Woodbury. 1993. “The Displacement Effects of Reemployment Bonus Programs.” Journal of Labor Economics11(4):575–605.
Decker, Paul T. 1997. “Work Incentives and Disincentives.” In Unemployment Insurance in the United States: Analysis of Policy Issues, ed. Christopher J. O’Leary and Stephen A. Wandner, 285–320. Kalamazoo, Mich.: W. E. Upjohn Institute for Employment Research.
Decker, Paul T., and Christopher J. O’Leary. 1995. “Evaluating Pooled Evidence from the Reemployment Bonus Experiments.” Journal of Human Resources30(3): 534–50. Meyer, Bruce D. 1995. “Lessons from the U.S. Unemployment Insurance Experiments.”
Journal of Economic Literature33(1):91–131.
O’Leary, Christopher J., Paul T. Decker, and Stephen A. Wandner. 1998. “Reemployment Bonuses and Profiling.” Working Paper No. 98-51. Kalamazoo, Mich.: W.E. Upjohn Institute for Employment Research.
O’Leary, Christopher J., Robert G. Spiegelman, and Kenneth J. Kline. 1995. “Do Bonus Offers Shorten Unemployment Insurance Spells? Results from the Washington Experiment.” Journal of Policy Analysis and Management 14(2):245–69.
Olsen, Robert B., Marisa Kelso, Paul T. Decker, and Daniel H. Klepinger. 2002. “Predicting the Exhaustion of Unemployment Compensation.” In Targeting Employment Services, ed. Randall W. Eberts, Christopher J. O’Leary and Stephen A. Wandner, 29–55. Kalamazoo, MI: W.E. Upjohn Institute for Employment Research.
Wandner, Stephen A. 1997. “Early Reemployment for Dislocated Workers: A New United States Initiative.”International Social Security Review50(4):95–112.