http://www.tutorialspoint.com/dwh/dwh_quick_guide.htm Copyright © tutorialspoint.com
DATA WAREHOUSING - QUICK GUIDE
DATA WAREHOUSING - QUICK GUIDE
DATA WAREHOUSING - OVERVIEW
DATA WAREHOUSING - OVERVIEW
The term "Data Warehouse" was first coined by Bill Inmon in 1990. According to Inmon, a data warehouse is a subject oriented, integrated, time-variant, and non-volatile collection of data. This data helps analysts to take informed decisions in an organization.
An operational database undergoes frequent changes on a daily basis on account of the
transactions that take place. Suppose a business executive wants to analyze previous feedback on any data such as a product, a supplier, or any consumer data, then the executive will have no data available to analyze because the previous data has been updated due to transactions.
A data warehouses provides us generalized and consolidated data in multidimensional view. Along with generalized and consolidated view of data, a data warehouses also provides us Online
Analytical Processing (OLAP) tools. These tools help us in interactive and effective analysis of data in a multidimensional space. This analysis results in data generalization and data mining.
Data mining functions such as association, clustering, classification, prediction can be integrated with OLAP operations to enhance the interactive mining of knowledge at multiple level of
abstraction. That's why data warehouse has now become an important platform for data analysis and online analytical processing.
Understanding a Data Warehouse
A data warehouse is a database, which is kept separate from the organization's operational database.
There is no frequent updating done in a data warehouse.
It possesses consolidated historical data, which helps the organization to analyze its business.
A data warehouse helps executives to organize, understand, and use their data to take strategic decisions.
Data warehouse systems help in the integration of diversity of application systems.
A data warehouse system helps in consolidated historical data analysis.
Why a Data Warehouse is Separated from Operational Databases
A data warehouses is kept separate from operational databases due to the following reasons:
An operational database is constructed for well-known tasks and workloads such as searching particular records, indexing, etc. In contract, data warehouse queries are often complex and they present a general form of data.
Operational databases support concurrent processing of multiple transactions. Concurrency control and recovery mechanisms are required for operational databases to ensure
robustness and consistency of the database.
An operational database query allows to read and modify operations, while an OLAP query needs only read only access of stored data.
An operational database maintains current data. On the other hand, a data warehouse maintains historical data.
Data Warehouse Features
The key features of a data warehouse are discussed below:
product, customers, suppliers, sales, revenue, etc. A data warehouse does not focus on the ongoing operations, rather it focuses on modelling and analysis of data for decision making.
Integrated - A data warehouse is constructed by integrating data from heterogeneous sources such as relational databases, flat files, etc. This integration enhances the effective analysis of data.
Time Variant - The data collected in a data warehouse is identified with a particular time period. The data in a data warehouse provides information from the historical point of view.
Non-volatile - Non-volatile means the previous data is not erased when new data is added to it. A data warehouse is kept separate from the operational database and therefore frequent changes in operational database is not reflected in the data warehouse.
Note: A data warehouse does not require transaction processing, recovery, and concurrency controls, because it is physically stored and separate from the operational database.
Data Warehouse Applications
As discussed before, a data warehouse helps business executives to organize, analyze, and use their data for decision making. A data warehouse serves as a sole part of a plan-execute-assess "closed-loop" feedback system for the enterprise management. Data warehouses are widely used in the following fields:
Financial services
Banking services
Consumer goods
Retail sectors
Controlled manufacturing
Types of Data Warehouse
Information processing, analytical processing, and data mining are the three types of data warehouse applications that are discussed below:
Information Processing - A data warehouse allows to process the data stored in it. The data can be processed by means of querying, basic statistical analysis, reporting using crosstabs, tables, charts, or graphs.
Analytical Processing - A data warehouse supports analytical processing of the information stored in it. The data can be analyzed by means of basic OLAP operations, including slice-and-dice, drill down, drill up, and pivoting.
Data Mining - Data mining supports knowledge discovery by finding hidden patterns and associations, constructing analytical models, performing classification and prediction. These mining results can be presented using the visualization tools.
Sr.No. Data Warehouse (OLAP) Operational Database(OLTP)
1 It involves historical processing of information.
It involves day-to-day processing.
2 OLAP systems are used by knowledge workers such as executives, managers, and analysts.
OLTP systems are used by clerks, DBAs, or database professionals.
3 It is used to analyze the business. It is used to run the business.
4 It focuses on Information out. It focuses on Data in.
5 It is based on Star Schema, Snowflake Schema, and Fact Constellation Schema.
6 It focuses on Information out. It is application oriented.
7 It contains historical data. It contains current data.
8 It provides summarized and consolidated data.
It provides primitive and highly detailed data.
9 It provides summarized and multidimensional view of data.
It provides detailed and flat relational view of data.
10 The number of users is in hundreds. The number of users is in thousands.
11 The number of records accessed is in millions.
The number of records accessed is in tens.
12 The database size is from 100GB to 100 TB.
The database size is from 100 MB to 100 GB.
13 These are highly flexible. It provides high performance.
DATA WAREHOUSING - CONCEPTS
DATA WAREHOUSING - CONCEPTS
What is Data Warehousing?
Data warehousing is the process of constructing and using a data warehouse. A data warehouse is constructed by integrating data from multiple heterogeneous sources that support analytical reporting, structured and/or ad hoc queries, and decision making. Data warehousing involves data cleaning, data integration, and data consolidations.
Using Data Warehouse Information
There are decision support technologies that help utilize the data available in a data warehouse. These technologies help executives to use the warehouse quickly and effectively. They can gather data, analyze it, and take decisions based on the information present in the warehouse. The
information gathered in a warehouse can be used in any of the following domains:
Tuning Production Strategies - The product strategies can be well tuned by repositioning the products and managing the product portfolios by comparing the sales quarterly or yearly.
Customer Analysis - Customer analysis is done by analyzing the customer's buying preferences, buying time, budget cycles, etc.
Operations Analysis - Data warehousing also helps in customer relationship management, and making environmental corrections. The information also allows us to analyze business operations.
Integrating Heterogeneous Databases
To integrate heterogeneous databases, we have two approaches:
Query-driven Approach
Update-driven Approach
Query-Driven Approach
This is the traditional approach to integrate heterogeneous databases. This approach was used to build wrappers and integrators on top of multiple heterogeneous databases. These integrators are also known as mediators.
Process of Query-Driven Approach
appropriate from for individual heterogeneous sites involved.
Now these queries are mapped and sent to the local query processor.
The results from heterogeneous sites are integrated into a global answer set.
Disadvantages
Query-driven approach needs complex integration and filtering processes.
This approach is very inefficient.
It is very expensive for frequent queries.
This approach is also very expensive for queries that require aggregations.
Update-Driven Approach
This is an alternative to the traditional approach. Today's data warehouse systems follow update-driven approach rather than the traditional approach discussed earlier. In update-update-driven
approach, the information from multiple heterogeneous sources are integrated in advance and are stored in a warehouse. This information is available for direct querying and analysis.
Advantages
This approach has the following advantages:
This approach provide high performance.
The data is copied, processed, integrated, annotated, summarized and restructured in semantic data store in advance.
Query processing does not require an interface to process data at local sources.
Functions of Data Warehouse Tools and Utilities
The following are the functions of data warehouse tools and utilities:
Data Extraction - Involves gathering data from multiple heterogeneous sources.
Data Cleaning - Involves finding and correcting the errors in data.
Data Transformation - Involves converting the data from legacy format to warehouse format.
Data Loading - Involves sorting, summarizing, consolidating, checking integrity, and building indices and partitions.
Refreshing - Involves updating from data sources to warehouse.
Note: Data cleaning and data transformation are important steps in improving the quality of data and data mining results.
DATA WAREHOUSING - TERMINOLOGIES
DATA WAREHOUSING - TERMINOLOGIES
In this chapter, we will discuss some of the most commonly used terms in data warehousing.
Metadata
Metadata is simply defined as data about data. The data that are used to represent other data is known as metadata. For example, the index of a book serves as a metadata for the contents in the book. In other words, we can say that metadata is the summarized data that leads us to the
detailed data.
Metadata is a road-map to data warehouse.
Metadata in data warehouse defines the warehouse objects.
Metadata acts as a directory. This directory helps the decision support system to locate the contents of a data warehouse.
Metadata Repository
Metadata repository is an integral part of a data warehouse system. It contains the following metadata:
Business metadata - It contains the data ownership information, business definition, and changing policies.
Operational metadata - It includes currency of data and data lineage. Currency of data refers to the data being active, archived, or purged. Lineage of data means history of data migrated and transformation applied on it.
Data for mapping from operational environment to data warehouse - It metadata includes source databases and their contents, data extraction, data partition, cleaning, transformation rules, data refresh and purging rules.
The algorithms for summarization - It includes dimension algorithms, data on granularity, aggregation, summarizing, etc.
Data Cube
A data cube helps us represent data in multiple dimensions. It is defined by dimensions and facts. The dimensions are the entities with respect to which an enterprise preserves the records.
Illustration of Data Cube
Suppose a company wants to keep track of sales records with the help of sales data warehouse with respect to time, item, branch, and location. These dimensions allow to keep track of monthly sales and at which branch the items were sold. There is a table associated with each dimension. This table is known as dimension table. For example, "item" dimension table may have attributes such as item_name, item_type, and item_brand.
The following table represents the 2-D view of Sales Data for a company with respect to time, item, and location dimensions.
The above 3-D table can be represented as 3-D data cube as shown in the following figure:
Data Mart
Data marts contain a subset of organization-wide data that is valuable to specific groups of people in an organization. In other words, a data mart contains only those data that is specific to a
particular group. For example, the marketing data mart may contain only data related to items, customers, and sales. Data marts are confined to subjects.
Points to Remember About Data Marts
Windows-based or Unix/Linux-based servers are used to implement data marts. They are implemented on low-cost servers.
The implementation cycle of a data mart is measured in short periods of time, i.e., in weeks rather than months or years.
The life cycle of data marts may be complex in the long run, if their planning and design are not organization-wide.
Data marts are small in size.
Data marts are customized by department.
The source of a data mart is departmentally structured data warehouse.
The following figure shows a graphical representation of data marts.
Virtual Warehouse
The view over an operational data warehouse is known as virtual warehouse. It is easy to build a virtual warehouse. Building a virtual warehouse requires excess capacity on operational database servers.
DATA WAREHOUSING - DELIVERY PROCESS
DATA WAREHOUSING - DELIVERY PROCESS
A data warehouse is never static; it evolves as the business expands. As the business evolves, its requirements keep changing and therefore a data warehouse must be designed to ride with these changes. Hence a data warehouse system needs to be flexible.
Ideally there should be a delivery process to deliver a data warehouse. However data warehouse projects normally suffer from various issues that make it difficult to complete tasks and
deliverables in the strict and ordered fashion demanded by the waterfall method. Most of the times, the requirements are not understood completely. The architectures, designs, and build components can be completed only after gathering and studying all the requirements.
Delivery Method
The delivery method is a variant of the joint application development approach adopted for the delivery of a data warehouse. We have staged the data warehouse delivery process to minimize risks. The approach that we will discuss here does not reduce the overall delivery time-scales but ensures the business benefits are delivered incrementally through the development process.
Note: The delivery process is broken into phases to reduce the project and delivery risk.
IT Strategy
Data warehouse are strategic investments that require a business process to generate benefits. IT Strategy is required to procure and retain funding for the project.
Business Case
The objective of business case is to estimate business benefits that should be derived from using a data warehouse. These benefits may not be quantifiable but the projected benefits need to be clearly stated. If a data warehouse does not have a clear business case, then the business tends to suffer from credibility problems at some stage during the delivery process. Therefore in data warehouse projects, we need to understand the business case for investment.
Education and Prototyping
Organizations experiment with the concept of data analysis and educate themselves on the value of having a data warehouse before settling for a solution. This is addressed by prototyping. It helps in understanding the feasibility and benefits of a data warehouse. The prototyping activity on a small scale can promote educational process as long as:
The prototype addresses a defined technical objective.
The prototype can be thrown away after the feasibility concept has been shown.
The activity addresses a small subset of eventual data content of the data warehouse.
The activity timescale is non-critical.
The following points are to be kept in mind to produce an early release and deliver business benefits.
Identify the architecture that is capable of evolving.
Focus on business requirements and technical blueprint phases.
Limit the scope of the first build phase to the minimum that delivers business benefits.
Understand the short-term and medium-term requirements of the data warehouse.
Business Requirements
To provide quality deliverables, we should make sure the overall requirements are understood. If we understand the business requirements for both short-term and medium-term, then we can design a solution to fulfil short-term requirements. The short-term solution can then be grown to a full solution.
The following aspects are determined in this stage:
Things to determine in this stage are following.
The business rule to be applied on data.
The logical model for information within the data warehouse.
The query profiles for the immediate requirement.
Technical Blueprint
This phase need to deliver an overall architecture satisfying the long term requirements. This phase also deliver the components that must be implemented in a short term to derive any business benefit. The blueprint need to identify the followings.
The overall system architecture.
The data retention policy.
The backup and recovery strategy.
The server and data mart architecture.
The capacity plan for hardware and infrastructure.
The components of database design.
Building the version
In this stage, the first production deliverable is produced. This production deliverable is the smallest component of a data warehouse. This smallest component adds business benefit.
History Load
This is the phase where the remainder of the required history is loaded into the data warehouse. In this phase, we do not add new entities, but additional physical tables would probably be created to store increased data volumes.
Let us take an example. Suppose the build version phase has delivered a retail sales analysis data warehouse with 2 months’ worth of history. This information will allow the user to analyze only the recent trends and address the short-term issues. The user in this case cannot identify annual and seasonal trends. To help him do so, last 2 years’ sales history could be loaded from the archive. Now the 40GB data is extended to 400GB.
Note: The backup and recovery procedures may become complex, therefore it is recommended to perform this activity within a separate phase.
Ad hoc Query
In this phase, we configure an ad hoc query tool that is used to operate a data warehouse. These tools can generate the database query.
Note: It is recommended not to use these access tools when the database is being substantially modified.
Automation
In this phase, operational management processes are fully automated. These would include:
Transforming the data into a form suitable for analysis.
Monitoring query profiles and determining appropriate aggregations to maintain system performance.
Extracting and loading data from different source systems.
Generating aggregations from predefined definitions within the data warehouse.
Backing up, restoring, and archiving the data.
Extending Scope
In this phase, the data warehouse is extended to address a new set of business requirements. The scope can be extended in two ways:
By introducing new data marts using the existing information.
Note: This phase should be performed separately, since it involves substantial efforts and complexity.
Requirements Evolution
From the perspective of delivery process, the requirements are always changeable. They are not static. The delivery process must support this and allow these changes to be reflected within the system.
This issue is addressed by designing the data warehouse around the use of data within business processes, as opposed to the data requirements of existing queries.
The architecture is designed to change and grow to match the business needs, the process operates as a pseudo-application development process, where the new requirements are continually fed into the development activities and the partial deliverables are produced. These partial deliverables are fed back to the users and then reworked ensuring that the overall system is continually updated to meet the business needs.
DATA WAREHOUSING - SYSTEM PROCESSES
DATA WAREHOUSING - SYSTEM PROCESSES
We have a fixed number of operations to be applied on the operational databases and we have well-defined techniques such as use normalized data, keep table small, etc. These techniques are suitable for delivering a solution. But in case of decision-support systems, we do not know what query and operation needs to be executed in future. Therefore techniques applied on operational databases are not suitable for data warehouses.
In this chapter, we will discuss how to build data warehousing solutions on top open-system technologies like Unix and relational databases.
Process Flow in Data Warehouse
There are four major processes that contribute to a data warehouse:
Extract and load the data.
Cleaning and transforming the data.
Backup and archive the data.
Managing queries and directing them to the appropriate data sources.
Extract and Load Process
Data extraction takes data from the source systems. Data load takes the extracted data and loads it into the data warehouse.
external sources must be reconstructed.
Controlling the Process
Controlling the process involves determining when to start data extraction and the consistency check on data. Controlling process ensures that the tools, the logic modules, and the programs are executed in correct sequence and at correct time.
When to Initiate Extract
Data needs to be in a consistent state when it is extracted, i.e., the data warehouse should represent a single, consistent version of the information to the user.
For example, in a customer profiling data warehouse in telecommunication sector, it is illogical to merge the list of customers at 8 pm on Wednesday from a customer database with the customer subscription events up to 8 pm on Tuesday. This would mean that we are finding the customers for whom there are no associated subscriptions.
Loading the Data
After extracting the data, it is loaded into a temporary data store where it is cleaned up and made consistent.
Note: Consistency checks are executed only when all the data sources have been loaded into the temporary data store.
Clean and Transform Process
Once the data is extracted and loaded into the temporary data store, it is time to perform Cleaning and Transforming. Here is the list of steps involved in Cleaning and Transforming:
Clean and transform the loaded data into a structure
Partition the data
Aggregation
Clean and Transform the Loaded Data into a Structure
Cleaning and transforming the loaded data helps speed up the queries. It can be done by making the data consistent:
within itself.
with other data within the same data source.
with the data in other source systems.
with the existing data present in the warehouse.
Transforming involves converting the source data into a structure. Structuring the data increases the query performance and decreases the operational cost. The data contained in a data
warehouse must be transformed to support performance requirements and control the ongoing operational costs.
Partition the Data
It will optimize the hardware performance and simplify the management of data warehouse. Here we partition each fact table into multiple separate partitions.
Aggregation
Aggregation is required to speed up common queries. Aggregation relies on the fact that most common queries will analyze a subset or an aggregation of the detailed data.
In order to recover the data in the event of data loss, software failure, or hardware failure, it is necessary to keep regular back ups. Archiving involves removing the old data from the system in a format that allow it to be quickly restored whenever required.
For example, in a retail sales analysis data warehouse, it may be required to keep data for 3 years with the latest 6 months data being kept online. In such as scenario, there is often a requirement to be able to do month-on-month comparisons for this year and last year. In this case, we require some data to be restored from the archive.
Query Management Process
This process performs the following functions:
manages the queries.
helps speed up the execution time of queris.
directs the queries to their most effective data sources.
ensures that all the system sources are used in the most effective way.
monitors actual query profiles.
The information generated in this process is used by the warehouse management process to determine which aggregations to generate. This process does not generally operate during the regular load of information into data warehouse.
DATA WAREHOUSING - ARCHITECTURE
DATA WAREHOUSING - ARCHITECTURE
In this chapter, we will discuss the business analysis framework for the data warehouse design and architecture of a data warehouse.
Business Analysis Framework
The business analyst get the information from the data warehouses to measure the performance and make critical adjustments in order to win over other business holders in the market. Having a data warehouse offers the following advantages:
Since a data warehouse can gather information quickly and efficiently, it can enhance business productivity.
A data warehouse provides us a consistent view of customers and items, hence, it helps us manage customer relationship.
A data warehouse also helps in bringing down the costs by tracking trends, patterns over a long period in a consistent and reliable manner.
To design an effective and efficient data warehouse, we need to understand and analyze the business needs and construct a business analysis framework. Each person has different views regarding the design of a data warehouse. These views are as follows:
The top-down view - This view allows the selection of relevant information needed for a data warehouse.
The data source view - This view presents the information being captured, stored, and managed by the operational system.
The data warehouse view - This view includes the fact tables and dimension tables. It represents the information stored inside the data warehouse.
The business query view - It is the view of the data from the viewpoint of the end-user.
Three-Tier Data Warehouse Architecture
Bottom Tier - The bottom tier of the architecture is the data warehouse database server. It is the relational database system. We use the back end tools and utilities to feed data into the bottom tier. These back end tools and utilities perform the Extract, Clean, Load, and refresh functions.
Middle Tier - In the middle tier, we have the OLAP Server that can be implemented in either of the following ways.
By Relational OLAP (ROLAP), which is an extended relational database management system. The ROLAP maps the operations on multidimensional data to standard relational operations.
By Multidimensional OLAP (MOLAP) model, which directly implements the multidimensional data and operations.
Top-Tier - This tier is the front-end client layer. This layer holds the query tools and reporting tools, analysis tools and data mining tools.
The following diagram depicts the three-tier architecture of data warehouse:
Data Warehouse Models
From the perspective of data warehouse architecture, we have the following data warehouse models:
Virtual Warehouse
Data mart
Enterprise Warehouse
Virtual Warehouse
The view over an operational data warehouse is known as a virtual warehouse. It is easy to build a virtual warehouse. Building a virtual warehouse requires excess capacity on operational database servers.
Data mart contains a subset of organization-wide data. This subset of data is valuable to specific groups of an organization.
In other words, we can claim that data marts contain data specific to a particular group. For example, the marketing data mart may contain data related to items, customers, and sales. Data marts are confined to subjects.
Points to remember about data marts:
Window-based or Unix/Linux-based servers are used to implement data marts. They are implemented on low-cost servers.
The implementation data mart cycles is measured in short periods of time, i.e., in weeks rather than months or years.
The life cycle of a data mart may be complex in long run, if its planning and design are not organization-wide.
Data marts are small in size.
Data marts are customized by department.
The source of a data mart is departmentally structured data warehouse.
Data mart are flexible.
Enterprise Warehouse
An enterprise warehouse collects all the information and the subjects spanning an entire organization
It provides us enterprise-wide data integration.
The data is integrated from operational systems and external information providers.
This information can vary from a few gigabytes to hundreds of gigabytes, terabytes or beyond.
Load Manager
This component performs the operations required to extract and load process.
The size and complexity of the load manager varies between specific solutions from one data warehouse to other.
Load Manager Architecture
The load manager performs the following functions:
Extract the data from source system.
Fast Load the extracted data into temporary data store.
Extract Data from Source
The data is extracted from the operational databases or the external information providers. Gateways is the application programs that are used to extract data. It is supported by underlying DBMS and allows client program to generate SQL to be executed at a server. Open Database Connection(ODBC), Java Database Connection (JDBC), are examples of gateway.
Fast Load
In order to minimize the total load window the data need to be loaded into the warehouse in the fastest possible time.
The transformations affects the speed of data processing.
It is more effective to load the data into relational database prior to applying transformations and checks.
Gateway technology proves to be not suitable, since they tend not be performant when large data volumes are involved.
Simple Transformations
While loading it may be required to perform simple transformations. After this has been completed we are in position to do the complex checks. Suppose we are loading the EPOS sales transaction we need to perform the following checks:
Strip out all the columns that are not required within the warehouse.
Convert all the values to required data types.
Warehouse Manager
A warehouse manager is responsible for the warehouse management process. It consists of third-party system software, C programs, and shell scripts.
The size and complexity of warehouse managers varies between specific solutions.
Warehouse Manager Architecture
A warehouse manager includes the following:
The controlling process
Stored procedures or C with SQL
Backup/Recovery tool
Operations Performed by Warehouse Manager
A warehouse manager analyzes the data to perform consistency and referential integrity checks.
Creates indexes, business views, partition views against the base data.
Generates new aggregations and updates existing aggregations. Generates normalizations.
Transforms and merges the source data into the published data warehouse.
Backup the data in the data warehouse.
Archives the data that has reached the end of its captured life.
Note: A warehouse Manager also analyzes query profiles to determine index and aggregations are appropriate.
Query Manager
Query manager is responsible for directing the queries to the suitable tables.
By directing the queries to appropriate tables, the speed of querying and response generation can be increased.
Query manager is responsible for scheduling the execution of the queries posed by the user.
Query Manager Architecture
The following screenshot shows the architecture of a query manager. It includes the following:
Query redirection via C tool or RDBMS
Stored procedures
Query management tool
Query scheduling via C tool or RDBMS
Detailed Information
Detailed information is not kept online, rather it is aggregated to the next level of detail and then archived to tape. The detailed information part of data warehouse keeps the detailed information in the starflake schema. Detailed information is loaded into the data warehouse to supplement the aggregated data.
The following diagram shows a pictorial impression of where detailed information is stored and how it is used.
Note: If detailed information is held offline to minimize disk storage, we should make sure that the data has been extracted, cleaned up, and transformed into starflake schema before it is archived.
Summary Information
Summary Information is a part of data warehouse that stores predefined aggregations. These aggregations are generated by the warehouse manager. Summary Information must be treated as transient. It changes on-the-go in order to respond to the changing query profiles.
Points to remember about summary information.
Summary information speeds up the performance of common queries.
It needs to be updated whenever new data is loaded into the data warehouse.
It may not have been backed up, since it can be generated fresh from the detailed information.
DATA WAREHOUSING - OLAP
DATA WAREHOUSING - OLAP
Online Analytical Processing Server (OLAP) is based on the multidimensional data model. It allows managers, and analysts to get an insight of the information through fast, consistent, and
interactive access to information. This chapter cover the types of OLAP, operations on OLAP, difference between OLAP, and statistical databases and OLTP.
Types of OLAP Servers
We have four types of OLAP servers:
Relational OLAP (ROLAP)
Multidimensional OLAP (MOLAP)
Hybrid OLAP (HOLAP)
Specialized SQL Servers
Relational OLAP
ROLAP servers are placed between relational back-end server and client front-end tools. To store and manage warehouse data, ROLAP uses relational or extended-relational DBMS.
ROLAP includes the following:
Implementation of aggregation navigation logic.
Optimization for each DBMS back end.
Additional tools and services.
Multidimensional OLAP
MOLAP uses array-based multidimensional storage engines for multidimensional views of data. With multidimensional data stores, the storage utilization may be low if the data set is sparse. Therefore, many MOLAP server use two levels of data storage representation to handle dense and sparse data sets.
Hybrid OLAP (HOLAP)
Hybrid OLAP is a combination of both ROLAP and MOLAP. It offers higher scalability of ROLAP and faster computation of MOLAP. HOLAP servers allows to store the large data volumes of detailed information. The aggregations are stored separately in MOLAP store.
Specialized SQL Servers
Specialized SQL servers provide advanced query language and query processing support for SQL queries over star and snowflake schemas in a read-only environment.
OLAP Operations
Since OLAP servers are based on multidimensional view of data, we will discuss OLAP operations in multidimensional data.
Here is the list of OLAP operations:
Roll-up
Drill-down
Pivot (rotate)
Roll-up
Roll-up performs aggregation on a data cube in any of the following ways:
By climbing up a concept hierarchy for a dimension
By dimension reduction
The following diagram illustrates how roll-up works.
Roll-up is performed by climbing up a concept hierarchy for the dimension location.
Initially the concept hierarchy was "street < city < province < country".
On rolling up, the data is aggregated by ascending the location hierarchy from the level of city to the level of country.
The data is grouped into cities rather than countries.
When roll-up is performed, one or more dimensions from the data cube are removed.
Drill-down
Drill-down is the reverse operation of roll-up. It is performed by either of the following ways:
By stepping down a concept hierarchy for a dimension
By introducing a new dimension.
Drill-down is performed by stepping down a concept hierarchy for the dimension time.
Initially the concept hierarchy was "day < month < quarter < year."
On drilling down, the time dimension is descended from the level of quarter to the level of month.
When drill-down is performed, one or more dimensions from the data cube are added.
It navigates the data from less detailed data to highly detailed data.
Slice
Here Slice is performed for the dimension "time" using the criterion time = "Q1".
It will form a new sub-cube by selecting one or more dimensions.
Dice
Dice selects two or more dimensions from a given cube and provides a new sub-cube. Consider the following diagram that shows the dice operation.
The dice operation on the cube based on the following selection criteria involves three dimensions.
(location = "Toronto" or "Vancouver")
(time = "Q1" or "Q2")
(item =" Mobile" or "Modem")
Pivot
In this the item and location axes in 2-D slice are rotated.
OLAP vs OLTP
Sr.No. Data Warehouse (OLAP) Operational Database (OLTP)
1 Involves historical processing of information.
Involves day-to-day processing.
2 OLAP systems are used by knowledge workers such as executives, managers and analysts.
OLTP systems are used by clerks, DBAs, or database professionals.
3 Useful in analyzing the business. Useful in running the business.
4 It focuses on Information out. It focuses on Data in.
5 Based on Star Schema, Snowflake, Schema and Fact Constellation Schema.
Based on Entity Relationship Model.
6 Contains historical data. Contains current data.
7 Provides summarized and consolidated data.
Provides primitive and highly detailed data.
8 Provides summarized and multidimensional view of data.
Provides detailed and flat relational view of data.
9 Number or users is in hundreds. Number of users is in thousands.
10 Number of records accessed is in millions. Number of records accessed is in tens.
12 Highly flexible. Provides high performance.
DATA WAREHOUSING - RELATIONAL OLAP
DATA WAREHOUSING - RELATIONAL OLAP
Relational OLAP servers are placed between relational back-end server and client front-end tools. To store and manage the warehouse data, the relational OLAP uses relational or
extended-relational DBMS.
ROLAP includes the following:
Implementation of aggregation navigation logic
Optimization for each DBMS back-end
Additional tools and services
Points to Remember
ROLAP servers are highly scalable.
ROLAP tools analyze large volumes of data across multiple dimensions.
ROLAP tools store and analyze highly volatile and changeable data.
Relational OLAP Architecture
ROLAP includes the following components:
Database server
ROLAP server
Front-end tool.
Advantages
ROLAP servers can be easily used with existing RDBMS.
Data can be stored efficiently, since no zero facts can be stored.
ROLAP tools do not use pre-calculated data cubes.
DSS server of micro-strategy adopts the ROLAP approach.
Disadvantages
Poor query performance.
Some limitations of scalability depending on the technology architecture that is utilized.
Multidimensional OLAP (MOLAP) uses array-based multidimensional storage engines for
multidimensional views of data. With multidimensional data stores, the storage utilization may be low if the data set is sparse. Therefore, many MOLAP servers use two levels of data storage
representation to handle dense and sparse data-sets.
Points to Remember:
MOLAP tools process information with consistent response time regardless of level of summarizing or calculations selected.
MOLAP tools need to avoid many of the complexities of creating a relational database to store data for analysis.
MOLAP tools need fastest possible performance.
MOLAP server adopts two level of storage representation to handle dense and sparse data sets.
Denser sub-cubes are identified and stored as array structure.
Sparse sub-cubes employ compression technology.
MOLAP Architecture
MOLAP includes the following components:
Database server.
MOLAP server.
Front-end tool.
Advantages
MOLAP allows fastest indexing to the pre-computed summarized data.
Helps the users connected to a network who need to analyze larger, less-defined data.
Easier to use, therefore MOLAP is suitable for inexperienced users.
Disadvantages
MOLAP are not capable of containing detailed data.
The storage utilization may be low if the data set is sparse.
MOLAP vs ROLAP
1 Information retrieval is fast. Information retrieval is comparatively slow.
2 Uses sparse array to store data-sets. Uses relational table.
3 MOLAP is best suited for inexperienced users, since it is very easy to use.
ROLAP is best suited for experienced users.
4 Maintains a separate database for data cubes.
It may not require space other than available in the Data warehouse.
5 DBMS facility is weak. DBMS facility is strong.
DATA WAREHOUSING - SCHEMAS
DATA WAREHOUSING - SCHEMAS
Schema is a logical description of the entire database. It includes the name and description of records of all record types including all associated data-items and aggregates. Much like a database, a data warehouse also requires to maintain a schema. A database uses relational model, while a data warehouse uses Star, Snowflake, and Fact Constellation schema. In this chapter, we will discuss the schemas used in a data warehouse.
Star Schema
Each dimension in a star schema is represented with only one-dimension table.
This dimension table contains the set of attributes.
The following diagram shows the sales data of a company with respect to the four dimensions, namely time, item, branch, and location.
There is a fact table at the center. It contains the keys to each of four dimensions.
The fact table also contains the attributes, namely dollars sold and units sold.
Note: Each dimension has only one dimension table and each table holds a set of attributes. For example, the location dimension table contains the attribute set {location_key, street, city, province_or_state,country}. This constraint may cause data redundancy. For example,
"Vancouver" and "Victoria" both the cities are in the Canadian province of British Columbia. The entries for such cities may cause data redundancy along the attributes province_or_state and country.
Snowflake Schema
The normalization splits up the data into additional tables.
Unlike Star schema, the dimensions table in a snowflake schema are normalized. For
example, the item dimension table in star schema is normalized and split into two dimension tables, namely item and supplier table.
Now the item dimension table contains the attributes item_key, item_name, type, brand, and supplier-key.
The supplier key is linked to the supplier dimension table. The supplier dimension table contains the attributes supplier_key and supplier_type.
<>Note: Due to normalization in the Snowflake schema, the redundancy is reduced and therefore, it becomes easy to maintain and the save storage space.
Fact Constellation Schema
A fact constellation has multiple fact tables. It is also known as galaxy schema.
The following diagram shows two fact tables, namely sales and shipping.
The sales fact table is same as that in the star schema.
from_location, to_location.
The shipping fact table also contains two measures, namely dollars sold and units sold.
It is also possible to share dimension tables between fact tables. For example, time, item, and location dimension tables are shared between the sales and shipping fact table.
Schema Definition
Multidimensional schema is defined using Data Mining Query Language (DMQL). The two
primitives, cube definition and dimension definition, can be used for defining the data warehouses and data marts.
Syntax for Cube Definition
define cube < cube_name > [ < dimension-list > }: < measure_list >
Syntax for Dimension Definition
define dimension < dimension_name > as ( < attribute_or_dimension_list > )
Star Schema Definition
The star schema that we have discussed can be defined using Data Mining Query Language (DMQL) as follows:
define cube sales star [time, item, branch, location]:
dollars sold = sum(sales in dollars), units sold = count(*)
define dimension time as (time key, day, day of week, month, quarter, year)
define dimension item as (item key, item name, brand, type, supplier type) define dimension branch as (branch key, branch name, branch type) define dimension location as (location key, street, city, province or state, country)
Snowflake Schema Definition
Snowflake schema can be defined using DMQL as follows:
define cube sales snowflake [time, item, branch, location]:
dollars sold = sum(sales in dollars), units sold = count(*)
define dimension time as (time key, day, day of week, month, quarter, year)
define dimension item as (item key, item name, brand, type, supplier (supplier key, supplier type))
define dimension branch as (branch key, branch name, branch type)
define dimension location as (location key, street, city (city key, city, province or state, country))
Fact Constellation Schema Definition
Fact constellation schema can be defined using DMQL as follows:
define cube sales [time, item, branch, location]:
dollars sold = sum(sales in dollars), units sold = count(*)
define dimension time as (time key, day, day of week, month, quarter, year) define dimension item as (item key, item name, brand, type, supplier type) define dimension branch as (branch key, branch name, branch type)
dollars cost = sum(cost in dollars), units shipped = count(*)
define dimension time as time in cube sales define dimension item as item in cube sales
define dimension shipper as (shipper key, shipper name, location as location in cube sales, shipper type)
define dimension from location as location in cube sales define dimension to location as location in cube sales
DATA WAREHOUSING - PARTITIONING STRATEGY
DATA WAREHOUSING - PARTITIONING STRATEGY
Partitioning is done to enhance performance and facilitate easy management of data. Partitioning also helps in balancing the various requirements of the system. It optimizes the hardware
performance and simplifies the management of data warehouse by partitioning each fact table into multiple separate partitions. In this chapter, we will discuss different partitioning strategies.
Why is it Necessary to Partition?
Partitioning is important for the following reasons:
For easy management,
To assist backup/recovery,
To enhance performance.
For Easy Management
The fact table in a data warehouse can grow up to hundreds of gigabytes in size. This huge size of fact table is very hard to manage as a single entity. Therefore it needs partitioning.
To Assist Backup/Recovery
If we do not partition the fact table, then we have to load the complete fact table with all the data. Partitioning allows us to load only as much data as is required on a regular basis. It reduces the time to load and also enhances the performance of the system.
Note: To cut down on the backup size, all partitions other than the current partition can be marked as read-only. We can then put these partitions into a state where they cannot be modified. Then they can be backed up. It means only the current partition is to be backed up.
To Enhance Performance
By partitioning the fact table into sets of data, the query procedures can be enhanced. Query performance is enhanced because now the query scans only those partitions that are relevant. It does not have to scan the whole data.
Horizontal Partitioning
There are various ways in which a fact table can be partitioned. In horizontal partitioning, we have to keep in mind the requirements for manageability of the data warehouse.
Partitioning by Time into Equal Segments
In this partitioning strategy, the fact table is partitioned on the basis of time period. Here each time period represents a significant retention period within the business. For example, if the user
queries for month to date data then it is appropriate to partition the data into monthly segments. We can reuse the partitioned tables by removing the data in them.
Partition by Time into Different-sized Segments
Points to Note
The detailed information remains available online.
The number of physical tables is kept relatively small, which reduces the operating cost.
This technique is suitable where a mix of data dipping recent history and data mining through entire history is required.
This technique is not useful where the partitioning profile changes on a regular basis, because repartitioning will increase the operation cost of data warehouse.
Partition on a Different Dimension
The fact table can also be partitioned on the basis of dimensions other than time such as product group, region, supplier, or any other dimension. Let's have an example.
Suppose a market function has been structured into distinct regional departments like on a state by state basis. If each region wants to query on information captured within its region, it would prove to be more effective to partition the fact table into regional partitions. This will cause the queries to speed up because it does not require to scan information that is not relevant.
Points to Note
The query does not have to scan irrelevant data which speeds up the query process.
This technique is not appropriate where the dimensions are unlikely to change in future. So, it is worth determining that the dimension does not change in future.
If the dimension changes, then the entire fact table would have to be repartitioned.
Note: We recommend to perform the partition only on the basis of time dimension, unless you are certain that the suggested dimension grouping will not change within the life of the data
warehouse.
Partition by Size of Table
When there are no clear basis for partitioning the fact table on any dimension, then we should
partition the fact table on the basis of their size. We can set the predetermined size as a critical point. When the table exceeds the predetermined size, a new table partition is created.
Points to Note
This partitioning is complex to manage.
It requires metadata to identify what data is stored in each partition.
Partitioning Dimensions
If a dimension contains large number of entries, then it is required to partition the dimensions. Here we have to check the size of a dimension.
Round Robin Partitions
In the round robin technique, when a new partition is needed, the old one is archived. It uses metadata to allow user access tool to refer to the correct table partition.
This technique makes it easy to automate table management facilities within the data warehouse.
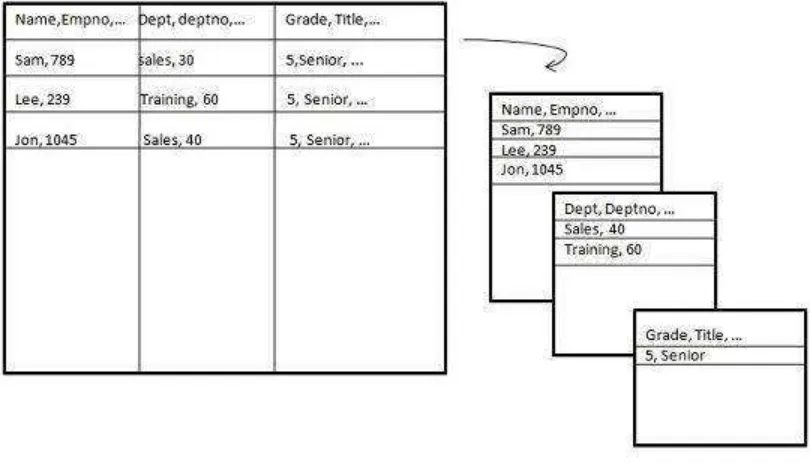
Vertical Partition
Vertical partitioning, splits the data vertically. The following images depicts how vertical partitioning is done.
Vertical partitioning can be performed in the following two ways:
Normalization
Row Splitting
Normalization
[image:30.595.99.504.184.416.2]Normalization is the standard relational method of database organization. In this method, the rows are collapsed into a single row, hence it reduce space. Take a look at the following tables that show how normalization is performed.
Table before Normalization
Product_id Qty Value sales_date Store_id Store_name Location Region
30 5 3.67 3-Aug-13 16 sunny Bangalore S
35 4 5.33 3-Sep-13 16 sunny Bangalore S
40 5 2.50 3-Sep-13 64 san Mumbai W
45 7 5.66 3-Sep-13 16 sunny Bangalore S
Table after Normalization
[image:30.595.34.534.612.725.2]16 sunny Bangalore W
64 san Mumbai S
Product_id Quantity Value sales_date Store_id
30 5 3.67 3-Aug-13 16
35 4 5.33 3-Sep-13 16
40 5 2.50 3-Sep-13 64
45 7 5.66 3-Sep-13 16
Row Splitting
Row splitting tends to leave a one-to-one map between partitions. The motive of row splitting is to speed up the access to large table by reducing its size.
Note: While using vertical partitioning, make sure that there is no requirement to perform a major join operation between two partitions.
Identify Key to Partition
It is very crucial to choose the right partition key. Choosing a wrong partition key will lead to reorganizing the fact table. Let's have an example. Suppose we want to partition the following table.
Acco unt_T xn_T abl e transaction_id account_id transaction_type value
transaction_date region
branch_name
We can choose to partition on any key. The two possible keys could be
region
transaction_date
Suppose the business is organized in 30 geographical regions and each region has different number of branches. That will give us 30 partitions, which is reasonable. This partitioning is good enough because our requirements capture has shown that a vast majority of queries are restricted to the user's own business region.
If we partition by transaction_date instead of region, then the latest transaction from every region will be in one partition. Now the user who wants to look at data within his own region has to query across multiple partitions.
Hence it is worth determining the right partitioning key.
DATA WAREHOUSING - METADATA CONCEPTS
DATA WAREHOUSING - METADATA CONCEPTS
What is Metadata?
Metadata is the road-map to a data warehouse.
Metadata in a data warehouse defines the warehouse objects.
Metadata acts as a directory. This directory helps the decision support system to locate the contents of a data warehouse.
Note: In a data warehouse, we create metadata for the data names and definitions of a given data warehouse. Along with this metadata, additional metadata is also created for time-stamping any extracted data, the source of extracted data.
Categories of Metadata
Metadata can be broadly categorized into three categories:
Business Metadata - It has the data ownership information, business definition, and changing policies.
Technical Metadata - It includes database system names, table and column names and sizes, data types and allowed values. Technical metadata also includes structural information such as primary and foreign key attributes and indices.
Operational Metadata - It includes currency of data and data lineage. Currency of data means whether the data is active, archived, or purged. Lineage of data means the history of data migrated and transformation applied on it.
Role of Metadata
Metadata has a very important role in a data warehouse. The role of metadata in a warehouse is different from the warehouse data, yet it plays an important role. The various roles of metadata are explained below.
Metadata acts as a directory.
This directory helps the decision support system to locate the contents of the data warehouse.
Metadata helps in decision support system for mapping of data when data is transformed from operational environment to data warehouse environment.
Metadata helps in summarization between current detailed data and highly summarized data.
Metadata also helps in summarization between lightly detailed data and highly summarized data.
Metadata is used for query tools.
Metadata is used in extraction and cleansing tools.
Metadata is used in reporting tools.
Metadata plays an important role in loading functions.
The following diagram shows the roles of metadata.
Metadata Respiratory
Metadata respiratory is an integral part of a data warehouse system. It has the following metadata:
Definition of data warehouse - It includes the description of structure of data warehouse. The description is defined by schema, view, hierarchies, derived data definitions, and data mart locations and contents.
Business metadata - It contains has the data ownership information, business definition, and changing policies.
Operational Metadata - It includes currency of data and data lineage. Currency of data means whether the data is active, archived, or purged. Lineage of data means the history of data migrated and transformation applied on it.
Data for mapping from operational environment to data warehouse - It includes the source databases and their contents, data extraction, data partition cleaning, transformation rules, data refresh and purging rules.
Algorithms for summarization - It includes dimension algorithms, data on granularity, aggregation, summarizing, etc.
Challenges for Metadata Management
The importance of metadata can not be overstated. Metadata helps in driving the accuracy of reports, validates data transformation, and ensures the accuracy of calculations. Metadata also enforces the definition of business terms to business end-users. With all these uses of metadata, it also has its challenges. Some of the challenges are discussed below.
Metadata in a big organization is scattered across the organization. This metadata is spread in spreadsheets, databases, and applications.
Metadata could be present in text files or multimedia files. To use this data for information management solutions, it has to be correctly defined.
There are no industry-wide accepted standards. Data management solution vendors have narrow focus.
DATA WAREHOUSING - DATA MARTING
DATA WAREHOUSING - DATA MARTING
Why Do We Need a Data Mart?
Listed below are the reasons to create a data mart:
To partition data in order to impose access control strategies.
To speed up the queries by reducing the volume of data to be scanned.
To segment data into different hardware platforms.
To structure data in a form suitable for a user access tool.
Note: Do not data mart for any other reason since the operation cost of data marting could be very high. Before data marting, make sure that data marting strategy is appropriate for your particular solution.
Cost-effective Data Marting
Follow the steps given below to make data marting cost-effective:
Identify the Functional Splits
Identify User Access Tool Requirements
Identify Access Control Issues
Identify the Functional Splits
In this step, we determine if the organization has natural functional splits. We look for
departmental splits, and we determine whether the way in which departments use information tend to be in isolation from the rest of the organization. Let's have an example.
Consider a retail organization, where each merchant is accountable for maximizing the sales of a group of products. For this, the following are the valuable information:
sales transaction on a daily basis
sales forecast on a weekly basis
stock position on a daily basis
stock movements on a daily basis
Given below are the issues to be taken into account while determining the functional split:
The structure of the department may change.
The products might switch from one department to other.
The merchant could query the sales trend of other products to analyze what is happening to the sales.
Note: We need to determine the business benefits and technical feasibility of using a data mart.
Identify User Access Tool Requirements
We need data marts to support user access tools that require internal data structures. The data in such structures are outside the control of data warehouse but need to be populated and
updated on a regular basis.
There are some tools that populate directly from the source system but some cannot. Therefore additional requirements outside the scope of the tool are needed to be identified for future.
Note: In order to ensure consistency of data across all access tools, the data should not be directly populated from the data warehouse, rather each tool must have its own data mart.
Identify Access Control Issues
There should to be privacy rules to ensure the data is accessed by authorized users only. For example a data warehouse for retail banking institution ensures that all the accounts belong to the same legal entity. Privacy laws can force you to totally prevent access to information that is not owned by the specific bank.
Data marts allow us to build a complete wall by physically separating data segments within the data warehouse. To avoid possible privacy problems, the detailed data can be removed from the data warehouse. We can create data mart for each legal entity and load it via data warehouse, with detailed account data.
Designing Data Marts
The summaries are data marted in the same way as they would have been designed within the data warehouse. Summary tables help to utilize all dimension data in the starflake schema.
Cost of Data Marting
The cost measures for data marting are as follows:
Hardware and Software Cost
Network Access
Time Window Constraints
Hardware and Software Cost
Although data marts are created on the same hardware, they require some additional hardware and software. To handle user queries, it requires additional processing power and disk storage. If detailed data and the data mart exist within the data warehouse, then we would face additional cost to store and manage replicated data.
Note: Data marting is more expensive than aggregations, therefore it should be used as an additional strategy and not as an alternative strategy.
Network Access
A data mart could be on a different location from the data warehouse, so we should ensure that the LAN or WAN has the capacity to handle the data volumes being transferred within the data mart load process.
Time Window Constraints
The extent to which a data mart loading process will eat into the available time window depends on the complexity of the transformations and the data volumes being shipped. The determination of how many data marts are possible depends on:
Network capacity.
Time window available
Volume of data being transferred
Mechanisms being used to insert data into a data mart
DATA WAREHOUSING - SYSTEM MANAGERS
DATA WAREHOUSING - SYSTEM MANAGERS
System management is mandatory for the successful implementation of a data warehouse. The most important system managers are:
System configuration manager
System scheduling manager
System event manager
System database manager
System backup recovery manager
The system configuration manager is responsible for the management of the setup and configuration of data warehouse.
The structure of configuration manager varies from one operating system to another.
In Unix structure of configuration, the manager varies from vendor to vendor.
Configuration managers have single user interface.
The interface of configuration manager allows us to control all aspects of the system.
Note: The most important configuration tool is the I/O manager.
System Scheduling Manager
System Scheduling Manager is responsible for the successful implementation of the data warehouse. Its purpose is to schedule ad hoc queries. Every operating system has its own scheduler with some form of batch control mechanism. The list of features a system scheduling manager must have is as follows:
Work across cluster or MPP boundaries
Deal with international time differences
Handle job failure
Handle multiple queries
Support job priorities
Restart or re-queue the failed jobs
Notify the user or a process when job is completed
Maintain the job schedules across system outages
Re-queue jobs to other queues
Support the stopping and starting of queues
Log Queued jobs
Deal with inter-queue processing
Note: The above list can be used as evaluation parameters for the evaluation of a good scheduler.
Some important jobs that a scheduler must be able to handle are as follows:
Daily and ad hoc query scheduling
Execution of regular report requirements
Data load
Data processing
Index creation
Backup
Aggregation creation
Data transformation
Note: If the data warehouse is running on a cluster or MPP architecture, then the system scheduling manager must be capable of running across the architecture.
System Event Manager
The event manager is a kind of a software. The event manager manages the events that are
Note: The Event manager monitors the events occurrences and deals with them. The event manager also tracks the myriad of things that can go wrong on this complex data warehouse system.
Events
Events are the actions that are generated by the user or the system itself. It may be noted that the event is a measurable, observable, occurrence of a defined action.
Given below is a list of common events that are required to be tracked.
Hardware failure
Running out of space on certain key disks
A process dying
A process returning an error
CPU usage exceeding an 805 threshold
Internal contention on database serialization points
Buffer cache hit ratios exceeding or failure below threshold
A table reaching to maximum of its size
Excessive memory swapping
A table failing to extend due to lack of space
Disk exhibiting I/O bottlenecks
Usage of temporary or sort area reaching a certain thresholds
Any other database shared memory usage
The most important thing about events is that they should be capable of executing on their own. Event packages define the procedures for the predefined events. The code associated with each event is known as event handler. This code is executed whenever an event occurs.
System and Database Manager
System and database manager may be two separate pieces of software, but they do the same job. The objective of these tools is to automate certain processes and to simplify the execution of others. The criteria for choosing a system and the database manager are as follows:
increase user's quota.
assign and de-assign roles to the users
assign and de-assign the profiles to the users
perform database space management
monitor and report on space usage
tidy up fragmented and unused space
add and expand the space
add and remove users
manage user password
manage summary or temporary tables
assign or deassign temporary space to and from the user
reclaim the space form old or out-of-date temporary tables
manage error and trace logs
redirect error or trace information
switch on and off error and trace logging
perform system space management
monitor and report on space usage
clean up old and unused file directories
add or expand space.
System Backup Recovery Manager
The backup and recovery tool makes it easy for operations and management staff to back-up the data. Note that the system backup manager must be integrated with the schedule manager
software being used. The important features that are required for the management of backups are as follows:
Scheduling
Backup data tracking
Database awareness
Backups are taken only to protect against data loss. Following are the important points to remember.
The backup software will keep some form of database of where and when the piece of data was backed up.
The backup recovery manager must have a good front-end to that database.
The backup recovery software should be database aware.
Being aware of the database, the software then can be addressed in database terms, and will not perform backups that would not be viable.
DATA WAREHOUSING - PROCESS MANAGERS
DATA WAREHOUSING - PROCESS MANAGERS
Process managers are responsible for maintaining the flow of data both into and out of the data warehouse. There are three different types of process managers:
Load manager
Warehouse manager
Query manager
Data Warehouse Load Manager
Load manager performs the operations required to extract and load the data into the database. The size and complexity of a load manager varies between specific solutions from one data warehouse to another.
Load Manager Architecture
The load manager does performs the following functions:
Extract data from the source system.
Fast load the extracted data into temporary data store.
Extract Data from Source
The data is extracted from the operational databases or the external information providers.
Gateways are the application programs that are used to extract data. It is supported by underlying DBMS and allows the client program to generate SQL to be executed at a server. Open Database Connection (ODBC) and Java Database Connection (JDBC) are examples of gateway.
Fast Load
In order to minimize the total load window, the data needs to be loaded into the warehouse in the fastest possible time.
Transformations affect the speed of data processing.
It is more effective to load the data into a relational database prior to applying transformations and checks.
Gateway technology is not suitable, since they are inefficient when large data volumes are involved.