Vol. 42 (2000) 231–252
Organizational communication structure and
performance
qBauke Visser
Shell Services International BV, Postbox 162, 2501 The Hague, Netherlands
Received 4 February 1998; received in revised form 10 May 1999; accepted 27 May 1999
Abstract
The effect of organizational communication structure on performance is studied using a project selection framework in which heterogeneous, rational agents can reject or accept projects. A hierar-chy performs better than a polyarhierar-chy in tough environments, whereas the reverse holds in friendly environments. Hierarchies can be too strict from a social welfare point of view. Indeed, if the value of profitable but rejected projects is taken into account, a single agent can perform better than a hierarchy. © 2000 Elsevier Science B.V. All rights reserved.
Keywords: Sequential decision making; Project selection JEL classification: D21; D70; D80
1. Introduction
This paper studies the relationship between the way decentralised information is com-municated among rational agents and the decision the overall organization eventually takes using a project selection environment introduced by Sah and Stiglitz (1985, 1986, 1988). Agents are team members in the sense of Marschak and Rander (1972): their preferences are identical and agency problems can therefore be ignored. This allows one to concentrate on the implications of different forms of communicating and aggregating information.1
The idea to view organizations as networks of information processing units is also ex-plored in Bolton and Dewatripont (1994), Rander (1993) and Vassilakis (1997). Although
qThis paper is part of Ph.D thesis ‘Strategy and Structure: An Information-Processing Approach’ written at the European University Institute, Florence, Italy.
E-mail address: [email protected] (B. Visser)
1For a more general discussion of the way the structure of an organization determines its strategy, see Hammond
(1994).
these papers differ in terms of the problems they study and the measures of organizational performance they use, they share the assumption that the decision that is eventually reached is not affected by the internal structure. It is in this sense that these organizations can be called neutral.2
Contrary to the neutrality of organizations, the project selection framework used in this paper allows for the possibility that the communication structure determines the final deci-sion. Projects can either be good or bad: good projects give rise to a profit when implemented, while the organization incurs a loss on bad projects which it accepts.3 Agents can either accept or reject a project. Ideally, an organization would like to accept all good projects and reject all bad projects. The main difference between Sah and Stiglitz and the approach taken here is the obstacle that prohibits the organization from reaching this goal. In Sah and Stiglitz, faulty decision making stands in the way of attaining the ideal organization. Agents are error-prone. Apart from one section in their 1986 paper, agents are characterised by a pair of probabilities with which they accept good and bad projects. These probabilities are determined exogenously and do not reflect the organizational structure nor the position in which the agents find themselves.4
Instead, I assume that agents are fully rational, but cannot communicate the information they possess due to the high degree of specialisation. Nevertheless, their decisions partly reveal the information on which the decision is based, and successive agents can there-fore obtain valuable information by taking the preceding decisions into account. Given the partial information about the projects they possess and their knowledge of the orga-nizational structure, agents maximize the expected pay-off of the organization. The struc-ture of an organization fixes the sequence in which agents decide (who is first, who is next?) and the situation in which they decide (does an agent decide irrespective of the preceding agents’ decisions, or only if a specific series of decisions has already been taken?). Arguably, differences in organizational structure may lead to differences in actions taken.
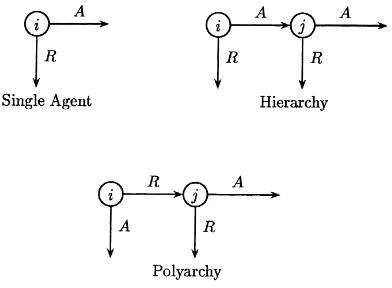
I study three simple, archetypical organizational forms that are widely used to appraise the value of projects. The simplest is a single agent ‘organization’ in which the decision an organization takes coincides with the agent’s. In a hierarchy, a project is implemented if and only if every agent approves the project; a project is rejected as soon as a bad review is received. In a polyarchy, a project is rejected if and only if every agent rejects the project; a project is implemented as soon as a good review is received.5
The goal of this paper is to understand the performance of these organizational forms. I analyse their relative performance using two standards, the first being the expected value of implemented projects. The second also takes into account the value of good projects that an
2In Radner, the neutrality ensues from the type of operations performed by the information processing agents;
Bolton and Dewatripont assume that communication and aggregation do not affect the informational value that can be extracted from a batch of information; in Vassilakis, attention focuses on the relationship between organizational structure and the concomitant reductions in rework.
3Examples of such projects are investment projects, job candidates and papers submitted to a journal. 4This is also the approach taken by the other contributions to the literature on project selection that take Sah and
Stiglitz’ work as a point of departure. See Hendrikse (1992), Ioannides (1987), and Koh (1992a, b, 1993, 1994a,b)
5The terminology is borrowed from Sah and Stiglitz. Note that both hierarchical and polyarchical communication
organization does not implement. The latter criteria therefore captures in a more adequate way the societal value of an organizational form. Moreover, if a project an organization decides not to implement can be undertaken by rival firms, then an organization that rejects too many good projects may endanger its survival.
Thanks to the double check before implementation, the number of accepted bad projects will be relatively low in a hierarchy. On the other hand, a polyarchy rejects relatively few good projects as a project is checked twice before final rejection.6
I define a friendly (hostile) environment as one in which the loss due to an implemented, but bad project is low (high) relative to the foregone profit resulting from rejection of a good project. It is shown that in relatively friendly environments a polyarchy outperforms a hierarchy, while the opposite holds in hostile environments. The intuition is that in friendly environments, type II errors pose a serious problem, which is better dealt with by a polyarchy, while in case of hostile environments, projects should better be double-checked before implementation (which is what characterises a hierarchy). These results were also obtained by Sah and Stiglitz. It is noteworthy that making agents fully rational and fully aware of both the organizational structure and the environment does not alter the range of environments in which one communication structure performs better than the other.
When one also takes into account the value of good projects that are not implemented by an organization, the range of environments for which a polyarchy performs better than a hierarchy almost doubles. Although both organizations reject profitable projects a hierarchy does so more often. Remember that a hierarchy rejects a project if just one of its agents rejects a project. Clearly, the hierarchy can be too severe.
Besides looking at variations in the type of environment, the paper researches the effects of introducing heterogeneous agents. Agents are called heterogeneous if the intervals in which their valuations of projects lie have differing lengths. When organizations are compared on the basis of the value of implemented projects the extra check which is common to both the polyarchy and the hierarchy, albeit one conditional on the previous agent’s decisions, enhances the performance of an organization relative to that of a single agent. However, if agents’ intervals have sufficiently differing lengths, introducing a second agent who checks any previously accepted projects, as is the case in a hierarchy, may reduce the worth an organization generates if one takes the value of the rejected but profitable projects into account. In other words, a single agent organization may perform better than a hierarchy.
In Section 2 the model is discussed in detail. Section 3 analyses the single agent case, Section 4 deals with the hierarchy, and Section 6 compares the performance of the three organizational architectures. Section 7 concludes. Proofs can be found in the Appendix.
2. The model
As noted in Section 1, the model used in this paper is a variant of the project selection model studied by Sah and Stiglitz. I study three different structures used to select projects: a single agent organization (S), a hierarchy (H) and a polyarchy (P). Let me denote an
Fig. 1. The three organizational forms studied.
organizational form by F, where F ∈ {S, H, P}. They are graphically represented in Fig. 1.
The nodes represent agents, the arrows indicate the flow of projects within the organiza-tion, while the labels on the arcs stand for the decisions agents take:Ameans Acceptance, whileRstands for Rejection. These are the only actions agents can take. From a theoretical point of view, the limitation to a binary action set may seem a strong assumption; as a characterization of real world approval systems, it seems to be acceptable. In a hierarchy, a project is accepted if and only if every agent approves the project. In a polyarchy, a project is rejected if and only if every agent rejects the project. The single agent ‘organization’ has a straightforward interpretation. I writeF (i, j )for organizational formF in whichiis the first to decide, andj the second. In particular,S(i):=S(i, j )stands for the single agent organization consisting ofionly.
Agentsiandjare team-members: given the information agents have they undertake the course of action that maximizes the expected pay-off of the organization as a whole.
Every project the organization considers is characterized by a tuple(θi, θj).θi can be interpreted as a signaliobtains, or as a value he attributes to the project. Similarly,θj is the signal or valuation ofj. These signals are private and cannot be communicated. The lack of communication reflects high communication costs due to, for example high costs of processing, transmitting, and interpreting specialised information.7
The characteristics(θi, θj)of the projects the enterprise considers are randomly drawn from two independent uniform distributions:8
θi ∼U[−θ, θ]
θj ∼U[−θ−h, θ+h] (1)
7One can think of the communication problems arising when lawyers and economists, or engineers and salesmen,
set out to discuss specialist themes pertaining to the project.
8I have not derived results for more general distributions. The finite length of the support of the variables does
whereθ >0 andh >−θ. The random variables have the same expected value,E(θi)=
E(θj) = 0, but they may have different variances: Var(θj) > Var(θi) if and only if
h > 0.V is the value of a project if it is implemented. Neitherinorj observeV before
implementation. An interpretation of this characterization would be to consideriandj as operating in different departments, having different, specialised competences.V depends on the sum of the values of the individual characteristics:
V =
X1 : θi +θj >0
−X2 : θi +θj ≤0
(2)
whereXi >0 fori=1,2. This specification implies that what a project lacks in terms of,
say, marketability may be compensated by its ease and efficiency in production. It ensures as well that an accepted project that is profitable gives rise to a pay-off that is independent of the particular values ofθi andθj. This enhances the comparability of the results I obtain with those of Sah and Stiglitz. The size of the pool of projects is irrelevant to what follows and can be set equal to one. Given the set-up, ex ante half of the projects are good, while the other half is bad. The general expression for expected profits becomes
X1 Z Z
2ijF
Pr(θi+θj >0)dθidθj −X2 Z Z
2ijF
Pr(θi +θj ≤0)dθidθj (3)
where the set2ijF is determined by the organizational structureF ∈ {S, P , H}. Assumption 1 specifies those elements that are common knowledge.
Assumption 1. The organizational form, the distributions ofθiand ofθj, the specification
of V, as well as the rationality of the agents is common knowledge. Moreover, if agent i’s decision precedes j’s decision, the former decision is common knowledge when j has to decide.
An agent is rational in the sense that based on the information he has, he takes whatever action gives rise to the highest expected pay-off. If an agent is indifferent he decides to reject the project. Given Assumption 1, an agent’s decision reflects the organizational structure, the distributions of the signals and the rationality. This is the major difference with the approach taken by Sah and Stiglitz. In their model, agents are error-prone and characterised by a pair of exogenously determined probabilities with which good and bad projects are accepted.
Throughout the paper,E(5|F (i, j ))denotes the expected profits made on implemented projects in organizationF (i, j ), andE(5|F ):=max(E(5|F (i, j )), E(5|F (j, i))). That is, the former expression denotes the expected profits of a given organizational structure with a given ordering of agents, while the latter stands for the expected profits of the same organizational form which has arranged its agents in the best way.
3. The single agent case
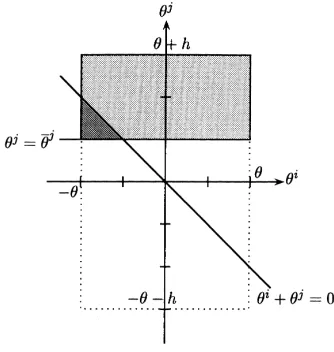
Fig. 2. Profits (grey) and losses (light grey) in a single agent organization.
I show that the agent with the largest variance obtains the highest pay-off and derive the expression for expected profitsE(5|S)and a comparative statics result.
Suppose agentioperates on his own. He accepts all projects characterized by a signal or valuationθi >θ¯i, where the threshold valueθ¯isolvesX1Pr(θ¯i+θj >0)−X2Pr(θ¯i+θj ≤
0) = 0. Hence θ¯i = (θ +h)((k −1)/(k +1)) with k := X2/X1. The parameter
k plays an important role. Note that for finite and positive values of X1 and X2, 0 <
k < ∞. The higher the value ofk the higher the possible lossX2relative to the
possi-ble profitX1. That is, the higherk the more hostile the environment and the larger the
damage that results from accepting a bad project. Fork <1, the environment is relatively friendly.
The value ofθ¯i may be larger than or equal toθ, in which caseirejects all projects; or it may be smaller than−θ, leadingito accept all projects; ifθ¯i ∈[−θ, θ ), the valuation of the project determines the future of the project. Clearly, the values−θ andθ divide the range of possible threshold values in three areas, each with a corresponding type of decision, namely accept irrespective of valuation, accept or reject depending on valuation, and finally reject irrespective of valuation. The same kind of analysis applies in case ofj being on his own. Agentj accepts all those projects satisfyingθj >θ¯j, whereθ¯j equals
¯
θj =θ ((k−1)/(k+1)).
Fig. 2 illustrates the areas where good and bad projects are accepted whenjis the single agent. The area enclosed by the linesθj = ¯θj,θi = −θ,θj =θ+h, andθi =θcontains all the projects with values(θi, θj)thatjaccepts. The light grey area above the lineθi+θj =0 represents the area for which a profit will be made, while the grey area below and on the lineθi+θj =0 lead to a loss.
Lemma 1 summarises the expected profits for a single agent, E(5|S(i)) and E(5|
Lemma 1. E(5|S(i))andE(5|S(j ))equal
Clearly, if an agent accepts no project at all, the expected pay-off equals zero, while if an agent accepts all projects, expected pay-off equalsX1(1−k)/2, which is strictly positive
sincek < 1 if an agent accepts all projects. Proposition 1 shows that the agent with the largest variability in his evaluations makes the highest profit.
Proposition 1. In the single agent case, the agent with the largest variance ensures the highest profit:E(5|S(i)) > E(5|S(j ))⇔h <0. Therefore
The intuition for this result is that the agent knows his own valuation when deciding and, to maximize expected pay-offs, he prefers to remain ignorant about a variable with a small variance to one with a high variance. Hence, the agent with the largest variance should form the organization. Clearly, these expected profit levels are positive.
The following comparative statics result holds for optimal single agent organizations.
Corollary 1. The expected profits of an optimal single agent organization decrease in k:
∂E(5|S)
Clearly, although more projects are rejected when the environment hardens (i.e., the thresh-old value rises), the agent does not become selective enough to see the expected profits rise.
4. Hierarchy
This section studies the behaviour ofiandj in a hierarchy. Agenti, who is the first to look at a project, accepts a project if and only if the expected value of an accepted project is larger than the expected value of a rejected project. Rejection of a project leads to zero profits for sure. Hence,iaccepts the project if and only if its expected value is positive. The expected pay-off is not only determined byi’s signal, but also byj’s signal and decision. Although i does not know the value ofθj, he does know that j takes that action that
maximizes expected value. Given that rejection byj leads to zero profits with certainty, j accepts whatever project will lead to an expected positive pay-off. Moreover, whenj decides, he knows thatidecided favourably on the project. Just as in the previous section, the decision rule is characterised by a threshold value. Ifj is asked to screen a project, he knows therefore thatθi >θ¯i and hence accepts all projects with a valueθj >θ¯j, where
¯
θj satisfies
X1Pr(θi+ ¯θj >0|θi >θ¯i)−X2Pr(θi+ ¯θj ≤0|θi >θ¯i)=0 (6)
This shows thatθ¯j is a function ofθ¯i. This function can be considered the best response function ofj. Ifθ¯i ≥θ,irejects all projects, andjnever receives a project. The threshold valueθ¯j can therefore take on any value. If, on the other hand,θ¯i < −θ,i accepts all
Let me now turn toi. For a project to which he assigns a value ofθi the expected pay-off equals the probability thatjaccepts a project that has been accepted byitimes the expected value of such a project. Consequently,iaccepts those projects with a valueθi >θ¯i, where
¯
θi solves
Pr(θj >θ¯j)(X1Pr(θ¯i +θj >0|θj >θ¯j)−X2Pr(θ¯i +θj ≤0|θj >θ¯j))=0 (9)
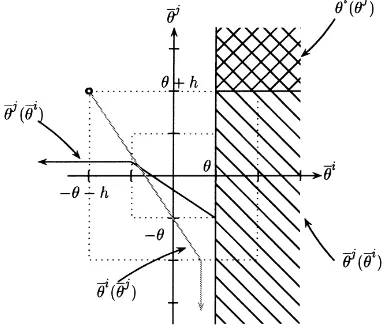
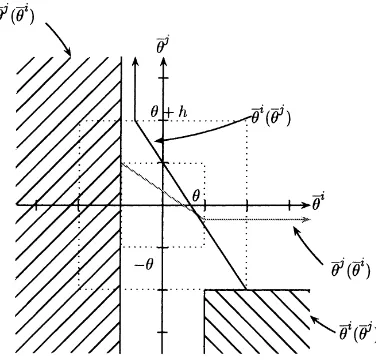
Fig. 3. The best replies ofiandjin a hierarchy.
projects, orθ¯j <−θ−h,j accepts all projects andi’s behaviour as a reaction toθ¯j <
−θ−his independent of the precise value ofθ¯j. Indeed, it is as if the organization consisted of agentionly. Forθ¯j ∈[−θ−h, θ+h)Eq. (9) becomes
θ+h− ¯θj 2(θ+h)
X1
θ+h+ ¯θi
θ+h− ¯θj −X2
− ¯θi− ¯θj
θ+h− ¯θj
=0 (10)
This amounts to
¯
θi(θ¯j)=
(θ,∞) : θ¯j ≥θ+h
− ¯θj k
k+1 −(θ+h)
1
k+1 : θ¯
j ∈[−θ−h, θ+h)
(θ+h)k−1
k+1 :
¯
θj <−θ−h
(11)
Eqs. (8) and (11) jointly determine the mutually consistent values ofθ¯i andθ¯j. They are graphically represented in Fig. 3. This graph implicitly assumes thath >0, i.e., the situation wherej’s valuations have the largest variance.
Fig. 3 shows first of all that(θ¯i,θ¯j) ∈ (θ,∞)×(θ+h,∞)are consistent threshold values. Since these threshold levels are independent of the parameterkthat characterizes the environment and as they imply rejection of all projects and therefore zero expected profits, they do not interest me here. Moreover, counterclockwise rotation of the lineθ¯i(θ¯j) shows that multiple equilibria can also obtain when this line cuts the lineθ¯j = −(θ+h) forθ¯i > θ. The latter equilibria lead to zero pay-offs, and will therefore also be ignored.9
Excluding the above mentioned pairs of consistent threshold values the precise values for all pairs ofθ¯i andθ¯j that satisfy both Eqs. (8) and (11) are given in Lemma 2.
9I do ignore then the important problem of equilibrium selection. My defense would be that the agents I model
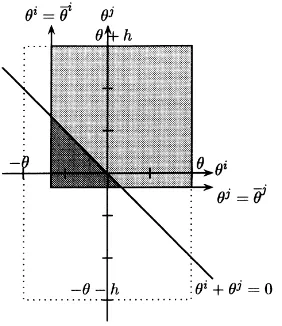
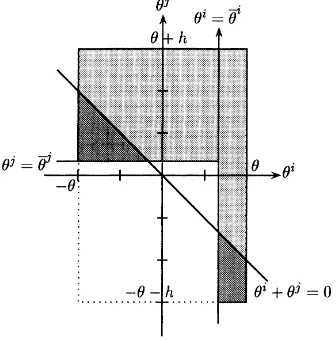
Fig. 4. Profits (grey) and losses (light grey) in a hierarchy. Lemma 2. The following threshold values for agentiandjare consistent:
The expected profitE(5|H (i, j ))can now be calculated. It equals
X1 all the projects with values(θi, θj)that a hierarchy accepts if the parameter values equal
(θ, h, k), and satisfyh∈(−θ (2k/(3k+1)), θ (2k/(k+1))). The light grey area above the
lineθi +θj =0 represents the area for which a profit will be made, while the grey area below and on the lineθi+θj =0 lead to a loss.
Proposition 2. The expected profit of a hierarchyE(5|H (i, j ))equals
Note that for bothh∈ (−θ,−θ (2k/(3k+1)))and forh > θ (2k/(k+1)), the hierarchy consists of just one agent who ‘actively’ evaluates projects; the other merely accepts all projects that arrive at his desk. For these parameter values, the hierarchy mimicks the single agent organization. Expected profits are always positive.
The expressions for expected profits given above allow me to determine the optimal ordering of agents with given characteristics within the hierarchy. Agenti, who is charac-terised by valuations ranging from−θtoθ, should he be the first to evaluate a project or the second given thatj’s valuations belong to the interval [−θ−h, θ+h]? The expressions I obtained until now are based on the assumption thatiis the first to decide. The following proposition can be shown to hold.
Proposition 3. The ordering of heterogeneous agents does not affect the expected pay-off of a hierarchy.
That is, no knowledge regarding the agents’ characteristics is required to find the optimal positioning of agents within a hierarchy. This result reflects both the symmetry of the organizational selection problem and the common knowledge assumption: implementation of a project requires the acceptance of both agents, who operate in a structure that is common knowledge and whose rationality is common knowledge. In other words, the sequential nature of the internal decision-making process is not reflected in a restriction on the ordering of heterogeneous agents.
This section concludes with a comparative statics result.
Corollary 2. An increase in k leads to a decrease in the expected profits a hierarchy obtains, whatever the value of(θ, h).
∂E(5|H )
∂k <0 (15)
This result is identical to the one obtained in the single agent case.
5. Polyarchy
In this section I discuss the behaviour and performance of a polyarchy in which the same agentsiandjoperate within the same project-environment as in the last section. Just as in a hierarchy,iaccepts a project if and only if the expected pay-off of acceptance is higher than the expected pay-off or rejection. The expected pay-off of rejection no longer equals zero, but equals the expected pay-off of a project that has been rejected byi, but accepted byj. Whenj sits down to consider a project, he knows that it has been rejected byi, so he knows thatθi ≤ ¯θi. Hence, he accepts a project if and only his valuationθj >θ¯j, where
¯
θj solves
X1Pr(θi+ ¯θj >0|θi ≤ ¯θi)−X2Pr(θi+ ¯θj ≤0|θi ≤ ¯θi)=0 (16)
receives no projects at all, as all are directly accepted byi. Henceθ¯j can be freely chosen.
Agenti’s decision rule can now be stated as follows. iaccepts if and only ifθi satisfies:
X1Pr(θi+θj >0)−X2Pr(θi+θj ≤0)
Lemma 4. The following threshold values for agent i and j are consistent:
Fig. 5. The best replies ofiandjin a polyarchy.
In a polyarchy, pay-offs are determined by the projects accepted by eitheriorj. That is, E(5|P (i, j ))equals those(θi, θj)where a profit is made on accepted projects, while the grey indicate the area where a polyarchy incurs a loss. The graph has been drawn under the assumption that
0< h < θ (2/(k+1)). In case of multiple equilibria I assume that agents use the threshold
values that jointly lead to the highest expected pay-off. In such cases, it is a matter of simple calculus to show that profits are larger when not all projects are accepted regardless of the agents’ valuations.
Fig. 6. Profits (grey) and losses (light grey) in a polyarchy.
Just as in a hierarchy, the ordering of heterogeneous agents does not affect organizational performance.
Proposition 5. The ordering of heterogeneous agents does not affect the expected pay-off of a polyarchy.
The intuition behind this result is again the symmetry of the organizational decision prob-lem and the detailed knowledge agents have of the structure and of each other’s rationality. Note that, in a polyarchy, the organizational decision problem of maximizing the value of accepted projects is equivalent to minimizing the value of rejected projects. Since the probability that a project is rejected is the product of the probability thatirejects and the probability thatjrejects, the minimization problem is clearly symmetric in the positioning of the agents. Hence, the related maximization problem is also symmetric.
Corollary 3 shows that a tougher project selection environment decreases the performance of a polyarchy.
Corollary 3. Any increase in the ratiokleads to a decrease in expected profits:
∂E(5|P )
∂k <0 (23)
6. A comparison
Therefore, the second criterion also takes the expected value of good but rejected projects into account. These results are summarized in four propositions. Section 6.1 gives the results when organizations are compared on the basis of expected profits, while Section 6.2 states two propositions when the comparison takes the neglected but good projects into account.
6.1. A comparison based on expected profits
Proposition 6. With identical agents,(h=0), the expected pay-off induces the following
ordering of organizational forms:
E(5|P ) > E(5|H ) > E(5|S) : k <1
E(5|H )=E(5|P ) > E(5|S) : k=1
E(5|H ) > E(5|P ) > E(5|S) : k >1
(24)
These results are in line with what one would intuitively expect. The single agent organi-zation performs the worst as it implies just a single check of the quality of any project. A hierarchy performs better than a polyarchy in case of hostile environments (k > 1). The double check before implementation of any project proves beneficial in such environments. However, screening a project twice when the environment is relatively friendly (k < 1) stands in the way of attaining high profits. A polyarchy is better adapted to such envi-ronments. This ordering of organizations coincides with the one found in Sah and Stiglitz (1986). In their model probabilities of acceptance were exogenously fixed. It is interesting to see that even if threshold values are endogenously determined and thus reflect the structure and, in particular, the type of environment, the same ordering of organizations is found.
Proposition 7. If the possible profits and losses on an accepted project are identical, i.e., ifk=1, the ordering of organizations on the basis of the expected pay-off is as follows:
E(5|H )=E(5|P )=E(5|S) : h∈(−θ,−12θ]
E(5|H )=E(5|P ) > E(5|S) : h∈(−12θ, θ )
E(5|H )=E(5|P )=E(5|S) : h≥θ
(25)
The main interest of this proposition is that it shows that, independent of the characteristics of the agent, the polyarchy and the hierarchy perform equally well if the possible losses on accepted projects are as high as their possible gains. This results from the fact that neither organizational structure can exploit its comparative advantage whenk=1.
6.2. A comparison taking rejected, but good projects into account
In this subsection, the value of good projects that are not implemented by an organization are taken into account when evaluating the performance of the organization.
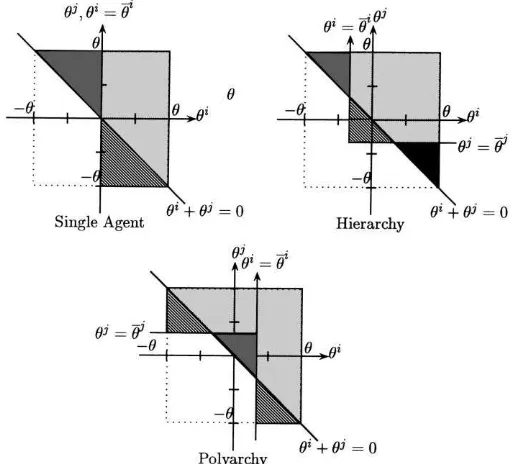
Fig. 7. Four types of projects in the three organizations studied. The dark grey area represents the good projects that have been rejected; the grey are the bad projects that have been accepted; the light grey area those good projects that have been accepted; and the white area the bad projects that have been rejected.
Graphically then the indexDF I use in this section also takes the size of the dark grey
area into account in the evaluation of the performance of an organization. The larger the area is, the larger the number of good projects that have not been implemented.DF is
calculated as the difference between, on the one hand, the expected value of good projects that have been implemented and, on the other hand, the sum of the expected value of the bad projects that have been implemented and good projects that have not been implemented for a given organizational formF ∈ {S, H, P}. The two propositions that follow analyse the behaviour ofDfor two special cases: the heterogeneous agents case (h=0), and the case where the absolute value of possible profits and losses are identical (k=1). In either case, it is assumed that the decision rules agents use are derived with a view to maximizing expected profits on implemented projects.
Proposition 8. If agents are identical, orh=0, the following ordering of organizational
forms is induced by the indexD:10
DP > DH > DS : k∈(0,1.8)
DP =DH > DS : k=1.8
DH > DP > DS : k >1.8
(26)
The single agent organization performs the worst throughout the whole range ofk. The polyarchy is still performing better than the hierarchy for low values and the range of values for which this is the case has grown considerably. This is due to the fact that the hierarchy rejects too many projects, including profitable ones. For high values ofk, the hierarchy is still performing better than the polyarchy.
Proposition 9. If the possible losses and gains on a project are identical, i.e., ifk=1, the
following ordering of organizational forms holds on the basis of indexD:
Interestingly, this proposition shows that in the presence of heterogeneous agents the pol-yarchy is always performing better than the hierarchy. Indeed, the hierarchy may perform even worse than the single agent. The bad performance of the hierarchy when measured in terms of indexDis due to its requirements for implementation which are stricter than those of any other organizational structure.
7. Conclusion
In this paper, I discuss the effect on the organizational communication structure can have the performance of an organization in a project selection framework by analysing a single agent organization, a hierarchy and a polyarchy. Implemented projects can either give rise to a profit or to a loss. The agents’ choices reflect the overall organizational structure and, in particular, the informational content of other agents’ actions. Agents maximize the expected profits made on implemented projects. The ordering of the polyarchy and the hierarchy in terms of the expected profit they generate depends on both the characteristics of the agents and on the type of environment.
I also compare the performance of these organizations taking the value of rejected, but profitable projects into account. This gives rise to some interesting results. In particular, if agents differ the polyarchy is always performing at least as good as the hierarchy. Indeed, even a single agent may attain a higher expected profit than the hierarchy. The double screening before implementation of any project, which characterises the hierarchy, is behind this result.
deciding may be of interest. Moreover, an explicit analysis of competing organizational forms should prove relevant.
This paper leaves agency problems undiscussed. It seems to be very difficult to integrate agency and information processing aspects in a tractable mathematical model. It is however an interesting topic for further research.
The analysis in this paper also hints at a complication that arises when assessing the performance of an agent. If the future promotion of an agent depends on his capacity to correctly screen projects, how does one disentangle the contributions made by a single agent? In the framework discussed in this paper such a question is pertinent as an agent’s decision reflects the organizational structure and the presence of other rational agents. This is an interesting topic for future research.
The present paper also relates to the literature on social learning. Contributions to this literature describe situations in which a number of selfish agents decide sequentially on the basis of both private information and information revealed by previously taken decisions. As the pay-off agents obtain are left unaffected by succeeding agents’ decisions, agents do not take the informational impact their actions have on successive decision-makers into account. Typically, one decision is ‘good’, while the other is ‘bad’, but the latter may become the choice of rational agents, given the information revealed by previous decisions. The main questions addressed in these papers are of a statistical nature: what is the probability that the population of agents makes the wrong decision, what is the probability that this population, after a series of wrong decisions, breaks out of this situation, etc.?11 Gale (1996) argues that the literature on social learning pays undue attention to the statistical aspects involved, at the cost of ignoring the value created by sequential decision structures. In this light, the present paper can be viewed as a contribution that tries to redress this disequilibrium.
Acknowledgements
I would like to thank Etienne Billette de Villemeur, Joe Harrington, Spyros Vassilakis and seminar participants at the Econometric Society European Meeting 1997 for their comments and intuition and James Dow for a useful conversation. All remaining errors are mine. Financial support from Dr. Hendrik Muller’s Vaderlandsch Fonds, Stichting Noorthey, and Fundatie van de Vrijvrouwe van Renswoude te’s-Gravenhage is gratefully acknowledged.
Appendix A. Proofs
Proof of Lemma 1. The threshold value θ¯i is larger than or equal to θ if and only if h≥θ (2/(k−1))andk >1 whileθ¯iis smaller than−θif and only ifh >−θ (2k/(k−1)) andk <1. For all other values of(θ, h, k)the threshold valueθ¯ilies in the interval [−θ, θ ). The same kind of analysis applies in case ofj being on his own. Agent j accepts all those projects satisfyingθj >θ¯j, whereθ¯j equalsθ¯j =θ ((k−1)/(k+1)). Therefore,
¯
θj ≥θ+hif and only ifh≤ −θ (2/(k+1))andk >1, whileθ¯j <−θ−hif and only ifh <−θ (2k/(k+1))andk <1. For all other values of(θ, h, k),θ¯j ∈[−θ−h, θ+h) holds. The restrictions onkshould hold forh > −θ to be satisfied. Clearly, the type of decision depends on the interplay of the main parameters of the model. Note that only the
ratios characterizing agentsh/θand the ratiok=X2/X1capturing the type of environment
matter.
In general, the profit expression equals
X112(Prob(A|Good)−kProb(A|Bad))
as the probability that a project is good equals a half. Ifj is the only agent, and forh ≤
−θ2/(k+1)andk >1, no project is accepted, and henceE(5|S(j ))=0, while forh≥
−θ2k/(k+1)andk <1, all projects are accepted. ThereforeE(5|S(j ))=X1(1−k)/2.
Finally, ifθ¯j ∈(−θ+h, θ+h), the profit expression depends on the sign ofh. Forh >0, Fig. 2 shows that the expected profits equal
X1
1
2
2θ (θ+h− ¯θj)−(1/2)(θ− ¯θj)2
2θ (θ+h) −k
(1/2)(θ− ¯θj)2 2θ (θ+h)
which boils down toX1(θ+h(k+1))/(2(θ+h)(k+1)). Forh∈(−θ (2/(k+1)),0)and
k≤1, or forh∈(−θ (2k/(k+1)),0)andk≥1, the expression becomes
X1
1 2
(θ+h− ¯θj)(−h)−(1/2)(θ+h− ¯θj)2
2θ (θ+h)
−k(θ+h− ¯θ
j)(−h)+(1/2)(θ+h− ¯θj)2
2θ (θ+h)
This amounts toX1((2θ+h(k+1))2/(8θ (θ+h)(k+1))). The expressions forE(5|S(i))
can be obtained in the same fashion.
Proof and Proposition 1. This can easily be checked with the aid of Lemma 1.
Proof of Lemma 2. It is clear thatθ¯j <−θ−hforh∈(−θ,−θ (2k/(3k+1))). Hence,
¯
θi(θ¯j = −θ−h)=(θ+h)((k−1)/(k+1)). For−θ (2k/(3k+1)) < h < θ (2k/(k+1)),
¯
θi andθ¯j solve the pair of equationsθ¯i = ¯θi(θ¯j)andθ¯j = ¯θj(θ¯i). The solution isθ¯i =
−θ (1/(2k+1))−h((k+1)/(2k+1)),θ¯j = −θ (1/(2k+1))+h(k/(2k+1)). Finally, for
h > θ (2k/(k+1)),θ¯i <−θand soθ¯jequalsθ¯j(θ¯i = −θ )=(θ+h)((k−1)/(k+1)).
Proof of Proposition 2. θ¯j <−θ−hforh∈(−θ,−θ (2k/(3k+1))). Hence, profits equal the level of profits made in a single agent organization byiforh <0. Forh > θ (2k/(k+1)),
orθ¯i <−θ, profits equal the profits made in single agent organization consisting of agent
j only forh >0. Finally, forh∈[−θ (2k/(3k+1)), θ (2k/(k+1))], Fig. 4 can be used to
write
E(5|H (i, j ))= X1
2
(θ− ¯θi)(θ+h− ¯θj)−((k+1)/2)(− ¯θj− ¯θi)2 2θ (θ+h)
Proof of Proposition 3. Consider Lemma 5.
Lemma 5. Supposeθ >0 andh >−θ, and defineθ′andh′asθ′:=θ+handh′:= −h,
respectively. Then,θ′>0 andh′>−θ′. Moreover,
hRθ 2k
k+1 ⇔h
′⋚−θ′ 2k
3k+1
Proof. Supposeh≤θ (2k/(k+1)). Thenθ =θ+h≤θ ((3k+1)/(k+1)). Moreover,
h′ = −h ≥ −θ (2k/(k+1)). Therefore,h′ ≥ −θ′(2k/(k+1))((k+1)/(3k+1)) =
−θ′(2k/(3k+1)). The same kind of reasoning shows thath≥θ (2k/(k+1)) ⇔ h′ ≤
−θ′(2k/(3k+1)).
This lemma establishes that if bothθ¯i ∈(−θ, θ )andθ¯j ∈ (−θ−h, θ+h), then both
¯
θi′ ∈(−θ′, θ′)=(−θ−h, θ+h)andθ¯j′ ∈(−θ′−h′, θ′+h′)=(−θ, θ ), whereθ¯i′andθ¯j′ should be understood asθ¯iandθ¯jas a function ofθ′andh′. This implies that before and after the switch of positions ofiandj within the hierarchy, the expected profit is determined by the middle entry of Eq. (14). It is easy to show that profits are left unaffected. Now suppose
thath≥θ (2k/(k+1)). Hence,h′≤ −θ (2k/(3k+1)). The pay-off comparison therefore
equals the difference between the bottom entry of Eq. (14) with(θ, h)equal to(θ, h)and the top entry Eq. (14) with(θ, h)equal to(θ′, h′)=(θ+h,−h). It is a matter of a simple calculus to show that these expressions are identical.
Proof of Lemma 3. I discuss the cases (I)θ¯j > θ+h, (II)θ¯j ∈(−θ−h, θ+h), and (III)
¯
θj <−θ−hin turn.
(I) First the case where θ¯j > θ +h, or Pr(θj > θ¯j) = 0. The decision rule of i becomes Accept if and only ifθi satisfiesX1Pr(θj >−θi)−X2Pr(θj ≤ −θi) >0. This
is equivalent to Accept if and only ifθi >θ¯i :=((k−1)/(k+1))(θ+h).
(II) Now assumeθ¯j ∈(−θ−h, θ+h). I split this case up in three subcases: (1)θi ≥θ+h,
(2)θi ≤ −θ−h, and (3)θi ∈(−θ−h, θ+h).
(II.1) Ifθi ≥ θ+h, Pr(θj > −θi)= 1 =Pr(θj > −θi|θj > θ¯j).i’s decision rule becomes Accept if and only ifθisatisfiesX1>Pr(θj >θ¯j)X1. Hence, forθi ≥θ+hthe
project is accepted.
(II.2) Ifθi ≤ −θ−h, the decision rule amounts to Accept if and only if θi satisfies
−X2>−Pr(θj >θ¯j)X2. Hence, forθi ≤ −θ−hthe project is rejected.
(II.3) Ifθi ∈(−θ−h, θ+h), two cases obtain: (a)−θi ≤ ¯θjand (b)−θi >θ¯j. In case of (a), Pr(θj >−θi|θj >θ¯j)=1, and the decision rule boils down to Accept if and only if
θ+h+θi
2(θ+h)
−k
−θi+θ+h
2(θ+h)
>
θ+h− ¯θj
2(θ+h)
or,θi >− ¯θj(1/(k+1))+(k/(k+1))(θ+h). It is straightforward to show that− ¯θj(1/(1+
k))+(k/(k+1))(θ+h)∈(− ¯θj, θ+h). Hence, forθi ∈(− ¯θj,− ¯θj(1/(k+1))+(k/(k+
1))(θ +h)] a project will be rejected, while forθi ∈(− ¯θj(1/(k+1))+(k/(k+1))(θ+
In case of (b), Pr(θj > −θi|θj > θ¯j) ∈ (0,1), and the decision rule boils down to Accept if and only if−k(θ+h) > kθ¯j, which is false sinceθ+h >− ¯θjby assumption. Hence for−θi >θ¯ja project is rejected.
In summary, ifθ¯j ∈(θ+h,−θ−h)the decision rule amounts to Accept if and only if
θi >θ¯i := − θ¯ j
k+1 +
k
k+1(θ+h).
(III) Finally the case whereθ¯j <−θ−hin turn. The decision rule becomesX1Pr(θj >
−θi)−X2Pr(θj <−θi) > X1Pr(θj >−θi)−X2Pr(θj <−θi)which never holds, and
every project is therefore rejected:θ¯i ≥θ.
Proof of Lemma 4. The proof is similar to the proof of Lemma 2
Proof of Proposition 4. I use Fig. 6 to rewriteE(5|P (i, j ))forh∈[0, θ (2/(k+1))),
X1
2
2θ (θ+h)−(1/2)(θ¯j+ ¯θi)2−k((1/2)(θ− ¯θj)2
+(− ¯θi+θ+h)(θ− ¯θi)−(1/2)(θ− ¯θi)2) 2θ (θ+h)
The expression forh∈(0, θ (2/(k+1)))can be shown to be identical to this expression. This expression can be rewritten asX1((h2k(k+1)+8θ (θ+h))/(8θ (θ+h)(k+2))).
Forh∈(−θ,−θ (2/(k+3))),θ¯j ≥θ+h, and the profit expression equals the one of
the single agentifor negative values ofh, while forh≥θ (2/(k+1)),θ¯i ≥θ, and so the profits equal the profits obtained by a single agentj, forh >0.
Proof of Proposition 5. Consider Lemma 6.
Lemma 6. Supposeθ >0 andh >−θ. Defineθ′:=θ+handh′:= −h. Then,
hRθ 2
k+1 ⇔h
′⋚−θ′ 2
k+3
h≤θ 2
k+1 ⇔h
′≥ −θ′ 2
k+3
Proof. The proof is identical to the proof of Lemma 5.
The proof of Proposition 5 is now similar to the proof of Proposition 3.
Proof of Proposition 6. Use the expressionsE(5|S) =X1(1/(2(k+1))),E(5|H ) =
X1((1+k)/(4k+2)), andE(5|P )=X1(2/(2k+4)).
Proof of Proposition 7. Use Lemma 1, and Propositions 1–5 to derive the result.
Proof of Proposition 8. The indices take on the following values:D(S) = −X1((k2−
k−1)/(2(k+1)2)),D(H )=X1((3k+1)/(2(2k+1)2)), andD(P )= −X1((k2−2k−
4)/(2(k+2)2)).
Proof of Proposition 9. The proof is based on a comparison of the following expressions.
Forh∈(−θ,−(1/2)θ ),D(S)=D(H )=D(P )=X1((θ−3h)/8θ ).
For h ∈ (−(1/2)θ,0) the indices amount to D(S) = X1((2θ − 6h)/16θ ),
D(H )=X1((13h2+16hθ+16θ2)/72θ ), andD(P )=X1((5(h2+4hθ+4θ2))/72θ ).
Forh ∈ (0, θ ), D(S) = X1((θ +4h)/(8(θ +h))),D(H ) = X1((13h2+16hθ +
16θ2)/72θ ), andD(P )=X1((5(h2+4hθ+4θ2))/72θ ).
Forh≥θ, the indices becomeD(S)=D(H )=D(P )=X1((θ+4h)/(8(θ+h))).
References
Bikhchandani, S., Hirshleifer, D., Welch, I., et al., 1992. Theory of fads, fashion, custom, and cultural change as informational cascades Journal of Political Economy 100, 992–1026.
Bolton, P., Dewatripont, M., 1994. The firm as a communication network. Quarterly Journal of Economics 109, 809–839.
Gale, D., 1996. What have we learned from social learning? European Economic Review 40, 617–628. Hammond, T.H., 1994. Structure, Strategy, and the Agenda of the Firm. In: Rumelt, R.P., Schendel, D.E., Teece,
D.J. (Eds.), Fundamental Issues in Strategy. A Research Agenda. Harvard Business School, Boston, MA. Hendrikse, G.W.J., 1992. Competition between architectures. Annales d’Economie et de Statistique 25/26, 39–50. Ioannides, Y.M., 1987. On the architecture of complex organizations. Economics Letters 25, 201–206. Koh, W.T.H., 1992a. Human fallibility and sequential decision making. Hierarchy versus polyarchy. Journal of
Economic Behavior and Organization 18, 317–345.
Koh, W.T.H., 1992b. Variable evaluation costs and the design of fallible hierarchies and polyarchies. Economics Letters 38, 313–318.
Koh, W.T.H., 1993. First-mover advantage and organizational structure. Economics Letters 43, 47–52. Koh, W.T.H, 1994a. Making decisions in commitees. A human fallibility approach. Journal of Economic Behavior
and Organization 23, 195–214.
Koh, W.T.H, 1994b. Fallibility and sequential decision-making. Journal of Institutional and Theoretical Economics 150, 362–374.
Marschak, J., Radner, R., 1972. Economic Theory of Teams. Yale University Press, New Haven.
Radner, R., 1993. The Organization of decentralized information processing. Econometrica 61, 1109–1146. Sah, R.K., Stiglitz, J.E., 1985. Human fallibility and economic organization. American Economic Review 75,
279–292.
Sah, R.K., Stiglitz, J.E., 1986. The architecture of economic systems: hierarchies and polyarchies. American Economic Review 76, 716–727.
Sah, R.K., Stiglitz, J.E., 1988. Committees, hierarchies, and polyarchies. The Economic Journal 98, 451–470. Vassilakis, S., 1997. Accelerating new product development by overcoming complexity constraints. Journal of