TERRESTRIAL METHOD FOR AIRBORNE LIDAR QUALITY CONTROL AND
ASSESSMENT
N. M. Alsubaiea *, H. M. Badawya, M. M. Elhabibyb, N. El-Sheimya
aDepartment of Geomatics Engineering, University of Calgary, Calgary, Alberta, Canada T2N 1N4- (nalsubai, hmmohamm, elsheimy)@ ucalgary.ca
bPublic Works Department, Ain Shams University, Cairo, Egypt- mmelhabi@ ucalgary.ca
Commission VI, WG VI/4
KEY WORDS: LiDAR, accuracy, quality control, error Assessment.
ABSTRACT:
Most of LiDAR systems do not provide the end user with the calibration and acquisition procedures that can use to validate the quality of the data acquired by the airborne system. Therefore, this system needs data Quality Control (QC) and assessment procedures to verify the accuracy of the laser footprints and mainly at building edges. This research paper introduces an efficient method for validating the quality of the airborne LiDAR point clouds data using terrestrial laser scanning data integrated with edge detection techniques. This method will be based on detecting the edge of buildings from these two independent systems. Hence, the building edges are extracted from the airborne data using an algorithm that is based on the standard deviation of neighbour point’s height from certain threshold with respect to centre points using radius threshold. The algorithm is adaptive to different point densities. The approach is combined with another innovative edge detection technique from terrestrial laser scanning point clouds that is based on the height and point density constraints. Finally, statistical analysis and assessment will be applied to compare these two systems in term of edge detection extraction precision, which will be a priori step for 3D city modelling generated from heterogeneous LiDAR systems.
* Corresponding author. This is useful to know for communication with the appropriate person in cases with more than one author.
1. MANUSCRIPT
1.1 LiDAR and 3D city modelling
In the past decade the Light Detection And Ranging (LiDAR) mapping technique has been an important tool for three dimensional point cloud data acquisition. . Nowadays, there are increasing demands for high-resolution 3D data, which can be used for variety of applications such as land use mapping, oil and gas, environmental modelling, traffic management, vehicle navigation, and construction (Vosselman & Maas, 2010). These applications will need both airborne and land based LiDAR data. The land based data can be from fixed terrestrial, stop and go, and/or mobile mapping LiDAR systems.
Each one of the above mentioned platforms has its own characteristics and quality of acquired point clouds. On one hand, the airborne laser scanner has the ability to collect data over a wide area, but somehow expensive compared to the terrestrial laser scanning. On the other hand the terrestrial laser scanning is fast in data acquisition, more precise and low-cost alternative to airborne scanning; however, it is limited to relatively small areas and building facades. Therefore, there is a need data fusion between these two techniques to enhance the accuracy and optimize the production of a complete 3D models of different objects especially buildings.
The typical airborne LiDAR system comprises of two main components: Navigation component, which consists of GNSS/INS integrated systems to provide the position and the orientation of the aircraft. Laser component, which is acquired the point cloud and the distance between the ground object and the laser unit (El-Sheimy et al., 2005). Therefore, the present of the GNSS/INS integrated systems makes the airborne LiDAR an important technology to acquire direct geo-referencing of three
dimensional point cloud data. Although, each component of the LiDAR system is capable of acquiring accurate measurements. However, the combination process of Navigation systems themselves as well as the laser beam produces considerable errors. These errors affect the position accuracy of the output coordinates. Therefore, the quality control (QC) process is very essential procedure to certify and evaluate the quality of the airborne LiDAR data (Shan et al, 2008).
This research paper focuses on heterogeneous data relative QC, which is a post-mission procedure for maintaining high standard edge detection from airborne LiDAR by the aid of terrestrial. Furthermore, the accurate 3D city integration is the main motivation behind this research. The terrestrial LiDAR associated with precise characterization such as high point density and short range when compare to the airborne LiDAR. These characterizations are capable of acquiring accurate and reliable edge detection. Therefore, a new method is introduced to perform the QC of Airborne LiDAR data using terrestrial laser scanning data integrated with edge detection techniques. This method is based on detecting the edge of building boundary from these two independent systems. Moreover, these extracted edges will be used to fuse the heterogeneous LiDAR Datasets.
1.2 Previous Research
Csanyi and Toth (2007) developed a new method for quality control procedure, which was associated with checkpoint analysis using special designed targets (a white circle inside a black ring). Once the data was acquired, these targets were extracted from the range and intensity imagery using a segmentation approach. Finally, the coordinates of the extracted targets were compared with the surveyed coordinates. The The International Archives of the Photogrammetry, Remote Sensing and Spatial Information Sciences, Volume XL-1, 2014
RMSE analysis was computed and used as a measure of the quality of the LiDAR-derived surface.
Bang et al (2008) integrated the terrestrial and airborne LiDAR data for airborne system calibration. First, a Triangulated Irregular Networks (TINs) were generated from the terrestrial LiDAR data. Then, these TIN were used to derive triangular patches, which used to represent the terrestrial data. Then, the airborne LiDAR data was represented by its original footprints. Afterward, the iterative closest patch (ICPatch) algorithm used to implement corresponding point to-patch from both TIN and irregular point data. The adopted constrain for calibration was determined utilizing four points, one from the airborne and three from the terrestrial. Finally, these corresponding point to-patches have improved calibration procedure.
Habib et al (2010) developed a method for evaluating the quality of airborne LiDAR using strips adjustment technique. This technique was based on evaluating the discrepancy between two conjugate surfaces. In the absence of biases these conjugate surfaces have to be match; however, if there is a bias error these surfaces will not match. Therefore, ICPatch algorithm is used to estimate the transformation parameters between conjugate surfaces in overlapping strips, which used to determine the random and systematic error associated with airborne LiADR.
1.3 Data used
This research is implemented using Terrestrial and airborne LiDAR. Five scans are acquired using Optech terrestrial laser scanner (ILRIS-3D). These scans are registered utilizing Iterative Closest Point (ICP) algorithm. The airborne LiDAR data was acquired in 2006 with 0.70 m point density.
2. EDGE DETECTION FROM TERRESTRIAL DATA
In this section, the method utilized to detect the edges from the terrestrial laser scanning will be discussed. This section will include explanation about the chosen threshold value for the range search technique associated with candidate edges detection process.
2.1 Edge detection technique
Firstly, the kd-tree (k-dimensional Tree) is used as pre-processing technique to organize the raw point cloud data and to minimize the computational time.
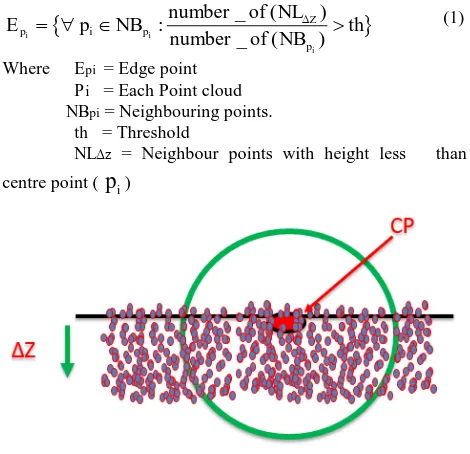
Equation 1 defines the introduced new algorithm for building edges extraction from a raw point cloud acquired by terrestrial LiDAR. This algorithm is based on the fact that when smearing range search function with radius value any edge point will not have neighbouring points with grater height above it. Thus, usually the edge point has the grater height. Therefore, a range search function with pre-defined threshold value is applied to each point in the data to find its neighbour in 3D space. Moreover, each point has its turn to be centre point for its neighbour as illustrated in Figure 1. Then, for each neighbour the height difference (Δz) between the centre point (CP) and its neighbour is calculated. Afterward, the total number of points with height less than CP is determined. Finally, the ratio between these points (NLΔz/NBpi) and the total number of the neighbour is determined. As result of this search algorithms, if the ratio has value above 90%, this point is belonging to edge
Figure 1: The range search criteria
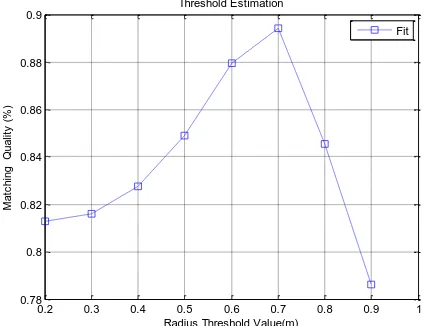
2.2 Threshold Determination and Quality measure
In the previous section, the range search technique was based on radius threshold value. This threshold was calculated by comparing the results of different radius threshold values to a reference data. This was done using quality measure as expressed in Equation 2 (Heipke et al, 1997).
TP quality measure compare to the reference data.
Figure 2: Threshold value and quality measure for Terrestrial
2.3 The top edge detection
The aim of this research paper is to implement QC for maintaining high standard edge detection from airborne LiDAR by the aid of terrestrial for improving the 3D city model accuracy. Therefore, the tope edges are the only edges can be The International Archives of the Photogrammetry, Remote Sensing and Spatial Information Sciences, Volume XL-1, 2014
seen from both LiDAR systems. In this case, the candidate top edges are detected by implementing Equation 3 to the whole edge data resulting from section 2.1. So, the neighbouring points for each point in the edge data is determined using range search technique, which implemented in X and Y dimensions. Then, for each neighbour the height difference (Δz) between the centre point and its neighbour is calculated. Afterwards, the total number of points with height less than the centre point is determined. Finally, the ratio between these points (NLΔz/NBpi) and the total number of the neighbour is determined as well. Therefore, if the ratio has value below 25%, this point is belonging to top edge and vice versa.
_ ( )
NBpi = neighbouring points in X and Y dimensions th = threshold
NLΔz = Neighbour points with height less than centre point (Epi)
3. EDGE DETECTION FROM AIRBORNE DATA
In this section, the method utilized to detect the edges from the airborne LiDAR will be discussed. This section will include density and height, where the standard deviation of the point’s neighbour height is computed and compared to certain threshold value. Therefore, a range search is applied to find the neighbouring points for each point cloud in the data. Thus, each point has its turn to be a centre point for its neighbour as points with respect to threshold value.
th = threshold
Figure 3 shows the range search radius value used for finding the neighbouring points. This technique is based on radius threshold value. This threshold was calculated by investigating the results of different radius threshold values to a reference data. This is done using quality measure, which expresses using equation 2
Figure 3: Threshold value and quality measure for airborne
3.2 The top edge detection
After extracting the all edges from the raw points cloud and as discussed in Section 2.3, the main purpose is to compare edges detected from terrestrial and airborne LiDAR system. Therefore, the top edges are extracted utilizing Equation 3
4. EDGES COMPARISION
Iterative closest point (ICP) is most popular three-dimensional data registration method, which was developed by Besl and McKay (1992). This method is based on point-to-point correspondence, where the sum of squares of the euclidean distances between the nearest points of two data sets is minimized as showing in Equation 5.
2 angles between given two data sets
q0 = the shift between given two data sets
(translation vector)
ICP method is used to register four conjugate edges, which are illustrated by Figure 5 and Figure 7. The result of the registration is used to compare the edges resulting from the airborne to the ones coming from the terrestrial. The mean registration error is calculated for each registration step. Then, all the terrestrial and airborne datasets are registered using these edges.
5. RESULTS ANALYSIS AND DISCUSSION
Figure 4 shows the area of interest, where both LiDAR datasets were acquired. This area is part of CCIT building at the campus of university of Calgary.
Figure 4: Terrestrial LiDAR DATA
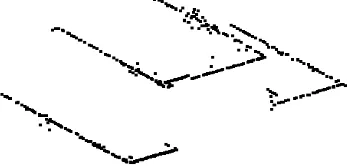
Figure 5 shows the result of the introduced algorithm for edge extraction from terrestrial LiDAR. The quality measure test shows that more than 95% of the edges were successfully extracted compared to the reference data. The following figure represents part of the building.
Figure 5: Edge detection result from the terrestrial Data
Moreover, Figure 6 demonstrate the result of the top edge extraction from the terrestrial LiDAR.
Figure 6: Top Edge Detection Result
Figure 7 and Figure 8 show the results of the edge and top edge extraction from the airborne LiDAR respectively.
Figure 7: Edge detection result for airborne Data
Figure 8: Top Edge Detection Result
Figure 9 shows the registration results of the two conjugate edges. The white colour represents the terrestrial edge, and the red colour represent airborne edge.it is obvious that there is significant variation in point density between these two LiDAR systems. The airborne LiDAR has ability to acquire the roof top building and the terrestrial LiDAR has ability to acquire the building facades. Therefore, the data fusion between these systems provides more accurate 3D city modelling.
Figure 9: Edge to Edge Registration The International Archives of the Photogrammetry, Remote Sensing and Spatial Information Sciences, Volume XL-1, 2014
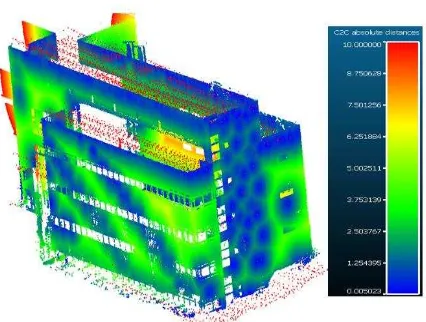
Figure 10 illustrates the final integration results between the airborne and the terrestrial LiDAR datasets. The mean registration error using the conjugate edge method is approximately 20 cm. the airborne point cloud data has a red colour, while the terrestrial data has variation of colours bar depending on the quality of the registration between these two data sets. One can notice that all top edges are very close to each other because of the initial registration between all conjugate edges. However, the top edges in the back view of the building are very far from the airborne due to the absence of the airborne data for this portion of the building. Furthermore, the airborne data was acquired in 2008, where this part of the building was not built yet. In addition, airborne system is limited to the top view. Hence, in most parts of the building façades, the distance difference is quite far and this is because of the nature of the airborne system. Furthermore, the airborne system was acquired by oscillating mirror-scanning mechanism. One can notice that two to three lines of the oscillating scanning mechanism were interacted with the two façade, which makes the distance between them comparably very small. Finally, the conjugate edge integration method is capable of evaluating the accuracy of the airborne LiDAR. The normal distance between edges found to be 15 cm. Therefore, the terrestrial LiDAR improves the accuracy of determining edge with 15 cm compare to airborne.
Figure 10: The result of ICP implementation
6. CONCLUSION
This research paper proposes a new technique for edge detection from terrestrial and airborne LiDAR datasets. The outcome of this approach is used for maintaining high standard edge detection from airborne LiDAR by the aid of terrestrial. The terrestrial is able to provide a complete edges; however, the airborne was not, where the normal distance between them is 15 cm.
ACKNOWLEDGEMENTS (OPTIONAL)
I would like to express my sincere gratitude and appreciation to Ministry of higher education in Saudi Arabia for funding this project.
REFERENCES
Bang, K., Habib, A.F., Kusevic, K., Mrstik, P. Integration of terrestrial and airborne LiDAR data for system calibration. Proceedings of The International Archives of the Photogrammetry, Remote Sensing and Spatial Information Sciences, Beijing, China, 3–11 July 2008; pp. 391–398
Besl P. J., and N. D. McKay, 1992. A method for registration of 3-D shapes. IEEE Transactions on Pattern Analysis and Machine Intelligence, 14(2):pp. 239–256.
C. Heipke, H. Mayer, C. Wiedemann and O. Jamet, “Evaluation of Road Extraction”. In: IAPRS, Vol. XXXII, pp. 47–56, 1997.Automatic Road Extraction”. In: IAPRS, Vol. XXXII, pp. 47–56, 1997.
Csanyi, N. and Toth, C., 2007. Improvement of LiDAR data accuracy using LiDAR-specifi c ground targets.
Photogrammetric Engineering and Remote Sensing, 73(4), April 2007: 385–396.
El-Sheimy, N., Valeo, C., Habib, A., 2005. Digital Terrain Modeling: Acquisition, Manipulation and Applications, Artech House Remote Sensing Library, 200 pages.
Habib, A., Kersting, A.P., Bang, K.I., Lee, D.C. Alternative Methodologies for the Internal Quality Control of Parallel LiDAR Strips. IEEE Trans. Geosci. Remote Sens. 2010, 48, 221-236.(Habib at al, 2009)
Shan, J., Toth, C. Topographic Laser Ranging and Scanning: Principles and Processing; CRC: Boca Raton, FL, USA, 2008; p. 292.
Vosselman, G. & Maas, H.-G., 2010. Airborne and Terrestrial Laser Scanning. 1st ed. s.l.:CRC Press.