POTENTIALS OF SMALL, LIGHTWEIGHT AND LOW COST MULTI-ECHO LASER
SCANNERS FOR DETECTING GRAPE BERRIES
Ana Djuricic, Martin Weinmann, Boris Jutzi
Institute of Photogrammetry and Remote Sensing, Karlsruhe Institute of Technology (KIT), Germany {ana.djuricic, martin.weinmann, boris.jutzi}@kit.edu
Commission V, ICWG I/Va
KEY WORDS: Laser scanning, low-cost, lightweight, multi-echo, segmentation, grape berries
ABSTRACT:
Mobile sensor devices offer great opportunities for automatic scene analysis and object recognition. Nowadays a new generation of ranging devices is available, like laser scanners which are small and light weighted. Concerning these improvements specific applications can be tackled. In this contribution we focus on vineyard monitoring for detecting and counting grape berries with a small, lightweight and low cost multi-echo laser scanner. Therefore a Hokuyo UTM-30LX-EW laser range finder is utilized for capturing the data in close range up to 1m. In order to process the data the following methodology is proposed: after smoothing and morphological techniques are applied on the laserscanning intensity and range images the number of visible grape berries is determined from the resulting segments. The approach performs with a detection accuracy of above 84%. The results reveal the high potential of such close range ranging devices for locating and counting grape berries. Thus, the methodology provides practical support for viticulture applications.
1. INTRODUCTION
The knowledge about the grape quantity is an important topic for vineyard management. The still dominating strategy to provide vineyard managers information for making decisions involves manpower and is thus labour-intensive as well as too sparse for capturing the spatial variability within a vineyard. In order to provide the respective information in digital form, it is possible to use vehicles which are equipped with cameras and/or laser scanners and move through the vineyard rows. Such a dense, non-destructive vineyard monitoring allows frequent pre-harvesting analyses and significantly alleviates decisions for different viticulture applications and harvesting activities.
Using camera images for making dense observations of grape quantity has been addressed in recent years. Once image information is available, standard methods from computer vision can be applied to automatically detect and count grape berries. The gained information can then be exploited to forecast yield with both precision and accuracy. However, it has to be taken into account that the extraction of grape berries from images is often limited due to shadows and occlusions caused by leaves within the grape canopy. Furthermore, there might be a varying appearance under different lighting conditions during daytime and a weak color contrast between grape berries and leaves.
The increasing availability of laser scanners has changed this situation during the last years. Such active optical sensors are capable to capture dense and accurate 3D information about surfaces of objects in the local area around the scanner with respect to a local coordinate frame. The new generation of laser scanners additionally provides radiometric information in form of intensity measurements representing the respective energy of the backscattered laser light. Some laser scanners meanwhile even provide the capability to measure multiple echoes for each
single emitted laser pulse which are likely to correspond to different 3D structures in the respective direction. Multiple echoes offer the possibility to efficiently detect edges of objects. All these information together are promising data sources to detect the berries of a grape bunch surrounded by leaves.
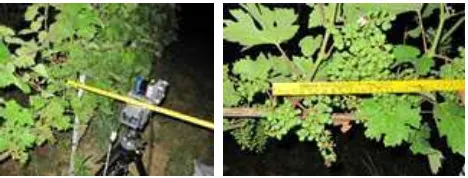
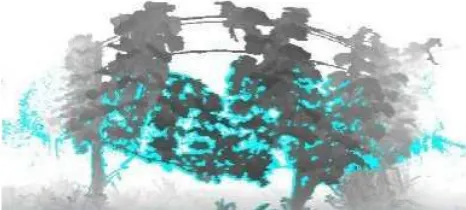
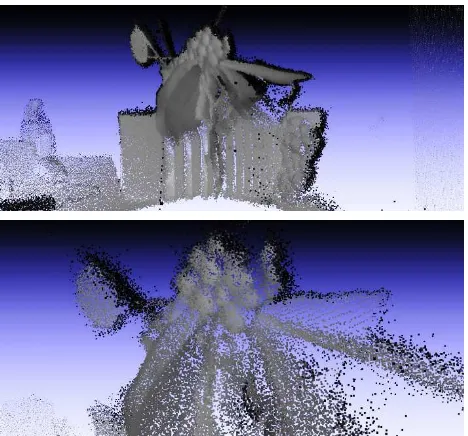
For the example of monitoring grape canopy at the early stage of grape ripening (Figure 1), the data acquired with a lightweight and low-cost multi-echo line laser scanner (Hokuyo UTM-30LX-EW) rotating on a tripod is visualized in Figure 2 as 3D point cloud, where the distance between the grape canopy and the laser scanner was approximately 30 cm. The respective 2D representations in form of intensity image and range image are depicted in Figure 3 and Figure 4, and highlighted areas indicate the occurrence of multiple echoes at edges. It becomes visible that grape berries are hardly visible in the 3D point cloud at this early stage of grape ripening and a large amount of noise may be expected (Figure 2). In contrast, the image representations provide more interpretable structures (Figure 3 and Figure 4).
Figure 1: Photos showing the early stage of grape ripening.
Figure 2: Visualized 3D point cloud of the grape canopy at the early stage of grape ripening.
Figure 3: Intensity image with highlighted areas arising from multiple echoes at edges.
Figure 4: Range image with highlighted areas arising from multiple echoes at edges.
In this paper, we present an automatic methodology for detecting grape berries from laser scanning data. We explicitly focus on the use of small, lightweight and low cost multi-echo laser scanners as these can easily be mounted on a mobile platform and still cope with data acquisition. In summary, we investigate
• the capability and performance of a small, lightweight and low cost multi-echo laser scanner to capture small objects such as grape berries, and
• the automatic detection of single grape berries as well as counting their number from the captured data.
The derived experimental results demonstrate that small, lightweight and low cost multi-echo laser scanners offer a high potential for detecting grape berries.
The paper is organized as follows. In Section 2, we briefly describe the related work. Subsequently, in Section 3, we present our methodology for detecting grape berries. The sensor used for data acquisition and the test scenario are introduced in
Section 4. Experimental results are provided in Section 5 and demonstrate the performance of the proposed methodology. Finally, in Section 6, concluding remarks are provided and suggestions for future work are outlined.
2. RELATED WORK
There have already been various attempts to detect grape berries from different data sources. The detection of grape berries from image data has been a topic of research for more than ten years, and approaches for detecting other types of fruits can easily be transferred.
Recent investigations address the localization of fruit on trees (Jimenez et al., 2000), quality control and the respective sorting of cherries (Rosenberger et al., 2004), the automatic selection of ‘fruit’ pixels by thresholding color values and tolerances (Dunn and Martin, 2004), the detection of peel defects on citrus fruits (Blasco et al., 2007), and olive classification with respect to quality constraints (Diaz et al., 2004; Riquelme et al., 2008). Furthermore, detecting the curved surfaces of grapes by terahertz imaging has been proposed (Federici et al., 2009) as well as a method for the automatic extraction of grape berries by using a smartphone (Grossetête et al., 2012). In the latter case, the integrated flash of the smartphone is used, and the reflection of light on the berry surface is more or less a specular reflection. The maximum of reflection is on the center of the berry, and this light reflection significantly decreases from the center of a grape berry to the boundary. Consequently, the extraction strategy exploits the locations with maximum reflection for counting the berries.
As alternative, a method to detect and count grape berries by exploiting shape and visual texture in images has been proposed (Nuske et al., 2011; Nuske et al., 2012). The selection of these visual features directly addresses the crucial issues of different lighting and lack of color contrast. More specifically, potential berry locations are detected with a radial symmetry transform. Locations that have similar appearance to grape berries are then identified by considering a respective local image patch for each potential berry location and deriving a feature vector which consists of generic low-level features in terms of color features and Gabor features.
Furthermore, the use of 3D reconstructions generated from uncalibrated image sequences has been proposed for classifying plant structures such as leaves, branches and fruit (Dey et al., 2012). The respective plant structures are identified using both color and local 3D shape features. Basic 3D shape features have been investigated analytically for describing object structures (Jutzi and Gross, 2009), and a detailed analysis of the relevance of a variety of local 3D shape features for the semantic interpretation of 3D point cloud data has recently been presented (Weinmann et al., 2013).
Further investigations also involve the combination of different sensors. Attaching cameras and laser scanners to vineyard machinery has for instance been proposed for estimating crop weight and canopy volume (Grocholsky et al., 2011). The applied laser scanners cover a field-of-view of 180° and generate 75 scans per second while the vehicle is moved through the vineyard.
Beside the detection of grape berries, a further challenge consists of extracting stem skeletons, i.e. bunches of grapes
where the berries have been removed. Recent investigations involve Relational Growth Grammars (Schöler and Steinhage, 2012) to derive semantically annotated 3D reconstruction hypotheses of plant architectures from 3D sensor data, i.e. laser range measurements.
The further analysis of grape berries has for instance been addressed in a lab. Destemming, positioning on a special construction and taking images are the basic requirements for an image interpretation tool referred to as Berry Analysis Tool (BAT) (Kicherer et al., 2013) which was recently introduced for acquiring the number, diameter, and volume of grape berries from from RGB color images. The tool is based on active learning to distinguish between the labels berry and background as well as morphological techniques to remove noise. Once grape berries are detected, their number and their diameter are estimated. Subsequently, their volume is calculated for which the grape berries are supposed to be ellipsoids.
3. METHODOLOGY
The proposed methodology consists of two major steps. Firstly, a segmentation of the image is derived and it is taken into account that many approaches for image segmentation tend to oversegmentation. In order to avoid such an oversegmentation, a smoothing and morphological techniques are involved (Najman and Schmitt, 1996). In the second step, the number of visible grape berries is determined from the resulting information on the segments.
3.1 Image Segmentation
Firstly, the intensity information is transformed into grayscale images by histogram normalization. In the next step, the gradient magnitude is derived which is high at the borders of objects and lower inside the objects. For this purpose, the image is convolved with the Sobel operators in horizontal and vertical direction which yields the partial derivatives Ix and Iy of the
image function I at each pixel (x,y) in form of gradient images. From these partial derivatives Ix and Iy, the corresponding
gradient magnitude is derived for each pixel.
Subsequently, foreground objects are extracted by assuming that there are connected blobs of pixels inside each of the foreground objects. For this purpose, morphological techniques are applied in form of (i) morphological opening (i.e. erosion followed by dilation) which removes smaller objects and (ii) morphological closing (i.e. dilation followed by erosion) which removes small holes in the remaining foreground areas. As result, flat regional maxima are derived inside each object which represent foreground markers. Furthermore, it is beneficial if background objects can be marked as well. This can easily be achieved by considering the image after applying the morphological techniques and assigning all the pixels which are darker than a certain threshold to the background. The regional minima represent background markers. All the derived regional maxima and minima are then used to modify the gradient magnitude image.
Finally, a watershed segmentation (Vincent and Soille, 1991) which represents a region-based segmentation approach is applied on the modified gradient magnitude image. In general, the watershed transform is based on the idea of interpreting a grayscale image as topographic relief where the value of a pixel represents its altitude, i.e. bright pixels represent high altitudes and dark pixels represent low altitudes. A drop of water falling
on the relief flows along the steepest descent towards a local minimum. All points on the relief from which a drop of water reaches the same local minimum form a catchment basin, and watersheds separate adjacent catchment basins. Since the structure of an image can be quite complex, the watershed segmentation typically tends to a strong oversegmentation. In order to avoid such an oversegmentation, the modified gradient magnitude images are considered here.
3.2 Detection of Grape Berries
Considering the locations of the derived regional maxima inside each object, i.e. the foreground markers, a connected component analysis can be applied in order to connect pixels to local regions and thus obtain distinct components. For detecting grape berries, the ratio between the lengths of major and minor axes of each connected component is determined. From these, the respective eccentricity e is derived. Components whose eccentricity equals 0 represent circular regions, and components with 0 < e < 1 represent elliptical regions. Consequently, for detecting almost circular regions, a simple thresholding based on eccentricity can be applied to discard irrelevant components and thus only obtain components arising from visible grape berries. The number of visible grape berries may be used as objective information to support decisions in vineyard management. Later on, for the experiments, the counting is also performed manually in order to get ground truth data for evaluating the obtained results.
4. SENSOR AND DATASET
In this section, we introduce the utilized sensor and provide an impression of the captured dataset.
4.1 Sensor
The data are captured with a Hokuyo UTM-30LX-EW laser range finder (210 g without cable) which represents a small, lightweight and low-cost laser scanner well-suited for robotic applications. This laser scanner takes measurements in a single plane and provides 2D scans covering a scan angle of 270° with an angular resolution of 0.25°. According to the specifications (Hokuyo Specifications, 2013), the range measurement resolution is 1 mm, and the accuracy is specified with ±30 mm within a range of 0.1-10 m and ±50 mm within a range of 10-30 m. The emitted laser pulses have a wavelength of λ = 905 nm,
the laser safety is class 1 and the pulse repetition rate is specified with 43 kHz. For each reflected laser pulse, data in terms of range and intensity information are measured.
Additionally, it has to be considered that up to three echoes can be measured for each single emitted laser pulse. In general, the number of echoes depends on the surface properties (i.e. shape and reflectivity) of the respective objects. Often, the second echo results from a partially occluded structure in the original pulse direction and can thus be treated as an additional range measurement. The capability to measure multiple echoes even makes the device suitable for use under heavy conditions like rain, smoke, mist or dust (Djuricic and Jutzi, 2013). Thus, adequate measurements can even be expected if there are dew drops present on the grape berries.
4.2 Dataset
The proposed approach is applied on a small test dataset captured within an indoor environment. The main intention of
our test scenario is to preserve the main characteristics of visible berries in a vineyard. Consequently, the scene contains visible berries, leaves, stems and some gaps. In order to estimate the adequate distance for future outdoor measurements with the available sensor, the scanner was placed approximately 25 cm, 50 cm and 1 m from our observed objects - two bunches of grape berries positioned along the horizontal and vertical direction. The resulting intensity images and range images are depicted in Figure 5 and Figure 6. The bunches of grape berries (highlighted by red boxes in Figure 5) can easily be seen in the intensity images. A visualization of the respective 3D point cloud is depicted in Figure 7 at two different scales.
Figure 5: Intensity images for object distances of approximately 25 cm, 50 cm and 1 m (from left to right). The red boxes highlight the regions of interest, i.e. the regions with bunches of grape berries.
Figure 6: Range images for object distances of approximately 25 cm, 50 cm and 1 m (from left to right). Smaller distances are encoded with darker pixel values, whereas larger distances are encoded with brighter pixel values.
Figure 7: Visualization of the 3D point cloud acquired for the test scenario (top) and zoom on the upper region of interest (bottom).
5. EXPERIMENTAL RESULTS AND DISCUSSION
For comparison, we first apply a standard region growing algorithm on the intensity image of a bunch of grape berries. First, an initialization is conducted by selecting seed points which themselves form regions of minimum size. Subsequently, in an iterative process, each region is grown by comparing all unallocated neighbouring pixels to the region. For this purpose, the difference between a pixel's intensity value and the region's mean intensity value is used as a measure of similarity. The pixel with the smallest difference is allocated to the region. The process stops when the intensity difference between region mean and new pixel becomes larger than a specified threshold. The derived results for our dataset are depicted in Figure 8 and show that single berries can hardly be counted.
Figure 8: Results of a standard region growing at the two regions of interest in the intensity images.
In contrast, the proposed methodology based on morphological operations followed by watershed segmentation allows to derive interpretable results by means of detecting and counting the touching objects from regional maxima representing foreground markers (Figure 9). As the edges are also marked, the respective regional maxima have to be excluded. By applying connected component analysis and filtering with respect to eccentricity, the presented extraction strategy is able to locate and count grape berries (Figure 10). Similar to using digital cameras and flash (Grossetête et al., 2012), the remaining regional maxima correspond to the maxima of reflection on the center of the berries, and the light reflection decreases from the center of a grape berry to the boundary.
Figure 9: Original range image with highlighted areas arising from multiple echoes (left) and regional maxima overlapped on original image (right).
Figure 10: Example showing regional maxima (left) and the detected grape berries after filtering with respect to eccentricity (right).
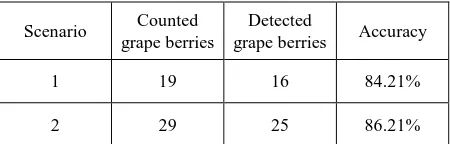
Furthermore, we assess the detection results for the two bunches of grape berries by comparison to a manually determined ground truth data as reference. For both scenarios, we obtain detection accuracies of 84.21% and 86.21% (Table 1) which reveals the feasibility of the proposed methodology.
Scenario Counted grape berries
Detected
grape berries Accuracy
1 19 16 84.21%
2 29 25 86.21%
Table 1: Detection results for two different scenarios.
Finally, a comparison is performed by applying the proposed methodology on an intensity image and the respective range image. The results of the single steps in the processing chain are depicted in Figure 11 and Figure 12. It becomes visible that range images are not suitable for detecting and counting single grape berries with the presented methodology, and that further effort is required in this case.
Figure 11: Watershed segmentation results based on the intensity image: Original intensity image, gradient magnitude, regional maxima, regional maxima superimposed on original intensity image and colored watershed label matrix (from left to right).
Figure 12: Watershed segmentation results based on the range image: Original range image, gradient magnitude, regional maxima, regional maxima superimposed on original range image and colored watershed label matrix (from left to right).
6. CONCLUSIONS AND FUTURE WORK
In this paper, we present a methodology for automatically detecting grape berries from data acquired with small, lightweight and low cost multi-echo laser scanners. The selection of such devices is motivated by the fact that these can easily be mounted on a mobile platform for vineyard monitoring. In the first step, potential berry locations are detected by exploiting morphological techniques and watershed segmentation. In the second step, connected component analysis and filtering with respect to eccentricity are applied to refine the detection results and finally count the detected berries. The derived experimental results reveal the high potential of small, lightweight and low cost multi-echo laser scanners for detecting grape berries. Thus, the methodology provides practical support for viticulture applications.
The fully automatic monitoring of properties such as growth, yield, quantity, color, ripeness and their development over time is not only of great interest for vineyard management, but also for food industry in general. Once automatic, frequent and dense monitoring is possible in agriculture, it is possible to forecast yield with both precision and accuracy. A further automation could lead to a fully automatic process consisting of pre-harvesting analyses, informed decisions and harvesting activities which would substantially increase efficiency, significantly reduce the required manpower and save a lot of money over a long time.
Hence, for future work, the methodology could be extended to also account for specific properties such as the precise size of each detected berry or the number of berries in a bunch of grape berries in order to estimate and predict the volume of the income for the actual year of harvest. Additionally, an automatic detection of bunches of grape berries would be desirable.
Furthermore, the combined use of the different types of data should be taken into account. For this purpose, it would be desirable to perform a dense scanning in order to obtain dense 3D point cloud data. Once the point density is sufficiently high, a variety of local 3D features can be extracted for each measured 3D point from the spatial arrangement of other 3D points in its local neighborhood (Weinmann et al., 2013; Otepka et al., 2013). These features could be utilized for better detecting and localizing small objects such as single grape berries in the 3D point cloud data. For special objects such as grape berries which provide a spherical 3D structure, a fitting of respective 3D primitives could also be introduced. It would further be interesting to fuse data captured with a suitable laser scanner and data captured with a digital camera (Jutzi et al., 2014) as the additional data would possibly contribute to improve an automatic interpretation of the observed scene.
ACKNOWLEDGEMENT
Ana Djuricic was supported by the German Academic Exchange Service (DAAD) scholarship. The authors thank Sven Wursthorn for assistance during data acquisition. We appreciate the suggestions and comments of Clément Mallet and Karolina Korzeniowska.
REFERENCES
Blasco, J., Aleixos, N. and Moltó, E., 2007. Computer vision detection of peel defects in citrus by means of a region oriented segmentation algorithm. Journal of Food Engineering, 81(3), pp. 535-543.
Dey, D., Mummert, L. and Sukthankar, R., 2012. Classification of plant structures from uncalibrated image sequences.
Proceedings of the IEEE Workshop on Applications of Computer Vision, pp. 329-336.
Diaz, R., Gil, L., Serrano, C., Blasco, M., Moltó, E. and Blasco J., 2004. Comparison of three algorithms in the classification of table olives by means of computer vision. Journal of Food
Engineering, 61(1), pp. 101–107.
Djuricic, A. and Jutzi, B., 2013. Supporting UAVs in low visibility conditions by multiple-pulse laser scanning devices.
The International Archives of the Photogrammetry, Remote Sensing and Spatial Information Sciences, Vol. XL-1/W1, pp.
93-98.
Dunn, G.M. and Martin, S.R., 2004. Yield prediction from digital image analysis: A technique with potential for vineyard assessments prior to harvest. Australian Journal of Grape and
Wine Research, 10(3), pp. 196-198.
Federici, J.F., Wample, R.L., Rodriguez, D. and Mukherjee, S., 2009. Application of terahertz Gouy phase shift from curved surfaces for estimation of crop yield. Applied Optics, 48(7), pp. 1382-1388.
Grocholsky, B., Nuske, S., Aasted, M., Achar, S. and Bates, T., 2011. A Camera and Laser System for Automatic Vine Balance Assessment. Proceedings of the ASABE Annual International
Meeting.
Grossetête, M., Berthoumieu, Y., Da Costa, J.P., Germain, C., Lavialle, O. and Grenier, G., 2012. Early estimation of vineyard yield: site specific counting of berries by using a smartphone.
Proceedings of the International Conference of Agricultural Engineering.
Hokuyo Specifications, 2013. Scanning laser range finder UTM-30LX/LN specification. www.hokuyo-aut.jp (last access: 26.11.2013).
Jiménez, A.R., Ceres, R. and Pons, J.L., 2000. A survey of computer vision methods for locating fruit on trees. Transaction
of the ASAE, 43(6), pp. 1911-1920.
Jutzi, B. and Gross, H., 2009. Nearest neighbour classification on laser point clouds to gain object structures from buildings.
The International Archives of the Photogrammetry, Remote Sensing and Spatial Information Sciences, Vol. XXXVIII, Part
1-4-7/W5.
Jutzi, B., Weinmann, M. and Meidow, J., 2014. Weighted data fusion for UAV-borne 3D mapping with camera and line laserscanner. International Journal of Image and Data Fusion, Submitted.
Kicherer, A., Roscher, R., Herzog, K., Šimon, S., Förstner, W. and Töpfer, R., 2013. BAT (Berry Analysis Tool): A high-throughput image interpretation tool to acquire the number, diameter, and volume of grapevine berries. Vitis, 52(3), 129-135.
Najman, L. and Schmitt, M., 1996. Geodesic saliency of watershed contours and hierarchical segmentation. IEEE
Transactions on Pattern Analysis and Machine Intelligence,
18(12), pp. 1163-1173.
Nuske, S., Achar, S., Bates, T., Narasimhan, S. and Singh, S., 2011. Yield estimation in vineyards by visual grape detection.
Proceedings of the IEEE/RSJ International Conference on Intelligent Robots and Systems, pp. 2352-2358.
Nuske, S., Gupta, K., Narasimhan S. and Singh S., 2012. Modeling and calibration visual yield estimates in vineyards.
Proceedings of the International Conference on Field and Service Robotics.
Otepka, J., Ghuffar, S., Waldhauser, C., Hochreiter, R. and Pfeifer, N., 2013. Georeferenced point clouds: a survey of features and point cloud management. ISPRS International
Journal of Geo-Information, 2(4), pp. 1038-1065.
Riquelme, M.T., Barreiro, P., Ruiz-Altisent, M. and Valero, C., 2008. Olive classification according to external damage using image analysis. Journal of Food Engineering, 87(3), pp. 371– 379.
Rosenberger, C., Emile, B. and Laurent, H., 2004. Calibration and quality control of cherries by artificial vision. Journal of
Electronical Imaging, 13(3), pp. 539-546.
Schöler, F. and Steinhage, V., 2012. Towards an Automated 3D Reconstruction of Plant Architecture. In: Schürr, A., Varró, D. and Varró, G. (Eds.), Applications of Graph Transformations with Industrial Relevance. LNCS, Vol. 7233, pp. 51-64. Springer, Heidelberg, Germany.
Vincent, L. and Soille, P., 1991. Watersheds in Digital Spaces: An Efficient Algorithm Based on Immersion Simulations. IEEE
Transactions on Pattern Analysis and Machine Intelligence,
13(6), pp. 583-598.
Weinmann, M., Jutzi, B. and Mallet, C., 2013. Feature relevance assessment for the semantic interpretation of 3D point cloud data. ISPRS Annals of the Photogrammetry, Remote
Sensing and Spatial Information Sciences, Vol. II-5/W2, pp.
313-318.