The economics of coupled farm subsidies under costly
and imperfect enforcement
Konstantinos Giannakas
a,∗, Murray Fulton
baDepartment of Agricultural Economics, University of Nebraska-Lincoln, Lincoln, Nebraska, USA 68583-0922 bDepartment of Agricultural Economics and Centre for the Study of Co-operatives, University of Saskatchewan,
Saskatoon, Sask., Canada S7N 5A8
Received 30 January 1998; received in revised form 22 July 1999; accepted 31 August 1999
Abstract
This study relaxes the assumption of perfect and costless policy enforcement found in traditional agricultural policy analysis and introduces enforcement costs and cheating into the economic analysis of output subsidies. Policy design and implementation is modeled in this paper as a sequential game between the regulator who decides on the level of intervention, an enforcement agency that determines the level of policy enforcement, and the farmer who makes the production and cheating decisions. Analytical results show that farmer compliance is not the natural outcome of self-interest and complete deterrence of cheating is not economically efficient. The analysis also shows that enforcement costs and cheating change the welfare effects of output subsidies, the efficiency of the policy instrument in redistributing income, the level of government intervention that transfers a given surplus to agricultural producers, the socially optimal income redistribution, and the social welfare from intervention. ©2000 Elsevier Science B.V. All rights reserved.
JEL classification:H22; H23; K42; Q18
Keywords:Agricultural policy; Enforcement; Misrepresentation; Subsidies; Transfer efficiency
1. Introduction
The traditional analysis of production subsidies (per unit and ad valorem subsidies) and deficiency payments takes place under the assumption that ei-ther farmers comply completely with the provisions of these farm programs or policy enforcement is per-fect and costless. If cheating on farm programs is
∗Corresponding author. Present address: Department of
Agricul-tural Economics, University of Nebraska-Lincoln, 216 H.C. Filley Hall, Lincoln, Nebraska, USA 68583-0922. Tel.: 1-402-472-2041; fax: +1-402-472-3460
E-mail address:[email protected] (K. Giannakas)
profitable however, full compliance is by no means assured unless monitoring and enforcement are cost-lessly carried out.1 Because of the cost associated
with investigating farmers and punishing the detected cheaters, program enforcement is likely to be
incom-1 Monitoring refers to the actions taken by policy makers to de-termine whether a farmer complies with the provisions of the sub-sidy program and includes on-site inspections and reviewing the records of a farm. Enforcement refers to the process of moving violators into compliance through penalties and/or criminal prose-cution for instance. In what follows, the terms monitoring and/or enforcement will be used interchangeably to denote the process of investigating farmers and punishing the detected cheaters. 0169-5150/00/$ – see front matter ©2000 Elsevier Science B.V. All rights reserved.
76 K. Giannakas, M. Fulton / Agricultural Economics 22 (2000) 75–90
plete. Imperfect enforcement in turn creates economic incentives for farmers to cheat on the farm program.
In fact, cases of cheating on farm programs are often reported by the European Press (Moyer and Josling, 1990). Fraud is considered to be an integral part of the common agricultural policy (CAP) (Ockenden and Franklin, 1995; Gardner, 1996). Gardner argues that the manipulation of regulations “to milk the maximum in subsidies” from the European Union’s (EU) farm budget, “is not only common, standard practice. . . but is also accepted as standard practice” (Gardner, 1996, pp. 44).
The possibility of cheating on subsidy programs in the EU arises from the fact that eligibility for most government payments usually requires farm-ers to make an application for the payment (Harvey, 1997).2 By over-reporting the level of their
produc-tion on the applicaproduc-tion, farmers can collect payments on quantities greater than those produced. A recent report on the extent of cheating on farm subsidies in the EU estimates the ‘losses’ through fraud and lax controls in the payment of farm subsidies and subsidy overpayments to $4 billion per year.3 These cheating costs account for up to 10% of the 36 billion ECU a year laid out on agricultural support through the CAP (Gardner, 1996).
Cheating on farm programs is not an exclusive Eu-ropean characteristic however. In the United States, the existence of a United States Department of Agricul-ture (USDA) ‘hotline’, where cases of ‘fraud’ related to ‘submission of false claims/statements’ can be re-ported, indicates that the problem of cheating on farm programs is not unknown to US agricultural policy makers (USDA Office of Inspector General, 1999).
Very few studies have incorporated misrepresenta-tion or cheating in theoretical agricultural policy anal-ysis. Among the exceptions are Alston and Smith (1983) who raise the question of cheating and ‘black market’ activity in an examination of rationing in an industry with an effective minimum price policy in place and Giannakas (1998) who examines the inci-dence of output quotas, deficiency payments and
de-2There are complaints heard throughout Europe that farmers spend more time filling in forms than farming (Ockenden and Franklin, 1995).
3EU fraud and waste on farm subsidies, 117 Journal of Com-merce, 22 December 1997.
coupled area payments under costly and imperfect en-forcement.4
The purpose of this study is to introduce enforce-ment costs into the economic analysis of output sub-sidies (production subsub-sidies and deficiency payments) and to examine the causes and consequences of farmer misrepresentation. The consequences of cheating for the incidence of output subsidies are considered in the context of a static, partial equilibrium model of a closed economy. A key element of the subsidy pol-icy modeled in this paper is that farmers report their own production. Therefore, the results of the analysis apply to cases where eligibility for government sub-sidies requires farmers to make an application for the payment.
Analytical results show that compliance with policy rules is not the expected producer behavior and com-plete deterrence of cheating is not economically effi-cient. The analysis also shows that enforcement costs and cheating change the welfare effects of output sub-sidies, the efficiency of the policy instrument in trans-ferring income to agricultural producers, the level of government intervention that transfers a given surplus to producers, the socially optimal income redistribu-tion, and the social welfare from intervention. The rel-evance of the analysis for a small open economy and the large country case is discussed throughout the text.
2. Agricultural policy making
The agricultural policy making structure in most countries, and certainly the EU and the US, is charac-terized by a separation of powers between the agen-cies responsible for policy design and policy enforce-ment. In the EU, the level of the transfer is decided by the Council of Ministers of Agriculture and the coun-tries/members are assigned the implementation and
enforcement of the policy (Runge and von Witzke, 1987; From and Stava, 1993; Swinbank, 1997). In the US, the legislative body of the government (i.e., the Congress) decides on the farm policy and the level of transfer to producers and the USDA is responsible for carrying out the programs (Gardner, 1987; Moyer and Josling, 1990). More specifically, the Secretary of Agriculture decides on the level of the policy instru-ment that achieves the policy objectives, and the Agri-cultural Stabilization and Conservation Service (now the Farm Services Agency) implements and enforces the commodity programs.
To capture this separation of activities, an institu-tional arrangement characterized by decentralized pol-icy making is adopted in this paper. More specifically, policy design and implementation is modeled in this paper as a sequential game between the regulator who decides on the level of intervention, an enforcement agency that determines the level of policy enforce-ment, and the farmer who decides on the quantity to produce and the quantity to misrepresent. The pay-off functions of all agents are assumed to be com-mon knowledge. The regulator moves first and de-cides on the subsidy knowing exactly how her deci-sions will affect enforcement and misrepresentation. Optimal enforcement is determined next. Finally, the farmer makes his production and cheating decisions, observing both the policy variable and the enforce-ment parameters. Different scenarios concerning the political preferences of the enforcement agency and the decision variables it controls are examined within this framework.
All formulations of the sequential game developed in this paper are solved using backwards induction (Kreps, 1990; Gibbons, 1992). The problem of the farmer is considered first, the problem of the enforce-ment agency follows and, finally, the solution to the problem of the regulatory agency determines optimal intervention, enforcement and misrepresentation.
3. Output subsidies and optimal farmer misrepresentation
Production subsidies and deficiency payments have often been used by policy makers, alone or in conjunc-tion with other policies like price supports, supply con-trols, and/or trade policies, to encourage production of
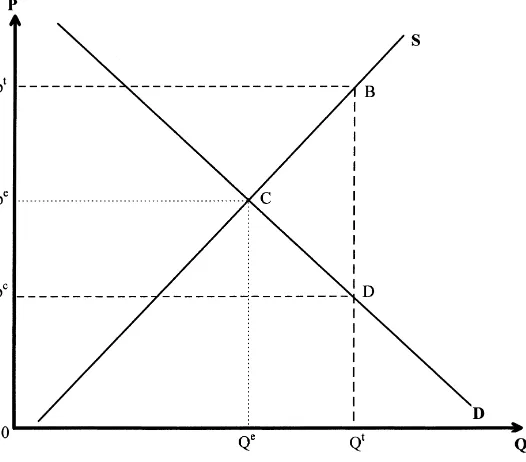
a specific commodity and/or to transfer income to pro-ducers. Both producers and consumers have benefited from production subsidies and deficiency payments while taxpayers have incurred the costs. Fig. 1 de-picts the traditional static, partial equilibrium welfare effects of a production subsidy scheme for a closed economy with linear approximations of supply and de-mand curves (Nerlove, 1958; Wallace, 1962). In this static context the production subsidy program is iden-tically equivalent to a target price-deficiency payment scheme.5 In what follows, the terms output subsidy and subsidy will be used to denote a production sub-sidy and/or a deficiency payment.
Under a per unit output subsidy ofv, producers re-ceive an increase in producer surplus equal to the area
ptBCpe, consumers gain areapeCDpc, while taxpay-ers lose area (1 +d)ptBDpc, whered is the marginal deadweight loss from taxation (Ballard and Fullerton, 1992). Taxpayers’ cost is given by the product of the market clearing quantity and the subsidy paid to farm-ers, adjusted to account for the positive deadweight losses from taxation. The distortionary costs of mar-ket intervention equal the area BCD plusd(ptBDpc) (Gardner, 1983,1987; Alston and Hurd, 1990). The implicit assumption in this analysis is that farmers do not misrepresent their production, i.e., farmers do not cheat.
Given the increased benefits from an output sub-sidy scheme, however, farmers may find it econom-ically optimal to increase further their returns by over-reporting the level of their production and col-lecting government payments for phantom output. Assuming farmers know with certainty the subsidy for their production, the penalty in case they are caught cheating, and the probability of being investigated,
78 K. Giannakas, M. Fulton / Agricultural Economics 22 (2000) 75–90
Fig. 1. The welfare effects of production subsidies and deficiency payments.
their decision on whether to cheat (and if so, by how much) can be modeled as decision-making under un-certainty. In this framework, the individual farmer’s choice can be viewed as a choice between a certain outcome (profits if he does not cheat) and his profits in case he misrepresents his level of production. As-suming the representative farmer is risk neutral, his objective function can be written as:
maxqt,q
mE[5]=(p
c+v)qt−c(qt)
+[(1−δ)v−δρ]qm (1)
where pc is the market clearing price; v the output subsidy;qt quantity produced;c(qt) cost function;qm
is the quantity reported as eligible for payments over and aboveqt;ρis the per unit penalty charged on de-tected misrepresentation; andδ is the probability that the farmer will be audited.6 If the farmer is
cheat-6The model in Eq. (1) can be modified to include risk aversion of the representative farmer and/or private costs from cheating. The risk averse farmer will choose qm that maximizes his ex-pected utility(i.e., maxqt,qmE[U (5)]=(1−δ)U[(pc+v)qt−
c(qt)+vqm]+δU[(pc+v)qt−c(qt)−ρqm]). In terms of output misrepresentation, risk aversion results in reduced cheating rela-tive to the case where risk neutrality is assumed. Cheating also
ing on the farm program,δreflects the probability he will be detected and punished. The probability of au-dit takes values between 0 and 1 (i.e.,δ∈[0,1]) and reflects the intensity with which agricultural policy is enforced and with which cheating is investigated.
The audit probability is assumed to be a linear function of the amount of cheating, i.e.,δ=δ0+δ1qm,
whereδ0is a fixed base probability andδ1qmis a
com-ponent that depends on the misrepresented quantity. The parameterδ0is assumed to be dependent on the resources spent for policy enforcement. The parame-terδ1depends on factors affecting the observability of
farmers’ actions (e.g., such as location and dispersion of the farms) and is assumed to be strictly positive and exogenous to both policy enforcers and producers.
The first order conditions for the representative
Eq. (2) shows that the farmer will produce where the market price plus subsidy equals the marginal cost of production. Note that the optimal output level does not depend on any of the parameters associated with farmer misrepresentation.
Eq. (3) shows the optimal choice of the quantity misrepresented by the representative farmer as a func-tion of subsidy payments, per unit penalty and audit probability parameters. Eq. (3), thus, reflects the best response of the farmer to the choices made by the regu-latory and enforcing agencies. Consistent with a priori expectations, misrepresented quantity increases with the subsidy payment and decreases with an increase in the audit probability and per unit penalty parameters (i.e.,∂qm/∂v>0,∂qm/∂δ0<0 and∂qm/∂ρ <0).
Manipulation of the expression forqmindicates that
the over-reported quantity is positive whenδ0is less
thanv/(v+ρ), whenvis greater thanδ0ρ/(1−δ0), or
whenρis less than(1−δ0)v/(δ0). These critical values
forδ0, v and are denotedδ0nc,vncandρnc, respectively,
where the superscript nc stands for no cheating. A manipulation of Eq. (3) shows that the opti-mal level of misrepresentation is given by equating
v/(v+ρ) andδ0+2δ1qm. Fig. 2 shows this
relation-ship graphically. The horizontal line v/(v+ρ) shows the ratio of the marginal benefits in case cheating goes undetected, over the opportunity cost in case the farmer is caught cheating. The line δ0+2δ1qm
shows the change in the output that is expected to be penalized for a change in the quantity misrepresented, or the marginal penalized output (MPO). Finally, line delta in Fig. 2 graphs the audit probability,δ.
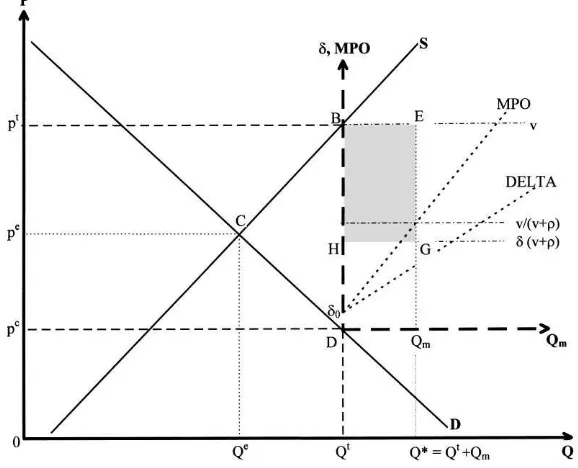
Fig. 3 graphs the determination of optimal misrep-resentation at the industry level. The lines DELTA and MPO are the horizontal summation of individual farm-ers’ delta and MPO curves, respectively. Both curves have an intercept ofδ0when they are graphed relative
to the origin ofDin Fig. 3. The slopes of DELTA and MPO curves areδ1/Nand 2δ1/N, respectively, whereN
is the number of representative farmers producing the subsidized commodity. The intersection of v/(v+ρ) and MPO gives the aggregate quantity misrepresented at equilibrium which can be written as
Qm=N qm=
When the combination of policy variable and en-forcement parameters are such that farmers misrepre-sent their production, traditional analysis fails to con-sider the area BEGH. This area represents farmers’ expected benefits from cheating,E[Bc]=[v−δ(v+
ρ)]Qm. The benefits from cheating constitute a
de-coupled income transfer from taxpayers to producers, since the transfer does not affect farmers’ production decisions.7
Even though not present in the stylized Fig. 3, mon-itoring and enforcement costs should be included in both the taxpayers’ costs and the welfare losses from market intervention. The resource costs of enforcing the program by investigating the farmers and convict-ing the detected cheaters, denoted as 8(δ0), are
as-sumed to be a non-decreasing function of the base au-dit probability (i.e.,8′(δ0)≥0,8′′(δ0)≥0).
There are also fixed costs associated with the oper-ation of the enforcement agency. These costs are not incorporated into the model. The reason for the ex-clusion of these fixed costs lies in the presumption that the existence of the agency responsible for policy enforcement depends on government intervention in agriculture rather than the presence of any commodity program in particular.
80 K. Giannakas, M. Fulton / Agricultural Economics 22 (2000) 75–90
Fig. 2. Optimal farmer misrepresentation on output subsidies (cheating equilibrium).
Fig. 3. The welfare effects of output subsidies under costly enforcement and misrepresentation.
4. Optimal enforcement by the enforcement agency
Eq. (4) indicates that farmer misrepresentation un-der a subsidy scheme depends on the level of the
agencies to the (optimizing) behavior of the farmers (which has been shown to include cheating when al-lowed by the circumstances).
This section of the paper examines the problem of policy enforcers. The problem of the enforcement agency is to determine the degree to which the sub-sidy scheme designed by the regulator is enforced. In making this decision, the enforcement agency knows exactly how its decisions will affect the (optimizing) behavior and welfare of farmers.
The level of enforcement is determined by the en-forcement parameters, the audit probability and the penalties. Penalties for producers detected cheating on farm programs are generally set elsewhere in the legal system and are, therefore, exogenous to agricultural policy makers. Withρ exogenous to agricultural pol-icy makers, the problem of the enforcement agency is the determination of the δ0that maximizes its
ob-jective function. The general form of the enforcement agency’s problem can be written as:
maxδ0W =θPS+TS supply functions, respectively, and θ is the weight placed by the enforcement agency on producer wel-fare. All other variables are as previously defined. The consumer surplus is not included in the objective func-tion of policy enforcers since, for any output subsidy
v, cheating involves direct transfers from taxpayers to producers. Thus, consumer welfare is not affected by the amount of enforcement and farmer misrepresenta-tion.
Assuming the enforcement costs 8(δ0) equal
1/2ψ δ02 (where ψ is a strictly positive scalar that depends on things like the agrarian structure and the number of representative farmers), the first order condition for the problem specified in Eq. (5) is
∂ W
Eq. (6) indicates that the optimal audit probability is determined by equating the marginal resource costs of enforcement (MCe= (1 +d)ψ δ0), with the marginal
benefits from investigation(MBe=[(1+d)−θ]((v−
δ0(v+ρ)))/2δ1′). The marginal benefits from
enforce-ment include benefits from penalties on the current level of misrepresentation and the benefits from in-creased enforcement and reduced cheating.
The effect of policy enforcement on farmers’ well-being may or may not be taken into account by policy enforcers. For various reasons, the enforce-ment agency might place a relatively high weight (θ=θH, where θH≥1 +d), a low weight (θ=θL, where θL∈(0, 1 +d)), or no weight (θ=θ0= 0) on producer surplus. Substituting these values into Eq. (6) and solving for δ0 generates the best response function of the enforcement agency to the output sub-sidy chosen by the regulator and farmers’ optimizing behavior for the three values ofθ.
More specifically, when the enforcement agency does not consider the effect of its choices on produc-ers’ welfare (i.e.,θ=u0= 0), but its objective, instead, is to minimize taxpayer costs from cheating,8 the base audit probability will equal
where the superscript denotes the weight placed by policy enforcers on producer surplus. Similarly, when the enforcement agency places a positive but relatively low weight on producer surplus (i.e.,θ is lower than the marginal cost of public funds, 1 +d), the optimal
δ0,δθ L
0 , will equal
82 K. Giannakas, M. Fulton / Agricultural Economics 22 (2000) 75–90
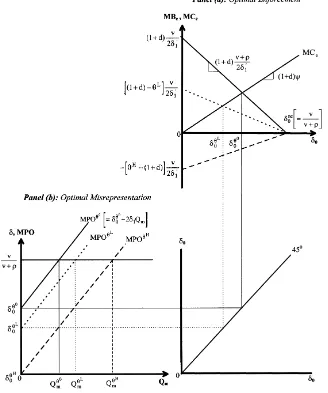
Fig. 4. Optimal enforcement and strategic interdependence between the enforcement agency and the farmers.
δ0θL= [(1+d)−θ][S(Q
t)−D(Qt)]
[(1+d)−θ][S(Qt)−D(Qt)+ρ]+(1+d)2δ1ψ = [(1+d)−θ]v
[(1+d)−θ](v+ρ)+(1+d)2δ1ψ
(8)
When the weight placed on producers exceeds the marginal cost of misrepresentation to taxpayers (i.e.,
θ≥1 +d), the best response of policy enforcers is complete allowance of cheating, i.e.,
δ0θH =0 (9)
positive resource costs of investigation (i.e., ψ> 0);
δ0will be smaller than the base audit probability that
completely deters cheating (i.e., δ0 < δ0nc =v/(v+
ρ)).
The optimalδ0under the alternative political
prefer-ences of the enforcement agency is determined graph-ically by the intersection of the MCe curve with the
relevant MBecurve in Fig. 4, Panel (a). Whenθequals
zero, the relevant marginal benefit function is shown as the downward sloping solid MBe curve. The MBe
curve is downward sloping due to the decrease in mis-representation caused by increases inδ0. The intersec-tion of the MBe curve with the horizontal axis
deter-mines the base audit probability that completely de-ters cheating,δnc0 . Obviously,δ0ncwould be the optimal choice of policy enforcers if enforcement was costless (i.e.,ψ= 0). In this case, the MCecurve would
coin-cide with the horizontal axis. However, investigating farmers and convicting the detected cheaters is costly. The greater are the enforcement costs (i.e., the larger isψ), the greater is the slope of the MCe curve, and
the lower is the base audit probability.9
An increase in the weight policy enforcers place on producer surplus reduces both the intercept and the absolute value of the slope of the marginal benefit function. More specifically, increases inθcause a left-ward rotation of the MBe curve throughδnc0 .Ceteris paribus, this results in a reduced base audit probabil-ity. UnderθL, the relevant MBecurve (shown as the
downward sloping dashed MBecurve in Fig. 4, Panel
(a)) will always fall between the MBecurve underθ0
and the horizontal axis;δ0θL is always positive. When θ= 1 +d, the weight placed by policy en-forcers on producers equals the marginal cost of public funds, i.e. the implicit weight placed by the en-forcement agency on taxpayer surplus. Since taxpayer gains from increased enforcement constitute producer losses (in a one-to-one correspondence) and since equal weight is attached to the welfare of producers and taxpayers, the marginal benefits from enforce-ment are zero. Hence, whenθ= 1 +d, the MBe curve 9Although Panel (a) of Fig. 4 illustrates the case of increasing marginal enforcement costs, the marginal costs from enforcement can in fact be constant, i.e. the case of constant returns to gov-ernment spending on program enforcement. In such a case, the relevant Mce curve would be a horizontal line that would meet the vertical axis in Panel (a) of Fig. 4 atψ′, the level of the constant
marginal costs.
coincides with the horizontal axis, and both the slope and the intercept equal zero. The only point where the MCe curve meets the horizontal axis is at the origin.
Thus, the optimalδ0equals zero.
Finally, values ofθgreater than 1 +dresult in a fur-ther leftward rotation of the MBecurve. The relevant
MBecurve is shown as the upward sloping dashed line
in Fig. 4, Panel (a). Since the weight placed on pro-ducers exceeds the marginal cost of public funds, the benefits from investigating farmers are never positive. Thus, when policy enforcement is costly (i.e., when-everψ> 0), the best response of policy enforcers that place relatively high weight on producers is to choose a zero base audit probability.
Fig. 4 also graphs the strategic interdependence be-tween the enforcement agency and farmers; it shows the effect enforcement decisions have on output mis-representation. Panel (b) of Fig. 4 depicts the cheating equilibrium for theNrepresentative farmers. Changes inδ0result in parallel shifts of the MPO curve faced
by the farmers. More specifically, reductions in δ0
caused by increases inθtranslate into downward par-allel shifts of the MPO curve and increased output mis-representation for a given subsidy and penalty. Mathe-matically,Qmunder the different political preferences
of policy enforcers is derived by substituting the ap-propriateδ0into the farmers’ reaction function in Eq. (4). Hence, whenθ=θ0output misrepresentation will equal
Qθm0 = ψv
(v+ρ)(v+ρ+2δ1ψ )
(10)
Similarly, the equilibriumQmunderθLandθH,QθmL
andQθmH, respectively, will equal
QθmL = (1+d)ψv
Fig. 4 is well suited for comparative static’s analy-ses. For instance, an increase in the penalty results in a parallel downward shift of thev/(v+ρ) line in Panel (b) and a reduction inQm(direct effect). An increased
84 K. Giannakas, M. Fulton / Agricultural Economics 22 (2000) 75–90
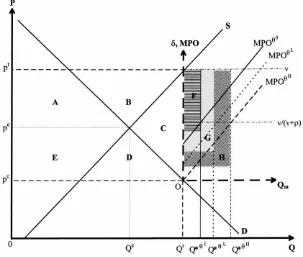
Fig. 5. The welfare effects of output subsidies under various levels of enforcement and cheating.
downward sloping MBecurve through the intercept in
Panel (a). The optimalδ0is reduced andQmincreases
(indirect effect). A change in the subsidy results in parallel shifts of thev/(v+ρ) line in Panel (b) (direct effect onQm), and also changes both the intercept and slope of the MBefunction in Panel (a) (indirect effect).
Overall, when program enforcement is costly, com-plete deterrence of cheating on output subsidies is never optimal from an economic perspective. The op-timal enforcement and, therefore, the opop-timal output misrepresentation depend on the weight placed by policy enforcers on producer surplus. Enforcement is maximized and cheating is minimized when the en-forcement agency minimizes total taxpayer costs from cheating. When farmer welfare is weighted highly, complete allowance of cheating is the optimal choice of the enforcement agency and maximum misrepre-sentation the best response of the farmers.
5. Regulator and optimal intervention
Consider next the case of a regulatory agency in a decentralized policy making environment that desires
to transfer a given surplus to producers of the regulated commodity. Implicit in this formulation is the assump-tion that the regulator is not concerned with the dis-tribution of resources within the farm sector; the pur-pose of government intervention is to transfer income to the farmers. This assumption is consistent with the assumption of homogeneity of producers adopted in this paper.
The regulator’s problem can be seen as the deter-mination of the subsidy level that achieves the desired income redistribution. Since the reaction functions of all parties involved in agricultural policy design and implementation are assumed to be common knowl-edge, the regulator knows exactly whether and how her decision will affect the level of enforcement and output misrepresentation.
Assume that the political preferences of the regu-lator result in a desire for an income transfer to pro-ducers given by the areasA+Bin Fig. 5. When pol-icy enforcement is perfect and costless, the quantity reported as eligible for government payments equals the actual production level. In such a case, the optimal choice of the regulator in terms ofvthat transfers areas
to producers will equal the difference betweenptand
pcshown in Fig. 5. The optimal subsidy under perfect and costless enforcement is denoted as vpce.
When, however, enforcement of output subsidies is costly, it will be incomplete and some output misrep-resentation will always occur. The extent of misrepre-sentation depends on the weight policy enforcers place on producer surplus. Because of this misrepresenta-tion, there is always more than the desired surplus transferred to producers under a subsidy payment set at vpce. The excess transfer increases with the increase in misrepresentation.
Fig. 5 shows output misrepresentation and the wel-fare effects of a given subsidy under the alternative political preferences of the enforcement agency. The greater isθ, the lower isδ0, and the greater isQm. The
lower is enforcement and the greater is misrepresenta-tion, the greater is thetotaltransfer to producers (i.e., payments for output produced plus benefits from mis-representation) for any given subsidy level. Thus, for the equivalent of areaA+Bto be transferred to pro-ducers, the regulator has to reduce the unit payment to the level at which the total transfer to producers will equalA+B. Therefore, the optimal subsidy that trans-fers agivensurplus to producers falls with the increase in misrepresentation, i.e., vθH <vθL <vθ0 <vpce.
A consequence of this is that consumer surplus falls with an increase in cheating when the objective of the regulatory agency is to transfer a given surplus to pro-ducers. The taxpayer costs associated with the specific income redistribution are reduced by the amount fore-gone by consumers plus the change in the deadweight welfare loss triangle, adjusted to account for the distor-tionary costs from taxation. Furthermore, the reduced enforcement associated with increased weight on pro-ducers (and increased cheating) results in reduced en-forcement costs incurred by taxpayers.10
10The effects of the reduction in the subsidy when cheating occurs in an open economy framework are quite straight forward. When farmer misrepresentation occurs in a small open economy, the welfare of consumers remains unaffected. The reason is that the domestic policy has no effect on the world price. However, the change in the subsidy will affect the terms of trade for the country. More specifically, the reduction in the quantity produced will reduce (increase) exports (imports) for the small open economy that exports (imports) the supported commodity. For the large country case, the reduction in domestic production (due to the fall in output subsidy) will increase the world price. Increased world
6. Transfer efficiency and optimal income redistribution
Assuming that the sole purpose of market inter-vention is income transfer, the trade off between pro-ducer surplus and consumer plus taxpayer surplus un-der an output subsidy scheme is reflected by the sur-plus transformation curve (STC) (Josling, 1974; Gard-ner, 1983; Bullock, 1992). The slope of the STC, de-noted ass = ∂PS/∂(CS+TS), is the marginal rate of surplus transformation. It reflects the efficiency of the policy mechanism in redistributing income to pro-ducers at the margin, or how much of an extra dollar raised by consumers and taxpayers is received by pro-ducers. One minus the absolute value ofsshows the deadweight loss per dollar transfer. The efficiency in redistribution links the resource costs of market inter-vention to the surplus transferred to producers. The closer issto−1, the smaller are the welfare losses, and the more efficient is the income redistributional mechanism.
The analysis in the previous sections shows that the levels of intervention and enforcement vary with the political preferences of the enforcement agency. The same is also true for the welfare loss associated with a given transfer to producers. Variation in the social cost of a transfer implies variation in the transfer ef-ficiency of output subsidies. In general, less auditing means lower resource costs of monitoring and enforce-ment associated with the specific transfer to produc-ers. At the same time, the lower is the subsidy level that achieves the desired transfer, the lower are the dis-tortionary costs of market intervention (i.e., the Har-berger triangle and the deadweight losses from tax-ation). And the lower are the welfare losses from a given transfer to producers, the greater is the transfer efficiency of output subsidies.
Recall that when policy enforcement is costly, both enforcement and the subsidy decrease with an increase in the weight placed by policy enforcers on producer
86 K. Giannakas, M. Fulton / Agricultural Economics 22 (2000) 75–90
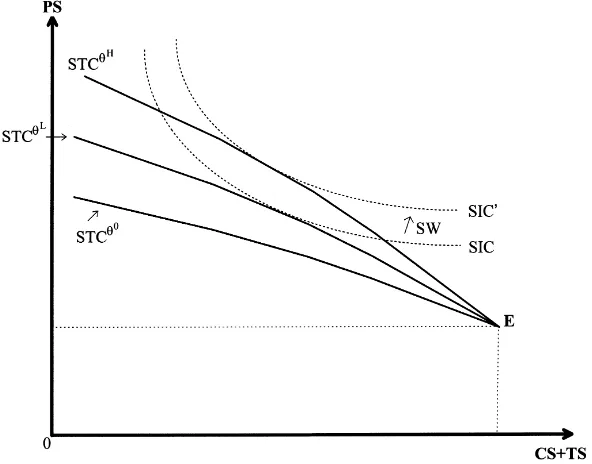
Fig. 6. Surplus transformation curves for output subsidies under costly enforcement.
surplus (i.e.,δθ00 > δ0θL > δ0θH and vθ0 >vθL >vθH).
Since both enforcement costs and distortionary costs of intervention decrease with an increase in θ, the greater isθ, the greater is the marginal efficiency of output subsidies in transferring income to producers, i.e.
s
θH >
s
θL >
s
θ0 .
Put in a different way, the efficiency of a transfer to producers increases with cheating since output mis-representation allows the regulator to substitute dis-tortionary transfers through the market with more effi-cient decoupled transfers through cheating. Since en-forcement falls as the weight placed by the enforce-ment agency on producer welfare increases, the greater is θ, the greater is the decoupled transfer through cheating, and the more closely output subsidies ap-proximate a lump-sum transfer program.The relevant STCs are depicted as the (concave) STCθH, STCθL
and STCθ0 in Fig. 6. The STCs originate from point
E which is the locus of the interest group surpluses at the competitive equilibrium.11 STCθ0 lies
under-11As long as there is government intervention in any other com-modity market, the taxpayer surplus corresponding to pointE in-corporates the costs associated with the operation of the
enforce-neath STCθL which, in turn, lies underneath STCθH
everywhere to the left ofE.12 The vertical distance between the STCs reflects the difference in the welfare losses associated with the specific transfer to produc-ers under the differentθs. Sinceδθ00, δ0θL and the dis-tortionary costs of market intervention increase with an increase in the level of intervention, the vertical distance between the STCs increases with a leftward move fromE.
It is worth noting that the efficiency of the pol-icy mechanism in transferring income to producers increases when the political preferences of the en-forcement agency and the regulator coincide (i.e., when both agents place a relatively high weight on producer welfare). Paradoxically, the transfer effi-ciency of output subsidies falls when the objective of the enforcement agency is to minimize total tax-payer costs from cheating. The reason is the
rela-ment agency. When non-intervention in the specific market also means non-intervention in the whole agricultural sector, taxpayer surplus at pointEwould shift to the right by an amount equal to the fixed costs associated with the existence of the enforcement agency.
tively high enforcement and intervention that occur when policy enforcers place zero weight on producer welfare.
The relative position of the STC for output subsi-dies in a world where program enforcement is perfect and costless (i.e., STCpce) is determined solely by the distortionary costs of market intervention (i.e., the relevant Harberger triangle and the deadweight losses from taxation to finance the transfer). The marginal efficiency of redistribution of output subsi-dies, |spce|, will always be less than
s
θH
, and STC
pce
will always lie underneath STCθH everywhere to the left of E. The reasoning goes as follows. Because of misrepresentation that occurs under θH, the subsidy that achieves the desired transfer to producers will be smaller than the subsidy under perfect and costless en-forcement, i.e. vpce >vθH. Reduced subsidy implies
reduced distortionary costs of intervention. Reduced welfare losses associated with a given transfer to pro-ducers mean increased transfer efficiency of output subsidies.
The position of STCpce relative to STCθL and STCθ0 is case specific and depends on market con-ditions and the resource costs of enforcement. Even though the distortionary costs of market intervention are lower under θL and θ0 (since vθL and vθ0 are
smaller than vpce), the enforcement costs are greater than those under perfect and costless enforcement of the program. The relative position of the STCs de-pends on the relative size of the total costs. For given market conditions, the greater is 8(δ0), the greater
is the likelihood that STCpce will lie above STCθL and STCθ0. Alternatively, for relatively low enforce-ment costs, STCpce will lie underneath STCθL and STCθ0.
The STC framework developed above can be used to determine the socially optimal total transfer to pro-ducers. Suppose the problem faced by the regulatory agency is the determination of income redistribution that maximizes some social welfare function (SWF) that weights producer, consumer, and taxpayer wel-fare, rather than the determination of the subsidy level that transfers a given surplus to producers. Assume that the political preferences of the regulator result in the social indifference curves (SIC) shown in Fig. 6, with the SWF value increasing with a northeast shift of the SIC.
The socially optimal total transfer to producers un-der the different scenarios consiun-dered in this study is determined by the tangency of the SIC to the relevant STC (Gardner, 1987). Fig. 6 shows that the level of total transfer to producers is directly related to the ef-ficiency of output subsidies in transferring income to producers. More specifically, the greater is the trans-fer efficiency of the policy instrument, the larger is the socially optimal total transfer. Furthermore, since the SWF value increases with movements to the northeast, increases in transfer efficiency also imply increases in social welfare. Both the socially optimal total transfer to producers and the social welfare from intervention are maximized when the political preferences of the enforcement agency and the regulator coincide.
7. Extension of the model – endogenous penalties
Crucial for the previous analysis and results is the assumption that penalties are exogenous to agricul-tural policy makers. Consider now the case of an en-forcement agency that controls both enen-forcement pa-rameters –δ0 andρ. Endogeneity of penalties calls
for an additional first order condition to the enforcing agency’s problem specified in Eq. (5), i.e.,
∂W
The optimalρin Eq. (13) is the penalty structure re-quired to completely deter farmer misrepresentation,
88 K. Giannakas, M. Fulton / Agricultural Economics 22 (2000) 75–90
misrepresentation.13 This is true no matter the weight
placed on producers, i.e.,
δ0θ (ρ)=0 and ρ= ∞ ∀θ (14)
whereδ0θ (ρ)denotes the optimalδ0under allθs when penalties are endogenous.
Graphically, the huge per unit penalty makes the slope of all MBe curves in Fig. 4, Panel (a) infinite.
The MBe curves coincide with the vertical axis and
meet the MCe curve at the origin. The resulting zero
δ0 means that the MPO curve comes out from the
origin, while the huge penalty shifts thev/(v+ρ) line downwards so that it coincides with the horizontal axis in Fig. 4, Panel (b). The optimal response of the farmer is then a zero level of misrepresentation.
Assuming there are no costs associated with the es-tablishment of huge penalties on detected output mis-representation, and since no (costly) auditing prevails at equilibrium, the perfect enforcement of the program (i.e., Eq. (13)) is also costless. Since output misrep-resentation is perfectly and costlessly deterred when penalties are endogenous to the enforcement agency, the output subsidy that transfers a given surplus to producers, the transfer efficiency of the policy instru-ment, and the socially optimal total transfer to produc-ers are those derived by the traditional analysis of out-put subsidies. Thus, one interpretation of ‘perfect and costless enforcement’ is the costless establishment of infinite per unit penalties for farmers who are detected misrepresenting the level of their production.
Infinite per unit penalties for farmers cheating on farm subsidies is not what is observed in most of to-day’s world however. In most countries legal penal-ties cannot be set far in excess of the material damage caused by the illegal activity; in lay terms, the punish-ment has to fit the crime. In the EU for instance, de-tected farmer misrepresentation on compensatory pay-ments results in a scaling-back of paypay-ments by the
13This result is altered when agricultural policy making is cen-tralized and penalties are endogenous to agricultural policy makers. Giannakas (1998); Giannakas and Fulton (1999) show that when a single agency determines both the level of intervention (i.e., the subsidy) and the level of enforcement, policy makers will find it economically optimal to completely allow cheating. The reason is that the increased producer benefits from misrepresentation enable the singe agency’s policy makers to reduce the subsidy that trans-fers a given surplus to producers, thereby increasing the transfer efficiency of the policy.
same percentage (i.e., the percentage of cheating) plus an additional uncompensated set-aside requirement for the following year (Swinbank and Tanner, 1996, pp. 97).14 Even in the US where detection of cheating on farm income transfer programs causes punitive fines and exclusion from future program benefits (usually for 3 years), the penalty is not of the magnitude that results in costless policy enforcement, i.e., the per unit penalty is not infinite.
One reason why the severe punishment of law vio-lators is not the norm is that institutionalized infinite per unit penalties are neither credible nor just. For instance, in his work on income tax evasion Cowell (1990, pp. 150) argues that enormous fines for small amounts of cheating would violate ‘the public’s sense of what is fair and reasonable.’ Similar views can be found in Becker (1968); Stigler (1970); Polinsky and Shavell (1979); Shavell (1987).
8. Summary and discussion
Agricultural policy analysis, in general and the anal-ysis of output subsidies in particular, traditionally take place under the assumption that: (i) either farmers do not cheat; or (ii) enforcement of agricultural poli-cies is perfect and costless. However, enforcement re-quires resources and is, therefore, costly. The resource costs of enforcing an output subsidy scheme result in policy enforcement that is incomplete. Imperfect en-forcement generates economic incentives for farmers to misrepresent their production and to collect subsi-dies on production that never took place. The lower is the level of enforcement, the higher is the equilibrium amount of farmer misrepresentation.
The analysis in this paper shows that the level of enforcement depends on the political preferences of policy enforcers. Since cheating on subsidies results in a direct income transfer from taxpayers to
ers, enforcement decreases as policy enforcers place increasing weight on producer welfare. The politi-cal preferences of policy enforcers are also crucial in determining the subsidy that transfers a given sur-plus to producers, the transfer efficiency of the pol-icy mechanism, and the socially optimal total trans-fer to producers. The causation goes as follows. The greater is the weight placed by policy enforcers on producer surplus, the lower is the program enforce-ment, and the lower is the subsidy level that achieves a desired transfer to producers. Lower enforcement and intervention means lower welfare losses associated with a given transfer to producers, and greater trans-fer efficiency of output subsidies. The greater is the marginal efficiency of output subsidies in redistribut-ing income to producers, the greater is the socially optimal income redistribution. Overall, the transfer ef-ficiency of output subsidies, the socially optimal to-tal transfer to producers and the social welfare from intervention are maximized when the political pref-erences of the enforcement agency and the regulator coincide.
When both the enforcement agency and the reg-ulator attach a relatively high weight to the welfare of producers, the economically efficient outcome in-cludes a reduced subsidy and a minimum amount of monitoring and enforcement. The conclusion that a limiting case of the analysis approximates a lump-sum transfer highlights at least two issues in the literature on lump-sum payments. First, even though lump-sum transfers are more efficient means of income redistri-bution than coupled farm subsidies, they are viewed as ‘hypothetical ideals’ that ‘are operationally irrele-vant’ (Williamson, 1996, pp. 210). Second, lump-sum transfers are not only impossible, but they are per-ceived to be unfair to the extent that they involve ar-bitrary exclusions from the program (Gardner, 1987, pp. 190).
Lump-sum transfers that are linked to cheating ob-viously involve highly arbitrary exclusions. Farmers that comply with program provisions and truthfully re-port their production receive less benefits than do the farmers that cheat. While the focus on the representa-tive farmer in this paper precludes the formal consid-eration of this outcome, the principle is nevertheless clearly illustrated.
The impossibility of lump-sum transfers is also highlighted by the analysis in this paper. While
con-ceptually interesting, the idea that cheating would be made the basis of policy seems far-fetched. One rea-son is that morality and culture, although significant determinants of an individual’s propensity to cheat (Grasmick and Green, 1980), have not been incorpo-rated into the analysis. Not only are some farmers ex-pected not to cheat, but wide spread cheating is likely to create a culture of dishonesty in the society and a public disrespect for both the government and com-munity rules (Lea et al., 1987; Cowell, 1990). As a consequence, governments would be unlikely to base policy on something that would ultimately undermine policy. The key point here is that any lump-sum trans-fer program that could be devised is predicated on a set of behavioral assumptions that make it operationally impractical.
The above discussion sheds light on the gov-ernment’s use of mixed policy instruments such as subsidies and supply restrictions (i.e., the so-called stop-and-go policies). Linking subsidy payments to an arbitrary chosen level of output (or input) does two things. First, it provides a way of making operational a program that now has many of the characteristics of a lump-sum transfer. Second, it may reduce the possibility of cheating, thus limiting the exclusion of honest farmers and lessening the general propen-sity for cheating. The possibility of cheating may be reduced because the enforcement issues in this case are confined to compliance with supply restric-tions which may be easier to monitor than output (on the economics of a stop-and-go policy mix un-der costly enforcement see Giannakas and Fulton (1999)).
90 K. Giannakas, M. Fulton / Agricultural Economics 22 (2000) 75–90
References
Alston, J.M., Hurd, B.H., 1990. Some neglected social costs of government spending in farm programs. Am. J. Agric. Econ. 72, 149–156.
Alston, J.M., Smith, V.H., 1983. Some economic implications of minimum pricing: the case of wine grapes in Australia: comment. Rev. Marketing Agric. Econ. 51, 179–185. Ballard, C.L., Fullerton, D., 1992. Distortionary taxes and the
provision of public goods. J. Econ. Persp. 6, 117–131. Becker, G.S., 1968. Crime and punishment: an economic approach.
J. Polit. Econ. 76, 169–217.
Bullock, D.S., 1992. Redistributing income to European consumers and taxpayers through the common agricultural policy. Am. J. Agric. Econ. 74, 59–67.
Cowell, F.A., 1990. Cheating the Government: The Economics of Evasion. The MIT Press, Cambridge, MA, 267 pp.
From, J., Stava, P., 1993. Implementation of community law: the last stronghold of national control? In: Andersen, S.S., Eliassen, K.A., (Eds.), Making Policy in Europe: The Europification of National Policy-making. SAGE Publications, London, pp. 55–67.
Gardner, B.L., 1983. Efficient redistribution through commodity markets. Am. J. Agric. Econ. 65, 225–234.
Gardner, B.L., 1987. The Economics of Agricultural Policies. Macmillan, New York, 387 pp.
Gardner, B., 1996. European Agriculture: Policies, Production and Trade. Routledge, New York, 233 pp.
Giannakas, K., 1998. Agricultural policy analysis under costly enforcement: an economic analysis of cheating, Ph.D. Dissertation. University of Saskatchewan.
Giannakas, K., Fulton, M.E., 1999. Efficient redistribution using quotas and subsidies in the presence of misrepresentation and cheating, Am. J. Agric. Econ. (forthcoming).
Gibbons, R., 1992. Game Theory for Applied Economists. Princeton University Press, Princeton, NJ, 267 pp.
Grasmick, H.G., Green, D., 1980. Legal punishment, social disapproval and internalization as inhibitions of illegal behavior. J. Crim. Law Criminol. 71, 325–335.
Harvey, D.R., 1997. Extensions and political analysis of the CAP. In: Ritson, C., Harvey, D.R., (Eds.), The Common Agricultural Policy. CAB International, New York, pp. 163–190.
Josling, T.E., 1974. Agricultural policies in developed countries: a review. J. Agric. Econ. 25, 229–264.
Kreps, D.M., 1990. A Course in Microeconomic Theory. Princeton University Press, Princeton, NJ, 839 pp.
Lea, S.E.G., Tarpy, R.M., Webley, P., 1987. The Individual In The Economy. Cambridge University Press, Cambridge, 627 pp. Moyer, H.W., Josling, T.E., 1990. Agricultural Policy Reform:
Politics and Process in the EC and the USA. Iowa State University Press, Ames, IA, 235 pp.
Nerlove, M., 1958. The Dynamics of Supply: Estimation of Farmers’ Response to Price. Johns Hopkins Press, Baltimore, 268 pp.
Ockenden, J., Franklin, M., 1995. European agriculture: making the CAP fit the future. Royal Institute of International Affairs, London, UK, 103 pp.
Polinsky, M., Shavell, S., 1979. The optimal trade-off between the probability and magnitude of fines. Am. Econ. Rev. 69, 880–891.
Runge, C.F., von Witzke, H., 1987. Institutional change in the common agricultural policy of the European Community. Am. J. Agric. Econ. 69, 213–222.
Shavell, S., 1987. The optimal use of nonmonetary sanctions as a deterrent. Am. Econ. Rev. 77, 584–592.
Stigler, G.J., 1970. The optimum enforcement of laws. J. Polit. Econ. 78, 526–536.
Swinbank, A., 1997. The CAP Decision-making Process. In: Ritson, C., Harvey, D.R., (Eds.), The Common Agricultural Policy. CAB International, New York, pp. 57–80.
Swinbank, A., Tanner, C., 1996. Farm Policy and Trade Conflict: The Uruguay Round and CAP Reform. The University of Michigan Press, 178 pp.
United States Department of Agriculture Office of Inspector General, July 1999. USDA Fraud Hotlinewww.usda.gov/oig/ hotline.htm.
Wallace, T.D., 1962. Measures of social costs of agricultural programs. J. Farm Econ. 44, 580–594.