Diurnal variation of methane emission from paddy fields at different
growth stages of rice cultivation in Taiwan
Shang-Shyng Yang
∗, Hsiu-Lan Chang
Department of Agricultural Chemistry, National Taiwan University, Taipei, Taiwan 10617 Received 29 June 1998; received in revised form 26 February 1999; accepted 5 May 1999
Abstract
Paddy fields are one of the major anthropogenic sources of methane emission. Methane emission from paddy fields can vary with the growth stages of the rice (Oryza sativaL.) plant and daily environmental conditions. There are two crop seasons in Taiwan, the first crop season is from low to high temperature (February–June), and the second crop season is reversed (August–December). The objective of this study was to investigate the effect of growth stages and daily environmental conditions on methane emission from a paddy field at the Agricultural Experimental Station of National Taiwan University in Taipei (25◦1′30′′N, 121◦31′30′′E). Methane emission rate was high at the rice booting and the flowering stages and low at
the transplanting and the ripening stages in the first crop season; while it was high at the transplanting and the active tillering stages and low from the booting to the ripening stages with intermittent irrigation system. Continuous flooding treatment significantly enhanced methane emission at the flowering and the ripening stages in the first crop season. Methane emission rate was high from 12 a.m. to 3 p.m., and low from 2 to 5 a.m. Methane emission showed high correlation coefficient with air temperature, and low correlation with light intensity. Methane emission in the second crop season (13.7–28.9 g m−2) was about
2–5-fold higher than that in the first crop season (2.6–11.7 g m−2). This phenomenon was reversed in continuous flooding
treatment. Estimated total methane emission from Taiwan paddy fields in 1996 was between 27,352 and 69,060 Mg with intermittent irrigation system, which was lower than 231,147 Mg calculated by the IPCC method with continuous flooding treatment. Intermittent irrigation is a useful approach to reduce emissions in paddy fields. ©1999 Elsevier Science B.V. All rights reserved.
Keywords:Diurnal variation; Methane emission; Paddy field; Temperature; Redox potential
1. Introduction
Methane currently has a globally averaged mixing ratio of about 1.72 mg kg−1(vol.) in the troposphere. Methane is produced by a group of strictly anaerobic bacteria in highly chemically reduced habitats such
∗Corresponding author. Tel.: 23621519; fax: +886-2-23679827
E-mail address:[email protected] (S.-S. Yang)
as rice paddies, swamps, sludge digesters, rumens, and sediments (Banker et al., 1995; Yang and Chang, 1997; Yang et al., 1998). Global annual methane emis-sion from rice fields were estimated to range from 25 to 100 Tg which contributed 10–30% of global methane emission (Crutzen, 1991; IPCC, 1995). Tem-perature, organic matter content, fertilizer application, rice plant, pH, redox potential, soil type and water management are the major factors affecting methane emission (Sass et al., 1991; Adhya et al., 1994; Banker
et al., 1995; Buendia et al., 1998; Yang and Chang, 1998). There is a positive linear correlation between methane production and incubation temperature from 15 to 37◦C, and a negative linear correlation between
37 and 50◦C (Yang and Chang, 1998).
Supplementa-tion of rice straw, green manure and compost has a stimulating effect on methane production (Buendia et al., 1998; Yang and Chang, 1998).
In Taiwan, Yang et al. (1994) and Yang and Chang (1997) showed that methane emission from paddy rice, in pot experiments, with continuous flooding was high at the active tillering, flowering and ripening stages in the first crop season. It was also high at the transplant-ing, active tillering and booting stages in the second crop season due to the high temperature and active growth of the rice plant.
Rice is the major crop in Taiwan and there are two crop seasons. The cultivated areas were 182,807 ha and 164,955 ha for the first and second crop seasons in 1996, respectively. This cropping system is different from the single crop season in Japan, Korea, Texas and Beijing. In addition, intermittent irrigation is used in Taiwan for saving the water resource, while a continu-ous flooding system is the practice in other countries. Diurnal variation of methane emission from rice paddy with continuous flooding treatment had been studied in several locations (Buendia et al., 1998). Methane emission pattern in Taiwan was different from the other areas because of the rice cropping system and irrigation management. This work reports the diurnal variation of methane emission from a paddy field with two crop seasons and two irrigation systems at differ-ent growth stages from the second crop season 1994 to the first crop season 1996 in Taiwan.
2. Materials and methods
2.1. Experimental site
A paddy field (about 1.0 ha) at the Agricultural Experimental Station of National Taiwan University located in Taipei (25◦1′30′′N, 120◦31′30′′E), Taiwan was selected. The soil is a fine-loamy mixed, Hyper-thermic, Typic Haplanthrept (TARI, 1978; Soil Sur-vey Staff, 1998). Some soil properties are as follows: pH 5.6±0.1, organic matter 28.4±0.4 g kg−1(dry
weight), total nitrogen 1.73±0.2 g kg−1(dry weight),
and sand : clay : silt = 453 : 201 : 346 g kg−1. All the
experiments were performed in tetraplicates.
2.2. Rice and fertilizer
Tainung No. 67 a Japonica rice (Oryza sativa L.) was used in the study. Taifei No. 1 (N : P : K = 20 : 2.2 : 8.3, wt.%) (Taiwan Fertilizer Corporation, Taiwan) was applied as basal fertilizer (400 kg ha−1) before
rice transplanting. Urea (100 kg ha−1) and ammonium
sulfate (100–500 kg ha−1) were used as the first and the second topdressing fertilizers at the active tillering and the booting stages, respectively.
Rice field operations in the second crop season (1994) were as follows: plowing on 25 July, flooding on 1 August, transplanting on 11 August, intermittent irrigation from 14 October to 29 November 1994, and rice plant harvesting on 5 January 1995 (total culti-vation period was 147 days). In the first crop season (1995), rice field operations were as follows: plowing on 20 February, flooding on 2 March, transplanting on 14 March, intermittent irrigation from 15 April to 2 July, and rice plant harvesting on 21 July 1995 (total cultivation period was 129 days). In the second crop season (1995), rice field operations were as follows: plowing on 15 July flooding on 21 July, transplanting on 31 July, intermittent irrigation from 5 October to 23 November, and rice plant harvesting on 13 De-cember, 1995 (total cultivation period was 136 days). For the first crop season (1996) the field operations were as follows: plowing on 19 February, flooding on 4 March, transplanting on 15 March, continuous flooding until 20 July (intermittent irrigation from 20 April to 20 July), and rice plant harvesting on 5 August 1996 (total cultivation period was 152 days). Rice straw was removed from the field after each harvest.
2.3. Diurnal variation of methane emission and environmental conditions
2.4. Gas sampling chamber
Gas samples were collected using a home-made acrylic chamber (length, 40 cm; width, 40 cm; and height, 65 cm; about 96 l of volume) that was equipped with an electronic fan, a thermometer and a sampling hole. In the later growth stage of the paddy rice, a two-layer acrylic chamber was used (height, 130 cm; volume about 192 l). Four hills (spacing of hill was
24 cm×27 cm) were measured, and four chambers
were used in each measurement (Chang and Yang, 1997).
2.5. Gas sampling period and method
Methane flux methodology followed the recommen-dation of previous studies (Yang et al., 1994; Buendia et al., 1998; Yang and Chang, 1998). Gas was sam-pled every 3 h on the first day and twice a day, at 5 a.m. and 2 p.m., on the second and the third day in each growth stage. Gas sample was collected at 0, 30 and 60 min accumulative time using the gas dilu-tion method. Air temperature increased 2–3◦C during
1 h closure in the day time, and it increased 0–0.5◦C
at night. Five ml of gas was withdrawn by a 10 ml disposable plastic syringe from a 12 ml serum bottle, that had been sealed with a butyl rubber stopper and flushed with oxygen-free nitrogen. Then, 5 ml of the gas sample was injected into a serum bottle (Chang and Yang, 1997).
2.6. Methane emission
Methane emission was determined at a 0.5 h inter-vals for 1.0 h by examining the changes of methane concentration in the acrylic chamber. The gas sam-ple was injected into a Shimadzu 14A gas chromato-graph with a glass column (0.26 mm×2 m) which was packed with Porapak Q (80/100 mesh). The column temperature was set at 100◦C, and the injection and the
detector temperatures were set at 130◦C. Methane
con-centration was calculated with a standard curve from 0.1 to 1000 mg kg−1(vol.) (Chang and Yang, 1997).
2.7. Estimation of methane emission
Methane emission from paddy field was calculated by the experimental data and estimated by the
follow-ing equation (Rolston, 1986):
equal to cross-section of chamber (m2), 1C equal to concentration difference between zero andttimes (mg cm−3), and 1t equal to time duration between two sampling periods (h). Methane emission from paddy soil was calculated from the summation of methane emission in five growth stages of rice plants.
2.8. Analytical methods
Light intensity was measured with Toshiba SPI-5 photometer. Soil pH (10 cm depth) or water pH was determined directly in the field, or on 1 : 1 (w/w) soil to water suspension with pH meter (Mode Sentron 2001) (Nelson and Sommers, 1982). Redox potential was measured with a Hanna No. 081–854 potential meter (Code HI 8424) under 5–20 cm depth of topsoil using the Pt electrode after a 20–25 min equilibrium with the soil (Yang and Chang, 1997). Air, water and soil temperatures were determined with a thermome-ter. Experiments were carried out to obtain four mea-surements, and flux data subjected to analysis of vari-ance and Duncan’s multiple range test (p= 0.05) using the Statistical Analysis System (SAS Institute, 1988).
3. Results
3.1. Diurnal variation of environmental conditions during rice cultivation
Table 1
Methane emission from paddy soil at different growth stages of rice plants over several crop seasonsa
Stage Firstcrop season Second crop season
1995 1996 cont.b 1996 inter.b 1994 1995
Emission rate (mg m−2h−1)
Transplanting 0.21±0.05 0.21±0.07 0.21±0.10 11.80±3.50 9.52±2.22 0.83±0.20c 1.15±0.23c 1.13±0.13c 30.50±8.15a 24.45±5.67a Active tillering 0.31±0.06 2.01±0.89 1.97±0.73 0.93±0.35 10.01±2.29
0.88±0.08c 5.94±1.62bc 5.97±1.41bc 3.13±1.52c 27.08±6.06a
Booting 0.85±0.13 13.33±3.39 3.09±1.23 0.36±0.12 5.41±1.18
1.49±0.20c 29.53±6.74a 7.34±1.69b 0.92±0.26c 6.87±1.35b
Flowering 1.02±0.19 10.13±1.90 1.52±0.32 0.06±0.02 3.77±1.05
2.83±0.77c 20.92±6.28a 2.61±0.40c 0.13±0.04c 5.92±3.04bc
Ripening 0.21±0.05 4.96±2.12 0.20±0.12 0.01±0.01 0.01±0.00
0.54±0.19c 10.89±2.84b 0.56±0.15c 0.08±0.02c 0.03±0.01c Seasonal total emission (g m-2) 2.55±0.16c 32.65±10.17a 11.70±1.88b 13.73±1.70b 28.85±3.25a Average emission rate (mg m-2 h-1) 0.76±0.05c 9.72±3.03a 2.74±0.54bc 4.85±0.59b 9.54±1.07a
aRice cultivation was described in the text. Mean±SD (n= 4), in the same row that do not share the same alphabetic superscript are significantly different 5% level according to Duncan’s multiple range test. The data showed range of methane emission in the early morning (6 a.m., low value) and at the noon (2 a.mp.m., high value) in each measurement.
bBoth continuous flooding treatment and intermittent irrigation system were used in the first crop season 1996.
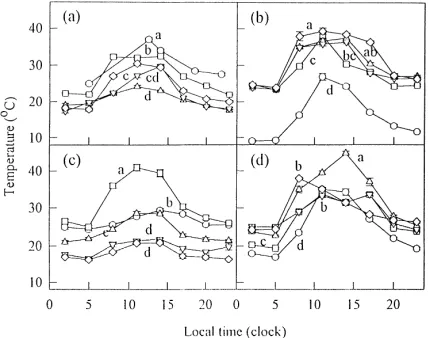
Daily air temperature was high from 11 a.m. to 2 p.m., and low from 2 to 5 a.m. Air temperature was 10–25◦C, 20–31◦C, 21–32◦C, 21–33◦C, and 26–37◦C
at the transplanting, active tillering, booting, flowering and ripening stages, respectively in the first crop sea-son. In the second crop season, it was 26–38◦C, 23– 36◦C, 21–30◦C, 18–25◦C, and 13–21◦C, respectively. The fluctuation of water and soil temperatures was narrower than air temperature. Water and soil have high heat capacity that adjusted the temperature change. Soil temperature was the highest at the early morning in the winter season (December–February), while air temperature was the highest at the mid-day in the summer season (July–September). Tempera-tures had also significant differences among these five rice growth stages in both crop seasons (Fig. 1).
Soil pH fluctuation was not significant during the day time, except at the transplanting stage. Due to the high temperature, the application of organic matter and the active microbial metabolites at the transplanting stage in the second crop season, soil and water pHs were low at this stage for the accumulation of organic acids (data not shown).
Redox potential was low at the flooding and the transplanting stages (early growth period),
−100–250 mV, whereas the value increased gradually at the flowering and the ripening stages with the in-termittent irrigation,−50–100 mV (data not shown).
Fig. 1. Diurnal variation of air temperature of paddy field during during the rice growing season. (a) The second crop season 1994, (b) the first crop season 1995, (c) the second crop season 1995, (d) the first crop season 1996. Curves in the figure that do not share the same alphabetic mark are significantly different at 5% level according to Duncan’s multiple range test.s—s, transplanting stage;h—h, active tillering stage;△—△, booting stage;▽—▽, flowering stage;⋄—⋄, ripening stage.
3.2. Methane emission at different growth stages
Table 2
The correlation coefficient between methane emission rate at different ricea growth stages and temperature of air, water, and soil
Crop season growth Second crop 1994 First crop 1995 Second crop 1995 First crop 1996b stage temperature
Air Water Soil Air Water Soil Air Water Soil Air Water Soil
Transplanting 0.92a 0.89a 0.67a 0.83a 0.79a 0.48a 0.85a 0.82a 0.69a 0.72ab 0.71a 0.55c Active tillering 0.52b 0.52b 0.41b 0.58b 0.59b 0.47a 0.69b 0.80a 0.49c 0.69b 0.60b 0.62b Booting 0.44c 0.47c 0.35c 0.44c 0.43c 0.37c 0.46c 0.66c 0.61ab 0.78a 0.76a 0.73a Flowering 0.41c 0.40d 0.27d 0.24d 0.17d 0.19d 0.23d 0.43d 0.42d 0.65c 0.56bc 0.47d Ripening 0.20e 0.30e 0.25e 0.22d 0.16d 0.15de 0.25d 0.20e 0.15e 0.43d 0.40d 0.35d Off-crop 0.10f 0.11f 0.12f 0.15f 0.15d 0.11de 0.10e 0.12f 0.20ef 0.18e 0.17e 0.17e
aRice cultivation was described in the text. Mean (n= 4), in the same row that do not share the same alphabetic superscript are significant different 5% level according to Duncan’s multiole range test.
bThe data were calculated with continuous flooding treatment.
stages while it was low at the transplanting and the ripening stages for low temperature and high redox potential, respectively, in the first crop season with in-termittent irrigation. Methane emission rate was high at the transplanting and the active tillering stages for high temperature and low redox potential, and low at the flowering and the ripening stages for low temper-ature and high redox potential in the second crop sea-son. However, methane emission was also very sig-nificant during the booting to the ripening stages in the first crop season 1996 with continuous flooding. Methane emission from soil with continuous flooding was 2.8 times higher than that with intermittent irriga-tion in the first crop season. Total methane emission in the second crop season was 2–5-fold higher than that in the first crop season with the practice of inter-mittent irrigation.
3.3. Diurnal variation of methane emission rate during rice cultivation
3.3.1. First crop season
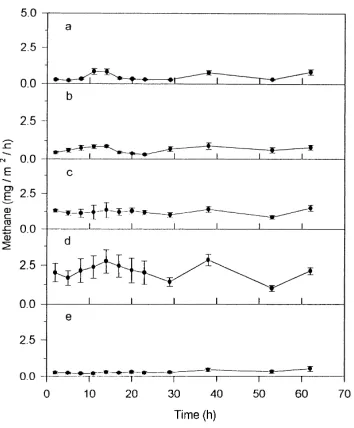
Methane emission rate was high between 12 a.m. and 3 p.m. and low at early morning. Methane emis-sion rate increased from the transplanting stage to the flowering stage, and then decreased at the ripening stage in 1995 with intermittent irrigation (Fig. 2). The correlation coefficient between methane emission rate and temperature was high at the transplanting and the active tillering stages, and low at the flowering and the ripening stages due to the drainage management (Table 2). While in 1996 with continuous flooding, methane emission rate increased from the transplanting stage to
Fig. 2. Diurnal variation of methane emission rate from paddy field in the first crop season 1995 with intermittent irrigation (mean and standard deviation). The first measurement was at 2 a.m. and the last measurement was at 2 p.m. (a) Transplanting stage (6–8 March), (b) active tillering stage (1–3 May), (c) booting stage (30 May to 1 June), (d) flowering stage (1–3 July), (e) Ripening stage (17–19 July).
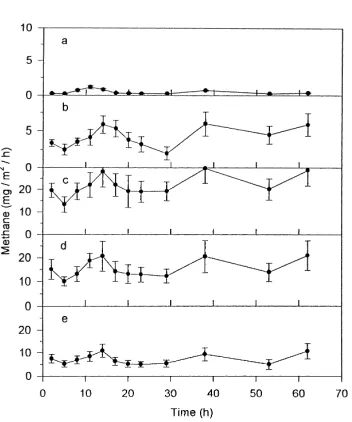
Fig. 3. Diurnal variation of methane emission rate from paddy field in the first crop season 1996 with continuous flooding (mean and atandard deviation). The first measurement was at 2 a.m. and the last measurement was at 2 p.m. (a) Transplanting stage (7–9 March), (b) active tillering stage (29 April to 1 May), (c) booting stage (4–6 June), (d) flowering stage (28–30 June), (e) ripening stage (17–19 July).
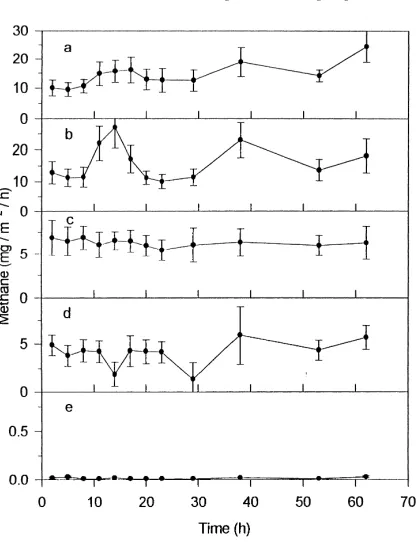
3.3.2. Second crop season
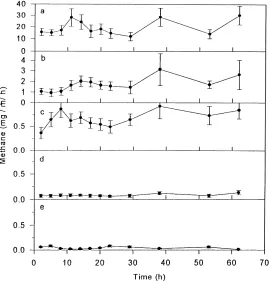
In 1994 with intermittent irrigation, methane emis-sion rate was high at the transplanting and the active tillering stages for high temperature and continuous flooding, and was low at the flowering and the ripen-ing stages for low temperature and drainage treatment (Fig. 4). The correlation coefficient between methane emission rate and temperature was high at the trans-planting and the active tillering stages, and was low at the ripening stage (Table 2). In 1995, methane emis-sion rate at different growth stages was similar to that in 1994 (Fig. 5). The correlation coefficient between methane emission rate and temperature was high at the transplanting and the active tillering stages, and was low at the flowering and the ripening stages (Table 2). From the statistical analysis, air temperature had the highest correlation coefficient with methane emission among the test temperatures.
Although soil redox potential and pH were very im-portant for methane production by microbes, the corre-lation coefficient between methane emission rate and soil redox potential was less than 0.35. In addition, the correlation coefficient between methane emission
rate and water pH was less than 0.25, and between methane emission rate and soil pH it was less than 0.30. Temperature and water management were prob-ably the major factors in methane emission from the paddy field.
4. Discussion
The seasonal variation of environmental conditions was very consistent from July 1994 to July 1996. Oc-casional rain in the summer season reduced the tem-perature, light intensity, and the soil redox potential. The methane emission rate, the light intensity, and the temperature were high around the mid-day, while the values were low at the early morning. Methane emission rate was also high during the mid-day in the paddy soils of Italy, India, Indonesia, Philippines, Korea and China (Schutz et al., 1989; Adhya et al., 1994; Shin et al., 1995; Buendia et al., 1998). Sass et al. (1991) indicated that methane emission from a paddy soil in Texas was strongly correlated with tem-perature. Yang and Chang (1998) found that methane production rate increased with temperature and had a linear relationship between 15 and 37◦C in laboratory
studies. High temperature increase the degradation of organic matter, and enhanced the production and emis-sion of methane.
Fig. 4. Diurnal variation of methane emission rate from paddy field in the second crop season 1994 with intermittent irrigation (mean and standard deviation). The first measurement was at 2 a.m. and the last measurement was at 2 p.m. (a) Transplanting stage (11–13 August), (b) active tillering stage (15–17 September), (c) booting stage (25–27 October), (d) flowering stage (3–5 November), (e) ripening stage (6–8 December).
initiation to the flowering stage (Buendia et al., 1998). In a Beijing paddy field, methane emission exhibited two peaks, the first peak between noon to 2 p.m. and the second peak between midnight to 1 a.m.; while methane emission had three peaks from the flowering to the harvest, 2 a.m., 8–10 a.m. and 8 p.m. (Wang and Shangguan, 1995). However, methane emission had a single peak between 2 and 4 p.m. in a Hangzhou paddy field (Buendia et al., 1998). Therefore, methane emis-sion patterns in the present studies at different growth stages with two cropping seasons and two irrigation systems were different from those found in Taxes, Los Banos, Beijing and Hangzhou with a single cropping system and/or continuous flooding. These differences may be due to the intermittent irrigation system and the temperature change pattern.
The correlation coefficient between methane emis-sion and light intensity was less than 0.10 in this study. A similar result was also found in a Langyang paddy
soil (Yang and Chang, 1998), while it was somewhat different from that observed in Texas paddy fields (Sass et al., 1991). The annual methane emission in Texas increased with cumulative sunshine period in the paddy fields. Both the rice physiology and the soil redox potential were different between the two cultiva-tion sites, and the effect of light intensity on methane emission was also somewhat different.
Fig. 5. Diurnal variation of methane emission rate from paddy field in the second crop season 1995 with intermittent irrigation (mean and standard deviation). The first measurement was at 2 a.m. and the last measurement was at 2 p.m. (a) Transplanting stage (24–26 August), (b) active tillering stage (3–5 October), (c) booting stage (19–21 October), (d) flowering stage (3–5 November), (e) ripening stage (29 November to 1 December).
high during the flooding to the transplanting stages at low Eh, while methane emission was low at the
flowering and the ripening stages at high Eh in the
paddy field with intermittent irrigation. Although the latter rice growth stage had high root secretion and high metabolic activity, highEhdid not favor methane
emission and reduced methane emission at the flow-ering and the ripening stages.
Cicerone et al. (1983) indicated that methane pro-duction at the flowering stage ranged from 76 to 92% of the total amount of methane production in Califor-nia rice paddies. This percentage was higher than that found for the present study with intermittent irrigation. In the first crop season, methane emission at the flow-ering stage ranged from 30 to 43% of the total amount of methane production, while it was only between 1 and 13% in the second crop season. Buendia et al. (1998) found about 86% of methane was released to
atmosphere from the transplanting to the panicle ini-tiation stages in Beijing. The differences among these results are probably due to the water flooding during the cultivation period in California, as against water flooding only during the transplanting and the active tillering stages, and intermittent irrigation from the booting to the ripening stages in Taiwan. In addition, the flowering stage in the second crop season was in November with low temperature period. Therefore, the percentage of methane emission at the flowering stage was lower in the second crop season than that in the first crop season.
Methane emission in the first crop season was only 19–41% of that in the second crop season. This result was different from the previous studies in the pot cul-tivation (Yang et al., 1994; Yang and Chang, 1997), and IPCC method (1995). The rice paddy was culti-vated with continuously flooded in the pot cultivation and IPCC method, while the rice field was practice with intermittent irrigation from the late booting to the ripening stages.
Methane emission was between 2.6 and 11.7 g m−2 in the first crop season, and it was between 13.7 and 28.9 g m−2 in the second crop season (Table 1). Us-ing these estimates, total methane emission for the 1996 Taiwan rice crop would range between 4753 and 21,388 Mg for 182,807 ha of paddy rice in the first crop season, and between 22,599 and 47,672 Mg for 164,955 ha of paddy rice in the second crop sea-son. Annual methane emission from Taiwan paddy fields would be between 27,352 and 69,060 Mg. The values were less than that estimated with the IPCC method (total methane emission estimated at 114,167 and 116,980 Mg in the first and the second crop sea-sons, respectively; annual methane emission estimated at 231,147 Mg).
5. Conclusions
intermittent irrigation and this phenomenon was dif-ferent from that in pot cultivation and IPCC method with continuous flooding system. The correlation co-efficient between methane emission rate and tempera-ture was high at the transplanting and the active tiller-ing stages due to the floodtiller-ing treatment, while the value was low at the flowering and the ripening stages with intermittent irrigation. The percentage of methane emission at the flowering stage ranged from 30 to 43% of the total amount of methane production in the first crop season and it was only between 1 and 13% in the second crop season. These phenomena were dif-ferent from pot cultivation and paddy fields at differ-ent areas around the world due to the differdiffer-ent irriga-tion treatments, cropping systems and fertilizer appli-cations. Annual methane emission from Taiwan paddy fields with intermittent irrigation was between 27,352 and 69,060 Mg which was less than 231,147 Mg with IPCC method. Therefore, intermittent irrigation is a very useful strategy for methane mitigation in paddy field.
Acknowledgements
The authors thank Professors H.C. Lin, Y.S. Wang, R.S. Chung, Ming K. Wang and C.M. Lai for their technical assistance in sampling and help-ful comments in preparing this manuscript, the Na-tional Science Council of the Republic of China for financial support (NSC 85-2621-P002-016 and NSC 86-2621-P002-004), and the Editor-in-Chief for improvements to the original draft of the paper.
References
Adhya, T.K., Rath, A.K., Gupta, P.K., Rao, V.R., Das, S.N., Parida, K.M., Parashar, D.C., Sethunathan, N., 1994. Methane emission from flooded rice fields under irrigated conditions. Biol. Fertil. Soils 18, 245–248.
Banker, B.C., Kludze, H.K., Alford, D.P., DeLaune, R.D., Lindau, C.W., 1995. Methane sources and sinks in paddy rice soils: relationship to emissions. Agric. Ecosyst. Environ. 53, 243–251. Buendia, L.V., Neue, H.U., Wassmann, R., Lantin, R.S., Javellana, A.M., Arah, J., Wang, Z., Wanfang, L., Makarim, A.K., Corton, T.M., Charoensilp, N., 1998. An efficient sampling strategy for estimating methane emission from rice field. Chemosphere 36, 395–407.
Chang, H.L., Yang, S.S., 1997. Measurement of methane emission from soil. Chin. J. Agric. Chem. Soc. 35, 475–484.
Cicerone, R.J., Setter, J.D., Delwiche, C.C., 1983. Seasonal variation of methane flux from a California rice paddy. J. Geophys. Res. 88, 11022–11024.
Crutzen, P.J., 1991. Methane’s sinks and sources. Nature 350, 380–381.
Intergovernmental Pannel of Climate Change (IPCC), 1995. Greenhouse gas inventory workbook. In: IPCC Guidelines for National Greenhouse Gas Inventories, vol. 2, 4. 9–4. 21. OECD/IEA, IPCC, UK.
Mah, R.A., Smith, M.R., 1981. The methanogenic bacteria. In: Starr, M.P., Stolp, H., Trüper, H.G., Balows, A., Schlegel, H.G. (Eds.), The Prokaryotes. Springer, Berlin, pp. 948–977. Nelson, D.W., Sommers, L.E., 1982. Total carbon, organic carbon
and organic matter. In: Page, A.L. (Ed.). Methods of Soil Analysis Part 2: Chemical and Microbiological Properties, 2nd edn., Am. Society of Agronomy, Madison, Wisconsin. pp. 539–580.
Neue, H.U., Lantin, R.S., Wassmann, R., Adduna, J.B., Alberto, M.C.R., Andales, M.J.F., 1994. Methane emission from rice soils of the Philippines. In: Minami, K., Mosier, R., Sass, R.L. (Eds.), CH4and N2O-Global Emissions and Controls from Rice Fields and Other Agricultural and Industrial Sources. NIAES Series 2, pp. 55–77, Tokyo, Japan.
Rolston, D.E., 1986. Gas flux. In: Klute, A. (Ed.), Methods of Soil Analysis, 2nd edn., Amer. Soc. Agron. and Soil Sci. Soc. Amer. Monograph No. 9, Wisconsin, USA, pp. 1103– 1119.
SAS Institute, 1988. SAS/STAT User’s Guide. Release 6.03 SAS Institute, Cary NC, USA.
Sass, R.L., Fisher, F.M., Tuner, F.T., Jund, M.F., 1991. Methane emission from ice fields as influenced by solar radiation, temperature and straw incorporation. Global Biogeochem.Cycles 5, 335–350.
Schutz, H., Holzapfel-Pschorn, A., Conrad, R., Rennenberg, H., Seiler, W., 1989. A 3-year continuous record on the influence of daytime, season, and fertilizer treatment on methane emission rates from an Italian rice paddy. J. Geophys. Res. 94, 16405– 16416.
Shin, Y.K., Lee, Y.S., Yun, S.H., Park, M.E., 1995. Methane emission measurement in rice paddy of Korea. The Proceedings of International Symposium on Environment and Biometeorology. China Agricultural Scientech. Press, Beijing, pp. 495–503.
Soil Survey Staff, 1998. Keys to Soil Taxonomy. 8th edn., United States Department of Agriculture and Natural Resources Conservation Service, Washington, D.C.
Taiwan Agricultural Research Institute (TARI), 1978. Soil Survey of Taipei and Ilan Counties. TARI, Taichung, Taiwan. Wang, M.X., Shangguan, X.J., 1995. Methane emission from rice
fields in China. In: Peng, S., Ingram, K.T., Neue, H.U., Ziska, L.H. (Eds.), Climate Change and Rice. Springer, Berlin, pp. 69–79.
Yagi, K., Minami, K., 1990. Effect of organic matter applications on methane emission from Japanese paddy fields. In: Bouwman, A.F. (Ed.), Soil and the Greenhouse Effect. Wiley, pp. 467–473. Yang, S.S., Chang, E.H., 1997. Effect of fertilizer application on methane emission/production in the paddy soils of Taiwan. Biol. Fertil. Soils 21, 451–456.
Yang, S.S., Chang, E.H., Chung, R.S., Chea, W.P., 1998. Methane production of sediments from lake and river. J. Chin. Agric. Chem. Soc. 36, 111–122.
Yang, S.S., Chang, H.L., 1998. Effect of environmental conditions on methane production and emission of paddy soil. Agric. Ecosys. Environ. 69, 69–80.