F IRST STEPS TOWARDS AN INTEGRATED CITYGML-BASED 3D MODEL OF VIENNA
G. Agugiaro
Sustainable Buildings and Cities Unit, Energy Department, AIT – Austrian Institute of Technology, Vienna, Austria [email protected]
Commission IV, WG IV/1
KEY WORDS: Data integration, 3D virtual city model, CityGML, spatial databases
ABSTRACT:
This paper presents and discusses the results regarding the initial steps (selection, analysis, preparation and eventual integration of a number of datasets) for the creation of an integrated, semantic, three-dimensional, and CityGML-based virtual model of the city of Vienna. CityGML is an international standard conceived specifically as information and data model for semantic city models at urban and territorial scale. It is being adopted by more and more cities all over the world.
The work described in this paper is embedded within the European Marie-Curie ITN project “Ci-nergy, Smart cities with sustainable energy systems”, which aims, among the rest, at developing urban decision making and operational optimisation software tools to minimise non-renewable energy use in cities. Given the scope and scale of the project, it is therefore vital to set up a common, unique and spatio-semantically coherent urban model to be used as information hub for all applications being developed.
This paper reports about the experiences done so far, it describes the test area and the available data sources, it shows and exemplifies the data integration issues, the strategies developed to solve them in order to obtain the integrated 3D city model. The first results as well as some comments about their quality and limitations are presented, together with the discussion regarding the next steps and some planned improvements.
1. INTRODUCTION
Thanks to the constant advances in all fields tied to Geomatics (e.g. more efficient data acquisition sensors and methodologies, spatial data processing tools and data management systems, as well as a growing number of geo-aware applications), an increasing number of cities is in the process of creating 3D virtual city models as a means for data integration, harmonisation and storage, which goes far beyond the somehow “standard” visualisation purposes both in 2D and 3D.
A unique and spatio-semantically coherent urban model, as described in Stadler and Kolbe (2007), can provide a multiplicity of beneficial effects, as it represents an information hub for further advanced applications ranging, for example, from urban planning, noise mapping, augmented reality, up to energetic simulation tools (Bahu et al., 2013).
To these extents, CityGML (Gröger and Plümer, 2012) is an international standard conceived specifically as information and data model for semantic city models at urban and territorial scale. It is being adopted by more and more cities all over the world.
In general terms, the fully (or semi-)automatic creation of a semantic virtual city model requires the heterogeneous input datasets to be sufficiently “clean” and properly structured, before moving towards the actual data integration process. This paper presents and discusses the preliminary results regarding these initial steps (selection, analysis, preparation and eventual integration of a number of datasets) with the overall goal of creating a CityGML-compliant semantic 3D virtual model of the city of Vienna.
The work described herein is embedded in the European Marie-Curie ITN project “Ci-nergy, Smart cities with sustainable energy systems” (CI-NERGY, 2015), which aims, among the rest, at developing urban decision making and operational optimisation software tools to minimise non-renewable energy use in cities.
The project involves close collaboration between academic research centres and industrial companies from the energy and software technology sector, as well as the municipalities of Geneva and Vienna, which were chosen for their very ambitious sustainability goals.
Given the current lack of integrated, semantic, three-dimensional, virtual, and CityGML-based city model in either city, it was decided to carry out preliminary studies for both test cases.
This paper reports about the experiences done so far in Vienna, and it is structured as follows: section 2 describes the test area and the data sources, section 3 deals with the data integration issues, the strategies developed to solve them and create the integrated 3D city model. Section 4 presents the first results as well as some comments about their quality and limitations, while section 5 contains the conclusions and the discussion regarding the next steps and some planned improvements.
2. TEST AREA AND DATA SOURCES 2.1 Test area
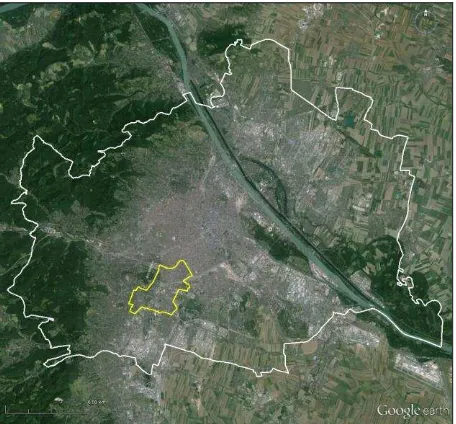
Vienna is the capital and largest city of Austria, with a population of nearly 1.8 million. It is composed of 23 districts. Although some preliminary work was carried out using city-wide datasets, the 12th district of Vienna, named Meidling, was chosen as test case for the generation of the 3D city model. Given its heterogeneity in shape, structure and characteristics, the district of Meidling was deemed adequate to represent a good test case (Figure 1). Meidling spans an area of approximately 8.2 km2, it lies just 5-7 km southwest of the city centre and is located nearby the well-known Schönbrunn palace. It is a heavily populated urban area (circa 90000 inhabitants, i.e. circa 11000 inhabitants/km2) with many residential buildings of greatly varying size and typology, but also with large recreational areas and parks. It can be
approximately divided into two main parts: the north-eastern one is characterised by a heavily developed urban residential texture, while the south-western one is a more mixed (industrial and light residential) area, which then gradually continues southwards to become the 23rd district.
Meidling represents also an important transportation hub, as the homonymous train station lies quite in the middle of the district as serves as an important connecting hub to many bus, tram and rapid transit (S-Bahn and underground) lines between the city and the surrounding suburbs.
Figure 1. Boundaries of Vienna (in white) and extents of the district of Meidling (in yellow). Image source: Google Earth
2.2 Spatial data sources
Several heterogeneous datasets were collected, mainly from the already available Open Government Data Wien catalogue (OGD-W, 2015), which offers among the rest WFT and WMS services, or were provided by the Municipality of Vienna for the purposes of the Ci-nergy project (the latter are identified by an asterisk (*) in the following list). In any case, no new data (spatial and non-spatial) were acquired, the explicit purpose being to use as much existing data as possible, and as much publicly available data as possible.
All spatial data, where applicable, are geo-referenced according to the MGI/Austria GK East projection (EPSG code: 31256), which is the one generally used by the city of Vienna. The height reference is the so-called “Wiener Null”, set at 156.68 m above (Adriatic) sea level.
In the following, the data sources will be classified into spatial and non-spatial ones, for better reading. Especially in the case of OGD data, they were retrieved already for the whole city.
D1) A set of shapefiles representing the polygon-based representation of the Mehrzweckskarte (MZK). The MZK is the official point and line-based map of Vienna, containing all most important objects (buildings, streets, etc.). From the MZK, the Flächen-MZK (F-MZK) is obtained, i.e. a 2D polygon-based map containing nearly 2.5M geometries, where objects are classified into 50 classes (e.g. buildings, traffic areas, water bodies, parks, etc.). For buildings, the Bezug code is also given. The Bezug identifies man-made features such as buildings, although it cannot be used as primary ID (details will be given in the section 3 regarding spatial data issues). If
entities of the MZK are added or significantly updated for some reason, a new Bezug code is issued. The shapefiles used in this work were retrieved in 2015. Metadata information about the latest update is available for each shapefile, however not at single-feature level;
D2) Another vector-based product derived from the MZW is the so-called Baukörpermodell, i.e. a prismatic representation of all buildings in Vienna, in which the extrusion of the building (or building part) polygon has been performed between the DTM and the rain gutter height of the object, however some geometries with overhangs exist as well. The Baukörpermodell contains approximately 665k objects and is available in two formats: as a set 3D DXF files and as a set of 2D shapefiles. In each DXF file, every layer corresponds to a Bezug and contains the corresponding triangulated geometric object(s), however no other semantic information is available. Some objects are modelled in detail, for example with porticos, roof overhangs, bridges connecting buildings, being represented, too (Figure 2). In each shapefile, instead, each 2D polygon is defined by means of the attributes Bezug, the FMK-derived class, the DTM height value (zDTM), as well as the rain gutter height (zmax) and, where required, the height of the lowest surface between DTM and rain gutter (zmin). As with the F-MZK, the Baukörpermodell was downloaded in 2015;
Figure 2. Example of Baukörpermodell geometries
D3) *A set of CityGML files containing buildings modelled according the level of detail 2 (LoD2). The buildings are modelled starting from Lidar and photogrammetric DTM data and the F-MZK (extracted in 2012) and contain the Bezug as CityGML Generic Attribute. The whole CityGML dataset for the city of Vienna is not currently publicly available yet, as internal data quality and consistency checks are still being carried prior to the official publication. All buildings which need corrections are currently identified by means of proper flags (circa 9% as of summer 2015). Nevertheless, the whole dataset for Vienna (1460 tiles) was delivered and used in this work for testing purposes, in order to explore and test the data, and prepare in advance the required data integration procedures. Once the CityGML dataset is finally revised and available, it will be used instead of the current one; D4) A polygon-based vector map representing the land-use for
the whole city of Vienna. Polygons are classified using three hierarchical levels with growing degree of detail; D5) A set of several point-based vector maps containing
information about building names, building use/function (e.g. schools, theatres, commercial centres, kindergartens, swimming pools, public offices, hospitals, etc.);
D6) A set of vector-based maps representing administrative boundaries for the city, the districts, and the building blocks, each with its unique ID.
2.3 Non-spatial data sources
The non-spatial datasets used in this work consist of:
D7) *A Microsoft Excel file containing the Wiener Wärme Kataster (WWK) data –i.e. the “Vienna Heat Cadastre” –, consisting in approximately 160000 records which contain a series of attributes like for example:
- Address and address ID. The address contains the street name and number, the district number, however no geographic coordinated are given for each address; - Bezug code;
- Building block ID;
- Year of construction (real or estimated); - Estimated number of floors;
- Information about the net area classified into some classes of use (e.g. residential, school, hotel, hospital, etc.);
- Classification into residential, non-residential or mixed residential use;
- (Scarce) information about heating system and energy carriers;
- Estimated values for annual energy demand and energy consumption for space heating, domestic hot water and electricity;
The data contained in the WWK date approximately to the end of 2011-beginning of 2012;
D8) An XML-based file containing information about all Gemeindebauten (social housing buildings) in Vienna, such as:
- Address and address ID; - Bezug code;
- Name of the Gemeindebau;
- Year of construction, year of refurbishment; - Number of households;
- Name of the architect(s);
- Some historical and architectonical information. D9) *For a limited number of residential buildings, detailed
information about the number of households, their surface net area, their floor, etc.
It must be added that a considerable number of further datasets is already available over the Open Government Data Wien platform. These datasets are surely worth to be integrated into a city model, however they will not be treated in this paper as they are – for now – out of scope.
3. 3D CITY MODELLING
This paper deals with the creation of the 3D virtual city model of Vienna, and it focuses in particular on the modelling of the buildings and the integration of their available relevant data, as they represent one of the most relevant entities in an urban model.
Therefore it is crucial to rely on a definition of building, like the following: a building is a physical object, defined by its boundaries in a 3D space. It is a man-made structure at least with a roof and walls. Despite the variety of shapes, sizes and functions, its uniqueness can be derived by a number of characteristics: a building can be unique due to its geometrical shape, due to its function and/or usage, or construction technique, or property. A single building may be also further decomposed into building parts, if particular relevant
discontinuities exist and need to be evidenced, however not affecting the global uniqueness of the building itself. It is the case, for example, of relevant geometrical discontinuities. In such a case, a building is the result of a composition of its building parts.
CityGML, for example, allows to model a building either as whole or by means of multiple building parts, if needed. Although the adoption of these classification criteria might be not always straightforward due to the complexity of the real world, it is nevertheless useful to keep them in mind when tackling the heterogeneity of “building-like” entities in a city.
All spatial and non-spatial datasets briefly described in the previous section were explored and analysed in order to understand their characteristics and identify potential issues with regards to their integration.
The goal is to obtain a CityGML-compliant model for the whole city, where geometries (in LoD0, LoD1 and LoD2) are enriched with attributes, in order to create a unique data source as coherent and “clean” as possible.
In the following sections, not all available datasets will be described in detail, but only those where relevant issues were identified and solved. Although sometimes applied only to the study area in Meidling, all integration strategies were conceived to be replicable in any part of the city.
3.1 Spatial data issues
In order to facilitate data exploration and analysis, all datasets (spatial and non-spatial) were first imported into a PostgreSQL 9.4 database with the PostGIS 2.1 extension. For those tile-based datasets containing geometries split over multiple tiles, a geometry dissolve operation was carried out beforehand.
When it comes to the Baukörpermodell dataset (which is a sub-set of the FMK), the nearly 665k 2D features are classified into eight classes: 11: Gebäude, 12: Überbauung, 13: Flugdach, 14: Glashaus, 82: Telefonzelle, 83: Stationseinrichtung, 84: Kiosk, 86, Portal.
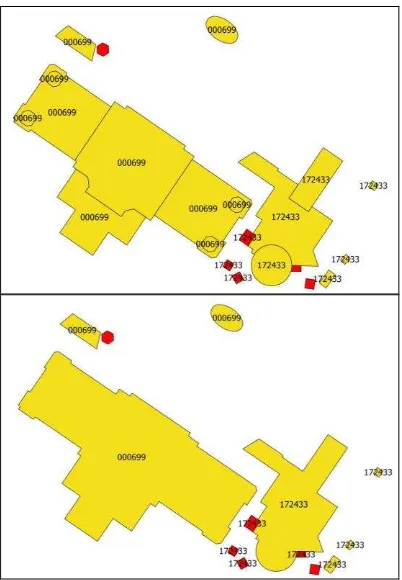
Class 11 represents buildings, class 12 contains buildings with an open roofed zone (e.g. the portion of building over arcades), class 13 contains flying roofs, e.g. “free standing” roofs, like those common at fuel stations or railway platforms. Class 14, 82, 83, 84 and 86 contain glasshouses, phone booths, stations or station-related buildings, kiosks and portals, respectively. It must be stressed that in the F-MZK and the Baukörpermodell there is no semantic distinction between buildings and building parts: they are simply 2D polygons that were digitised on the basis of relevant discontinuities in the roof shapes. Nor is precise information given about composition or hierarchy. The only available information is the Bezug code, which enables indeed a hierarchical aggregation, however it does not guarantee to identify buildings uniquely once geometries are grouped. As exemplified in Figure 3 (top), a Bezug code can refer to a single building, a group of adjacent buildings or building parts, or a group of disjoint buildings. In Figure 3 (bottom), multiple disjoint buildings share the same Bezug also after dissolving common boundaries. Strategies to overcome this problem will be given in section 3.2.
Figure 3. Example of cardinality problems due to the Bezug code: before (top) and after (bottom) dissolve. Even after dissolving common boundaries of the polygons, same codes are shared by several non-adjacent buildings (e.g. 000699, 172433), which cannot be identified uniquely. Features of class 11 and 12 are here represented in yellow, while class 13 is represented in red, as well as their aggregation
With respect to the CityGML dataset, a first simple comparative analysis was carried out confronting the Baukörpermodell (from 2015) with a conceptually analogous map (from 2012), obtained by extracting from the CityGML buildings (and building parts) the GroundSurfaces and using them as 2D footprints for reference. From now on and for better readability, these two 2D polygon-based maps will be simply called “Footprints-2015” and “Footprints-2012”, respectively.
Following issues were identified in the CityGML dataset:
I1) The original MZK classification is lost, however it was possible to identify objects originally belonging to classes 11, 12, 13 and 14 by means of comparison with the Footprints-2015 map;
I2) As expected, the same Bezug-related cardinality issues are found also in the CityGML dataset: the Bezug code is used alternatively as a CityGML Group or a Generic Attribute of the buildings, but not as primary ID;
I3) Sometimes the Bezug-related aggregation rules are not respected: a building part can happen to be classified as an independent building;
I4) Sometimes objects are modelled and classified wrongly: those originally belonging to class 13 (flying roofs) are modelled instead as “full-body” geometries reaching the ground, and cannot be differentiated from other buildings. i.e. they should not be classified as buildings, but as Building Installations;
I5) A multi-part object can be composed of a set of buildings and building parts. This is, strictly speaking, not against
the CityGML specifications, nevertheless good modelling practices – e.g. the wiki of the SIG3D (2015) – advice to have a multi-part building made only of several building parts, and not a mixture of building and building parts; I6) There are some invalid geometries (erroneously
duplicated geometries, duplicate consecutive points, degenerate geometries, self-intersections, etc.)
I7) Some tiles have several objects sharing the same ID, therefore they cannot be identified uniquely.
Although not an issue, some other phenomena were observed while comparing the “Footprints-2015” and “Footprints-2012” maps in order to find the correspondences between homologous objects (The reason why these correspondences are needed will be explained later on).
Between two maps there are, obviously, time-dependent changes, with polygons (e.g. a building) being added and others being deleted, while others remain unchanged or change in shape over time.
Identifying the latter case automatically is particularly tricky: the same building can in reality remain the same, but the polygons composing its footprint may change, sometimes even very slightly. What is more, in such occasions a new Bezug code might be issued, as mentioned before.
Given the lack of persisting relations between homologous objects, the comparison could be carried out only by means of spatial overlay, implementing a set of rules to check that corresponding geometries share the same Bezug and the same geometry. An area overlapping ratio of 98% was considered reliable enough to consider two polygons homologous between the two maps.
In case of discrepancies, further checks were implemented to help distinguish between features having different Bezug codes and different shapes (potential map update with deletion of the old feature and insertion of a new one), or features having different Bezug codes and similar or nearly overlapping shapes (small updates). In any case, non-corresponding features were identified as “change” in order to be checked before the next steps could be carried out.
In Meidling, the precise distinction between “real” changes and “drawing” changes was carried out by means of visual inspection in the Footprints-2012 dataset (compared to the Footprints-2015), therefore focussing on a considerably reduced number of cases (circa 10.7% of the whole Meidling dataset). Some figures are collected in Table 1.
Vienna (whole city)
N. polygons 477222 100.0%
Unchanged 413450 86.6%
Deleted 2270 0.5%
Changed 61502 12.9%
Meidling district
N. polygons 19909 100.0%
Unchanged 17702 88.9%
Deleted 77 0.4%
Changed 2130 10.7%
“Real” changes 207 1.0%
“Drawing” changes 1923 9.7%
Table 1. Changes in the Footprints-2012 dataset with regards to the Footprints-2015 one, for the whole city and Meidling only.
Once the correspondence between homologous polygons between the two footprint datasets was established, the classification of the 2015 polygons was backported to the 2012 ones. It was therefore possible to distinguish again the 2012 polygons into classes 11, 12, 13 and 14. Only the few
corresponding ones (i.e. deleted, 0.4%, and “real” changes, 1.0%), the classification was carried out manually.
For the whole city of Vienna, the following values are only indicative, as no manual check was carried out on the non-corresponding polygons. Nevertheless, they provide an approximate quantification of the class distribution. The results are presented in Table 2.
Meidling district
N. polygons 19909 100.0%
Class 11 18970 95.3%
Class 12 149 0.7%
Class 13 769 3.9%
Class 14 21 0,1%
Vienna (whole city)
N. polygons 477222 100.0%
Class 11 449904 94.3%
Class 12 2638 0.6%
Class 13 22561 4.7%
Class 14 2119 0.4%
Table 2. Distribution of object classes in Meidling and Vienna (whole city).
3.2 Spatial data integration
As the main issues for the required datasets were identified, and building upon the relation between the Footprints-2012 and the CityGML objects, it was possible to define and implement a set of rules in order proceed with the integration of the geometrical data. The goal was to map and aggregate again the existing CityGML objects, and add the LoD0 and LoD1 geometries as well. In the following, the rules are grouped into three sub-groups for better reading.
With regards to classification, following rules were implemented:
R1) Objects belonging to classes 11, 12 and 141 map to CityGML Buildings (or Building Parts, see later); R2) Objects belonging to class 13 map to Building
Installations;
With regards to the aggregation, following rules were implemented:
R3) Adjacent geometries of classes 11 and 12 and 14 are merged and dissolved, while those in class 13 are not; R4) If a resulting footprint is the merge of two or more
polygons, the related CityGML objects are all classified as Building Parts. The resulting building is therefore a multi-part object. Otherwise, the building is a single-part object and the corresponding CityGML object is classified directly as Building. In other words, a multi-part building consists only of building parts, as recommended by the CityGML modelling best practices;
R5) A UUID (Universally unique identifier) is generated for each resulting feature: polygons from the merge of classes 11, 12 and 14 become footprints of unique buildings; R6) The Bezug code maps to a CityGML CityObjectGroup
object, which contains the corresponding buildings as members of the group.
Finally, when it comes to geometry, following rules were implemented:
R7) All geometries are checked automatically to identify and correct invalid geometries due to duplicate geometries, duplicate consecutive points, degenerate geometries, self-intersections, etc.;
1
According to the CityGML 2.0 code lists, a glass/green house is a building.
R8) All geometries are vertically shifted by adding the value of the Wiener Null (+156,68 m) to the existing z coordinates and the existing attributes containing height information;
R9) For the LoD0 geometries, the footprints are generated from the Footprint-2012 map using the aggregation and classification rules described above. There is only one LoD0 footprint per building;
R10)For the LoD1 geometries, a vertical extrusion of footprint is carried out for all objects in classes 11, 12 and 14, using the zmax value from the corresponding object in the Baukörpermodell. If this value is not available, then the lowest rain gutter from the corresponding LoD2 roof geometries is used instead. In accordance with the CityGML specifications, no Building Installations are added at LoD1;
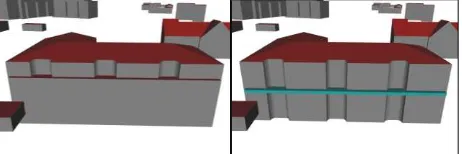
R11)The LoD2 geometries from the original CityGML dataset remain unchanged (besides the vertical shift), with the exception of the class 13 objects: they are instead replaced by a prismatic geometry obtained by vertical extrusion of the corresponding GroundSurface between the zmin and zmax values from the Baukörpermodell. If no zmin value is available, a standard value of 0.5 metres is used for the extrusion height. An example can be seen in Figure 4, where the same building is shown before and after remodelling of a class 13 component object as Building Installation (in azure).
Figure 4. Reclassification and remodelling of class 13 objects (flying roofs) from buildings to building installations. Left: the original dataset, right: the remodelled object (in azure)
The resulting CityGML model is therefore a hybrid one, as it contains the original geometries for the LoD2, but it uses some height information from the Baukörpermodell for the LoD1 geometries and for the Building Installations.
The new classification and aggregation rules allowed to overcome the issues in the original CityGML dataset. With regards to the district of Meidling, 52 CityGML tiles were processed. The reclassification and regrouping led to 6821 CityGML buildings, of which 2641 are single-part buildings (38.7%) and the remaining 4179 are multi-part buildings (61.2%).
Again, the model generation pipeline was tested also for the whole city of Vienna, however, as mentioned before, the following values are only indicative: 172725 buildings, of which 73601 single-part (42.6%), and 99124 multi-part (57.4%).
3.3 Non-spatial data issues
With regard to the WWK dataset, the major issues were tied to its linkage to the existing geometries, e.g. using the Footprint-2012 map. Each record in the WWK refers to a building address, although in some few cases multiple entries for the same address are found. Each address is available either as ID or as the corresponding string (street name + number). A first aggregation was hence carried out in terms of address ID, after
performing a check to correct minor errors in street names and/or codes.
Some initial tests were carried out using the available fields contained in the table, given the lack of a primary key to join each WWK record to a unique geometry.
In terms of WWK records to Footprint-2012 geometries, the Bezug code could be used only for those cases in which a 1:1 or a n:1 relations apply. With regards to the study area of Meidling, this would yield a link ratio of only about 23% of all buildings.
A second integration strategy was carried out by means of spatial overlay between the address point geometries and the building geometries. However, given the lack of explicit spatial entities in the WWK, the point coordinates had to be retrieved by means of forward geocoding using a freely available geocoding service by the city of Vienna. Some automatic and some manual editing steps were required, given a number of problems which were identified in the process, such as: - (Few) outdated/changed street names were not geocoded; - Use of different string coding for the address names
between the WWK and the geocoding server;
- Impossibility to add the district number in the query in order to distinguish homonymous street names used in different districts;
- Address point geometries falling outside of the building polygon.
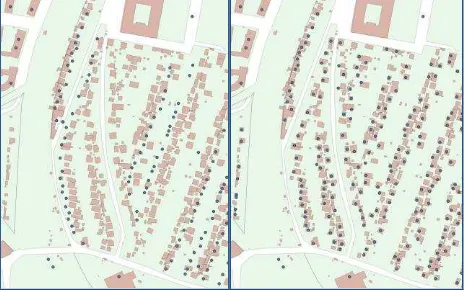
Especially in the last case, which was one of the most time-demanding to correct, the wrong point geometries for Meidling were edited and – if necessary – moved manually, as no unique, satisfying and reliable automatic criterion could be found to assign a point to the corresponding building geometry. An example can be seen in Figure 5.
Once these checks and edits were carried out, for the study area of Meidling, 94,8% (7045 out of 7434) addresses could be assigned to building geometries. On the other hand, the building geometries with one or more address points increased from 33.0% (2248 out of 6821) to 81.5% (5563 out of 6821).
Figure 5. Example of addresses not automatically geocoded or falling outside the building geometries (left) and after editing (right)
As a consequence, a geo-referenced dataset containing all addresses was extracted from the WWK, normalised and used also in successive steps. It represents therefore the actual link between the building geometries and other non-spatial datasets, whenever no other data integration technique is possible but spatial overlay.
This was the case, for example, of the XML-base dataset of the social housing buildings (Gemeindebauten), which similarly
contains information about the addresses, but not their geographic coordinates.
3.4 “Enriched” 3D model generation
All data integration steps were implemented either as a series of workbenches in Safe Software’s FME 2015 Professional or as SQL scripts. As mentioned before, PostgreSQL 9.4, coupled with PostGIS 2.1, was adopted as DBMS for storage. All CityGML data were imported into the already predefined citydb schema using the free 3DcityDB tools. Once the CityGML geometries were enhanced as described in section 3.2., the city model was “enriched” with a number of attributes, drawing from the remaining data sources listed in section 2.2 and 2.3, or computing them directly from the geometries. Following attributes are now available at building level:
- Building name(s), building address(es); - Building class, building function, building use; - Year of construction;
- Storeys above ground, average height of storeys above ground;
- groundArea, groundHeight, (lowest) rainGutterHeight, lod1Volume, lod2Volume;
- Total net floor area;
- For social housing buildings (Gemeindebauten): architect, building info, refurbishment info, year of refurbishment; - Links to the block ID and to the district ID.
The land use map was used to classify the buildings into 28 classes, and the information was stored into the building class attribute. The building name and building function attributes were used to store, whenever available, the information coming from the several point-based vector maps with building names and building use/function (see dataset D5 in section 2.2). From the WWK, data regarding the net area floor were aggregated at building level and reclassified into 23 classes, like for example: residential, mainly residential (i.e. >50% of net floor area), office, mainly office, religious, commercial, mainly commercial, education, kindergarten, military use, etc.
For the residential buildings, a further classification was carried out to characterise them in term of single-family houses, multi-family houses, and apartment blocks. This classification is in line with the ones used in the Tabula criteria for Austria (Antmann, 2011; Antmann and Altmann-Mavaddat, 2014). Finally, the following features were also imported into the CityGML model:
- Building blocks, districts and city borders - Land use
The remaining datasets (e.g. dataset D9) have not been integrated as CityGML yet, but nevertheless they have been harmonised and stored in the same PostgreSQL database, paying attention to guarantee all necessary links to the CityGML objects. The reason for this is that, for some specific energy-related features (e.g. information about building units), a mapping with the corresponding features and attributes in the CityGML Energy Application Domain Extension is currently work in progress (Nouvel et al., 2015).
The reason is that CityGML can already store attributes for several features, however some specific domain attributes (e.g. energy) cannot be stored natively in a systematic and standardised way. CityGML can however be extended by means of so-called Application Domain Extensions (ADE): depending on the specific needs, new features or properties can be added, hence augmenting the facto its modelling capabilities.
An Energy ADE (ENERGY ADE, 2015) is being currently developed by a group of international institutions and is expected to reach version 0.6 at the beginning of 2016. It extends CityGML and serves as common data model in the development of applications in the energy sector.
4. RESULTS
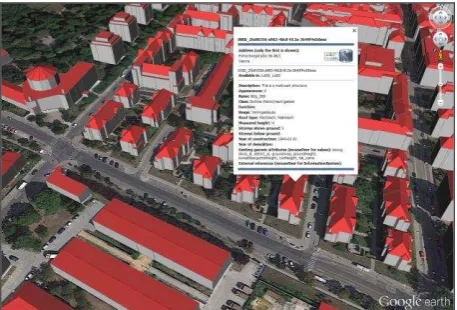
The 3D model is currently available in different ways. For simple visualisation and data exploration, a kmz dataset was generated to be imported and visualised in Google Earth. A selection of relevant attributes can be accessed by means of balloons. An example is represented in Figure 6.
Figure 6. Example of the resulting 3D city model, visualised in Google Earth
What is more, all tables can be accessed and edited by means of a PHP-based graphical user interface (provided the user is granted proper rights), in a similar way as described in Agugiaro (2015). The web GUI is stand-alone, but can accessed also from Google Earth.
When it comes to the geometrical part, some visual tests were carried out to check the result of the disaggregation, reclassification and new aggregation process described in section 3.2.
In general, single building are correctly modelled, either as single- or multi part objects. In case of buildings obtained from adjacent footprints, it can happen that different buildings are actually treated as building parts and therefore grouped into one single building. An example is shown in Figure 7: in a) three terraced buildings are correctly modelled one by one (the middle one is highlighted in green). In b) a conceptually similar case has however 3 similar residential buildings modelled as one single object. The same happens with buildings that may be of heterogeneous use or type, as seen in c). Finally, in d) a building can be modelled as a single geometrical object, although in reality it generally corresponds to a complex “agglomerate”, made up of several parts.
It must be stressed here that these inconsistencies are not actually errors due to the data integration process. They are the consequence of the way the original data (namely, the F-MZK) is characterised by means of the Bezug code. Nevertheless this leads to a degradation of the granularity at which some data could be available, as some attributes are directly joined to buildings. This means, for example, that in case b) the resulting object will contain the aggregated values of 3 distinct buildings, instead of having each building characterised singularly.
As a solution, for the cases b) and c) a reclassification of the polygon hierarchies is needed before the real data integration takes place, while for case d) the only solution it to split/redraw the geometries, and then classify them again – which is beyond the scope of this work.
It must be added that this is actually a well-known problem, for which the city of Vienna is already planning to implement different solutions (which however might take time and will not likely be available in the nearest future).
Figure 7. Highlighted in green: a) a correctly modelled building; b) 3 similar residential buildings wrongly grouped into a single building; c) 2 different buildings wrongly grouped into a single building; d) a building “agglomerate” deriving from one single footprint
Therefore, for testing purposes, the Meidling dataset was further enhanced, in that all buildings falling into cases b) an c) were hierarchically reordered by means of a semi-automatic process. In this way, distinct buildings could be generated out of the “groups” mentioned before.
This operation led to 7009 CityGML buildings, of which 3117 are single-part buildings (44.5%) and the remaining 3892 are multi-part buildings (55.5%), therefore increasing the percentage of single-part building from the previous 38.7%.
When it comes to completeness and accuracy of the attributes, some initial tests and visual inspections were carried out to check the overall results of the data integration process. In the following, some attributes are discussed.
With regards to the building class, it derives from the official land use maps of the city of Vienna and is 100% complete. For the building function, the information contained is indeed more detailed and no relevant errors were found, however it is quite scarce as it accounts for only 5% of all buildings. One reason for this is that information about private residential buildings is not included in the original input datasets, unlike other classes like schools, cinemas, offices, etc.
Regarding the building usage, completeness accounts for about 86% of all buildings, however some inconsistencies were found due to missing/incorrect/outdated data in the input datasets. For example, it was observed that sometimes a church is assigned only residential net floor area, or that in a school there is net floor area for offices, but no net floor area classified for education.
With regards to the year of construction, about 76% of all buildings have this information.
For the number of storeys above ground, completeness accounts for about 84% of all buildings, however some gross errors were found by means of simple visual inspection and comparison
a) b)
c) d)
with Google Maps (oblique views). For this reason, a check routine is being implemented which confronts the given value with a computed one, obtained from the geometry height and the average storey height. This will help identify and possibly correct gross discrepancies.
A number of other checks is in preparation to identify other inconsistencies and help correct them.
5. CONCLUSIONS AND OUTLOOK
This paper has presented the first results regarding selection, analysis, preparation and eventual integration of number of datasets with the goal of creating an integrated, semantic, 3D, virtual, and CityGML-based city model of the city of Vienna. It represents an example of a “real-world” situation, where decision and strategies need to be made according to the existing input data.
Although, in general, data have been gathered for the whole city, the district of Meidling was chosen as study area: tests were carried out in order to acquire knowledge about the data, gather experience how to prepare and (re)structure them in order to facilitate the data integration process.
The main data integration issues (semantic and structural problems, cardinality and geometry issues, etc.) were identified, a set of rules was implemented to overcome most of these issues, sometimes automatically, sometimes semi-automatically, sometimes manually when otherwise not possible. A step-based workflow was implemented that allows to obtain a first 3D model corresponding to the initial requirements.
According to the gathered experience, an estimation could be made with regards to the time effort to extend this methodology to the whole city to achieve comparable results as in Meidling: approximately 10 person months.
Availability of more accurate databases, e.g. the address point geometries, could speed up the process considerably, but it would not guarantee that the data stored in the WWK be integrated flawlessly, due to the peculiar characteristics of the dataset and its relevance in terms of information contained. On the other hand, if the initial effort could not be negligible, it yields the added value of data reusability (i.e. “do once, use many”), also for other application scenarios. The 3D city model is suitable to be used in a number of other applications, given its open standard and its application-independent nature.
When it comes to the planned improvements in the near future, some actions have already been planned. Some already available datasets, especially those related to energy aspects (PV systems, solar panels, etc.) have not been integrated yet. Given the relevance of the energy themes within the Ci-nergy project, initial tests are being carried out to understand how to map the meaningful data in Vienna to the Energy ADE, and vice versa, how to contribute to the design of the Energy ADE taking as example also the Viennese datasets.
Nevertheless, a prerequisite is the availability of a reliable CityGML-compliant 3D city model, hence the need to first deal with its generation from the existing datasets. This article has therefore described the steps done so far in order to achieve this first milestone.
One of the uses of the 3D city model will be therefore to act as an information hub for the energy-related software tools that are being developed, e.g. to estimate to energy demand (heating, cooling, etc.) for the building stock or define different energy scenarios and estimate their effect on existing infrastructures (e.g. district heating).
Another topic worth further investigation is the enrichment of the LoD2 models with further details already contained in the
Baukörpermodell: as of now, the LoD2 WallSurfaces are only simple vertical geometries from the rain gutter to the DTM. The quality of the model might improve if information about passages, arcades, niches etc. (see Figure 2) could also be integrated into the LoD2 geometries. One direct advantage would be the reduction of errors in the computation of the enclosed volumes, which is for example an important parameter when estimating the related energy demand for heating and cooling.
ACKNOWLEDGEMENTS
The author gratefully acknowledges the European Commission for providing financial support during the conduct of research under the FP7-PEOPLE-2013 Marie Curie Initial Training Network “CI-NERGY” project with Grant Agreement Number 606851.
As stated and indicated in section 2.2, some of the datasets used in this work were kindly provided by the city of Vienna specifically for Ci-nergy project. The author would like to thank in particular Harald Reichl (Magistratsdirektion Strategische Energieangelegenheiten), Hubert Lehner and Christian Sam (MA 41 Stadtvermessung) and Christian Pöhn (MA 39 Prüf-, Überwachungs- und Zertifizierungsstelle).
REFERENCES
Agugiaro, G., 2015. Energy planning tools and CityGML-based 3D virtual city models. Experiences from Trento (Italy). Applied Geomatics, pp. 1-16, Springer Berlin Heidelberg, ISSN: 1866-928X8, doi: 10.1007/s12518-015-0163-2
Amtmann, M., 2011. Tabula, Reference buildings – The Austrian building typology. Österreichische Energieagentur – Austrian Energy Agency
Amtmann, M., Altmann-Mavadda, N., 2014. Eine Typologie österreichischer Wohngebäude. Österreichische Energieagentur – Austrian Energy Agency.
Bahu, J.M., Koch, A., Kremers, E., Murshed, S.M., 2013, Towards a 3D spatial urban energy modelling approach. Annals of the Photogrammetry, Remote Sensing and Spatial Information Sciences II-2/W1:33–41
Nouvel, R., Kaden, R., Bahu, J.-M., Kämpf, J., Cipriano, P., Lauster, M., Benner, J., Munoz, E., Tournaire, O., Casper, E., 2015, Genesis of the CityGML Energy ADE, Int. Conf. Future Buildings & Districts Sustainability from Nano to Urban Scale: CISBAT2015, Lausanne, Vol. II
Gröger, G., Plümer, L., 2012, CityGML – Interoperable semantic 3D city models. ISPRS Journal of Photogrammetry and Remote Sensing, 71:12–33, ISSN 0924-2716
Kaden, R., Kolbe, T.H., 2013, City-wide total energy demand estimation of buildings using semantic 3D city models and statistical data. Annals of the Photogrammetry, Remote Sensing and Spatial Information Sciences II-2/W1:163–171
Stadler, A., Kolbe, T.H., 2007, Spatio-semantic coherence in the integration of 3D city models. International Archives of the Photogrammetry, Remote Sensing and Spatial Information Sciences, XXXVI-2/C43
References from websites (10 December 2015)
CINERGY, http://www.ci-nergy.eu
ENERGY ADE, http://en.wiki.energy.sig3d.org
OGD-W, https://open.wien.gv.at
SIG3D, http://wiki.quality.sig3d.de/index.php/Modellierung