THE MULTI-LEVEL AND MULTI-SCALE FACTOR ANALYSIS FOR SOIL MOISTURE
INFORMATION EXTRACTION BY MULTI-SOURCE REMOTE SENSING DATA
F. Yu*, H. T. Li, Y. Jia, Y. S. Han, H. Y. Gu
Chinese Academy of Surveying and Mapping, Beijing 100830, P. R. China – (yufan, lhtao, jiayi, hys_han, guhy)@casm.ac.cn Topics: Multi-source classification and information extraction
KEY WORDS: Classification, multi-source remote sensing, Markov random field, biological visual information, ASAR
ABSTRACT:
The research on coupling both data source is very important for improving the accuracy of Image information interpretation and target recognition. In this paper a classifier is presented, which is based on integration of both active and passive remote sensing data and the Maximum Likelihood classification for inversion of soil moisture and this method is tested in Heihe river basin, a semi-arid area in the north-west of china. In the algorithm the wavelet transform and IHS are combined to integrate TM3, TM4, TM5 and ASAR data. The method of maximum distance substitution in local region is adopted as the fusion rule for prominent expression of the detailed information in the fusion image, as well as the spectral information of TM can be retained. Then the new R, G, B components in the fusion image and the TM6 is taken as the input to the Maximum Likelihood classification, and the output corresponds to five different categories according to different grades of soil moisture. The field measurements are carried out for validation of the method. The results show that the accuracy of completely correct classification is 66.3%, and if the discrepancy within one grade was considered to be acceptable, the precision is as high as 92.6%. Therefore the classifier can effectively be used to reflect the distribution of soil moisture in the study area.
Key words:Maximum Likelihood; data fusion; classification; soil moisture
* Corresponding author,Ph. D, majors in classification with active microwave and passive remote sensing data 1. INTRODUCTION
Water is the foremost material for human's survival and sustainable development, and also is a key variable in describing the water and energy exchanges between the land surface and atmosphere interfaces. According to the incomplete statistics, serious drought occurred on average once every two years in China since 1949, an annual average of 303,210,000 acres were affected by aridity, which accounted for 59.3% of the total area affected by all kinds of climate disasters1. Therefore it is extremely significant to develop a method of soil moisture monitoring and it is meaningful for drought disaster reduction, national economic and social sustainable development.
Remote sensing is a technology based on the theory of objects electromagnetic wave of emission and reflection. It can be used to collect the long-term and dynamic land surface information and monitor the changes of environment. Most often, it is considered that data from NOAA-AVHRR, Landsat TM and Radarsat are used to retrieve the soil moisture by traditional remote sensing models. These models can be divided into several categories: Thermal Inertia Method, Anomaly Vegetation Index, Vegetation Temperature Vegetation Dryness Index and some models developed by microwave remote sensing etc. Different models have their own application conditions and limitations. There are many optical remote sensing sensors and images used to get the land surface information, but it is vulnerable by effect of atmosphere condition, cloud coverage and solar radiation conditions; Microwave remote sensing has the characteristics of day, all-weather and strong penetration, but it is strongly influenced by
vegetation coverage, surface roughness, surface heterogeneity and so on.
This paper presents a method based on integration of both active and passive remote sensing data for inversion of soil moisture. The experiment is carried out in Heihe river basin, a semi-arid area in the north-west of china. This method takes good use of the advantages from both optical and microwave remote sensing. In the algorithm the wavelet transform and IHS are used to integrate TM3, TM4, TM5 and ASAR data. Then, the Maximum likelihood is used to classify and extract soil moisture information. The new R, G, B components in the fusion image and the TM6 are used as the input of the classifier, and the output corresponds to five different categories according to different levels of soil moisture values.
2. EXPERIMENTAL DATASET AND STUDY AREA 2.1 Study area description
The study area locates in Grass Station of Lanzhou University in Zhang Ye district, Gansu province with a central geographical coordinates of 39.25043°N, 100.005871°E, and altitude of 1385 meters. Land in the study area is dominantly covered by sparse grassland, some agricultural fields and seriously bare salinization land2. The soil texture in the study area is nearly constant: sand 16.7%, slob 74.8%, clay 8.5%. The measures and reports used in this study are conducted during the Watershed Airborne Telemetry Experiment in 2008. International Archives of the Photogrammetry, Remote Sensing and Spatial Information Sciences,
2.2 Groundobservation
The mean surface gravimetric moisture content is collected from 587 sites of surface layer (0~5cm). The field measured gravimetric moisture content are mostly between 20% and 36%, but it is below 5% in the Desert Experimental Station and as high as 60.9% in some humid area (A point in the Grass Station covered with reed).
2.3 Satellite data
The satellite data used in the study are TM and ASAR (Advanced Synthetic Aperture Radar) acquired on 07/07/2008 and 11/07/2008 respectively. ASAR is one of the sensors carried by ENVISAT-1, this instrument is a C-band radar (central wavelength 5.357cm) with multi-polarization, seven observation angle and five operation modes.
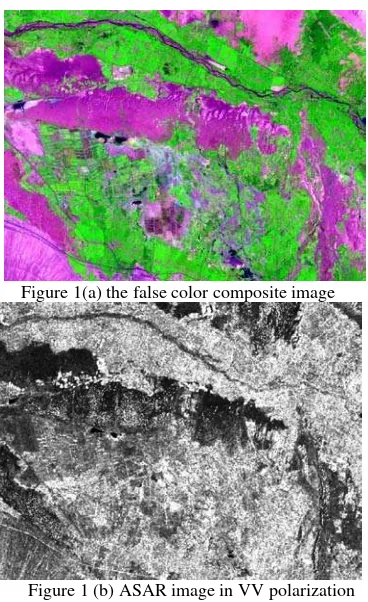
In the study, we use the ASAR with code-name ASAR_APP_1P and Alternating Polarisation mode corresponding to high resolution data (12.5m*12.5m by pixel) and two polarizations of VV and VH. Fig. 1 illustrates the false color composite image (Fig. 1(a)) composed by TM3, 4, 5 and ASAR image in VV polarization (Fig. 1(b)).
Figure 1(a) the false color composite image
Figure 1 (b) ASAR image in VV polarization Figure 1 The images used in the paper
3. FUSION OF TM AND ASAR DATA 3.1 Analysis of the integration strategy
The research aims to extract the information of soil moisture. There is a strong relationship between soil moisture and land surface reflectivity and temperature, so people start from the analysis of objects’ spectrum features and use many methods to monitor soil moisture, such as varies of humidity index, vegetation index, temperature index, temperature-vegetation index and so on3, 4, 5. The TM3 and TM4 were adopted to describe the characters of vegetation because of their strong
absorption of plant chlorophyll and high reflection of plants; TM6 reflecting the information of objects’ temperature, has a close relationship to soil moisture; The wavelength of TM5 (1.55μm-1.75μm) is in the water absorption band (1.4μm -1.9μm), so TM5 is very sensitive to soil moisture and humidity. Although these optical bands can be combined as varies of remote sensing index to obtain the information of soil moisture, they are easily limited by atmospheric condition, cloud coverage and solar radiation conditions. Microwave remote sensing has the characteristics of all-day, all-weather and strong penetration, and can be used as the significant complementarities of optical remote sensing. The backscattering coefficient of radar can be written as the function of soil moisture6:
0
(
)
f Veg
Sr
mv
σ =
,,
(1) Where σ0 is the backscattering coefficient; Veg is the parameter of vegetation; Sr is the surface roughness and mv is the soilmoisture. With the changes of soil moisture, the dielectric constant of soil alters obviously and makes the change of radar echo around 20~80db. Contemporarily the radar signal is also affected by vegetation coverage, surface roughness, surface heterogeneity and so on6.
Consequently, in order to extract the information of soil moisture precisely, we take good use of the advantages of both optic and microwave remote sensing in reflecting soil moisture, and fuse the optic data of TM3, 4, 5, 6 and microwave data ASAR. More useful information and better precision can be gained by the data fusion.
3.2 Fusion method
Wavelet transform and HIS color transform are used to syncretize the TM3, 4, 5 and ASAR in this paper.
Comparing to normal wavelet transform, wavelet packet transform is a more accurate method for signal decomposition based on the multi-resolution wavelet analysis, it can further decompose the signal on the high-frequency and transform the signal to any frequency domain.
The basic formula of wavelet packet transform is defined as7:
2 1 the mother wavelet function.
The main steps of image fusion are as follows:
1) Taking TM5, 4, 3 as R, G, B in the HIS color transform, intensity (I) , hue, saturation can be gotten after the transform. 2) At first, histogram matching of the backscattering coefficient of ASAR and I is carried out. Then a kind of wavelet called Harr based on multi-resolution wavelet analysis is built up to decompose the ASAR and I respectively, the number of the decomposition layer is 3. So we can obtain the low-frequency part and the high-frequency part of each image. At last, the frequency part of I is reserved at each layer, and the low-frequency part of two images are integrated to one image by a certain algorithm.
3) The fusion algorithm is described as follows:
(1
) *
*
F
= −
α
A
+
α
B
(3) International Archives of the Photogrammetry, Remote Sensing and Spatial Information Sciences,Where A and B are the high-frequency part of intensity and ASAR respectively,
α
is the weight, F is the high-frequency part of the image fused. In the certain layer of the wavelet decomposition, an array of 3*3 pixels is used to calculate the mean square variance between the central pixel and its surrounding eight pixels then a can be written as:*
BB A
K S
S
S
α =
+
(4) Where SA and SB are the mean square variance of image A andB respectively, K is the alterable coefficient, it can be increased when we need more details and edge information of B. K is determined by a, and the value of a is between 0 and 1. 4) When the fusion of high-frequency part is accomplished, we can use it and the low-frequency part of I to rebuild the new intensity (I’) by inverse wavelet transform on every layer of the decomposition. Then, I’, H, S are used to inverse HIS transform and the new R’, G’, B’ can be obtained.
Presently, the radar data is often used to substitute I of the HIS transforms in the integration of optic and radar data8. The details of fusion images can be enhanced by this way, but lots of spectral information will be lost, which causes the image distortion, and is not conductive to extract the information of soil moisture in next steps. In this study, the ASAR and I are integrated by (3) and (4). The algorithm can not only reserve the details of ASAR, but also retain the multi-spectral information
of TM to some extent. It is propitious to extract the information of soil moisture.
4. THE EXTRACTION OF SOIL MOISTURE BY MAXIMUM LIKELIHOOD CLASSIFICATION. 4.1 Experiments
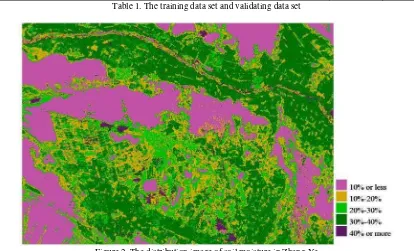
The R’, G’, B’obtained by the fusion of TM and ASAR, and TM6 are taken as the 4 input bands for the maximum likelihood classification. The 587 field measurements of soil moisture are divided to five grades: less than 10%, 10%-20%, 20%-30%, 30%-40% and beyond 40%. According to geographical coordinates of the field measurements, various grades of training data sets and validation data sets can be selected respectively. Because there is obvious difference of the spectrum between the bare soil and the vegetation coverage area, it is not conducive to put them together when extracting the soil moisture information. We need to process the bare soil and the vegetation coverage area separately. The training data set and validating data set in this study is as follows (Tab 1): When the training data is chosen, the Maximum Likelihood Classification is used to classify and the distribution image of soil moisture can be obtained in the bare soil and vegetation coverage area separately. Their mosaic image is given in Fig. 2.
Classification 10% or less 10%-20% 20%-30% 30%-40% 40% or more
Training data set in bare soil 60 10 26 89 30
Validating data set in bare soil 26 16 20 29 7
Training data set in vegetation coverage area 0 21 87 53 21
Validating data set in vegetation coverage area 0 12 48 27 5
total 86 59 181 198 63
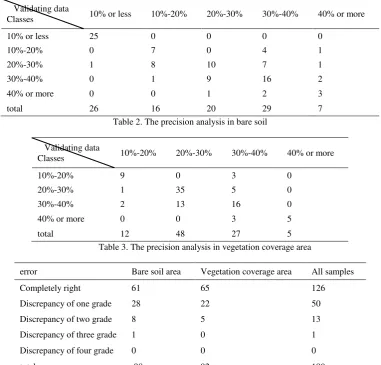
Table 1. The training data set and validating data set
Figure 2. The distribution image of soil moisture in Zhang Ye 4.2 Results and discussions
The validating data set is used to verify the effectiveness of the distribution image of soil moisture in bare soil and vegetation
coverage area. The precision analysis is shown in the Tab 2 and Tab 3. It is shown in Tab 2 that there are 98 validating samples in bare soil area, 61 samples are adjudged rightly, so the accuracy is 62.2%; in the vegetation coverage area 92 samples International Archives of the Photogrammetry, Remote Sensing and Spatial Information Sciences,
have 65 good judgments, which accounts for 70.6%. The overall classification result is shown in Tab 4:
Validating data
Classes 10% or less 10%-20% 20%-30% 30%-40% 40% or more
10% or less 25 0 0 0 0
10%-20% 0 7 0 4 1
20%-30% 1 8 10 7 1
30%-40% 0 1 9 16 2
40% or more 0 0 1 2 3
total 26 16 20 29 7
Table 2. The precision analysis in bare soil
Validating data
Classes 10%-20% 20%-30% 30%-40% 40% or more
10%-20% 9 0 3 0
20%-30% 1 35 5 0
30%-40% 2 13 16 0
40% or more 0 0 3 5
total 12 48 27 5
Table 3. The precision analysis in vegetation coverage area
error Bare soil area Vegetation coverage area All samples
Completely right 61 65 126
Discrepancy of one grade 28 22 50
Discrepancy of two grade 8 5 13
Discrepancy of three grade 1 0 1
Discrepancy of four grade 0 0 0
total 98 92 190
Table 4. The overall analysis of classification The overall precision for classification, presented in Tab 4, is
66.3%, and the accuracy is significantly higher in bare soil area than it in vegetation coverage area. If the discrepancy within one grade was considered to be acceptable, the precision is as high as 92.6%. Therefore, the algorithm in this article is comparatively accurate in extraction of the information of soil moisture.
5. CONCLUSION
A Maximum Likelihood classifier based on integration of TM and ASAR data is presented to extract the information of soil moisture. In the algorithm the wavelet and IHS transform are combined to integrate TM3, TM4, TM5 and ASAR data. Then the new R, G, B components in the fusion image and the TM6 are taken as the input to the Maximum Likelihood classification, and the output corresponds to five different categories determined by different grades of soil moisture. From the validation by field measurements, the following conclusions can be made:
1) The fusion algorithm combined wavelet and IHS transform can not only increase the information and definition of the images integrated, but also improve the sensitivity of images to the information of soil moisture. This can be an effective approach to obtain the information of soil moisture.
2) The Maximum Likelihood classification based on fusion of both active and passive remote sensing data can be well used to obtain the distribution of soil moisture in some areas.
3) Although the method proposed in this paper can only extract the regional distribution of soil moisture, it cannot calculate the exact value of soil moisture. The method is easy and practical to apply, without any complicated physical processes. Only some field measurements of soil moisture are needed to support the method, and no other ground ancillary data are required in addition. This paper presents a new method to effectively and quickly acquire the information of soil moisture in a certain region. Revised November 2012
REFERENCES
J. R. Li, S. F. Huang. The application of 3S technologies in water conservancy. China Water Power Press, Beijing, 2003 J. K. Wu, Y J Ding, Y P Shen, et al. “Experimental study on evapotranspiration of swampy meadow in the middle reach of Heihe River”. Journal of Glaciology and Geocryology, 27(4), 582-589, 2005.
J. C. Price. Thermal inertia mapping: a new view of the earth. J Geo Phys Res, 1977.
F. Kogan. “Remote sensing of weather impacts on vegetation in non-homogeneous areas”. International Journal of Remote Sensing. 11(8), 1405-1419, l990.
M. S. Moran, T. R. Clarke, Y. Inoue, et al. “Estimating crop water deficit using the relation between surface-air temperature and spectral vegetation index”. Remote Sensing of Environment, 49(3), 246-263, 1994.
Y. S. Zhao. Principles and methods of remote sensing. Science Press, Beijing, 2003.
S. G. Mallat. “A theory for multi-resolution signal decomposition: The wavelet representation”. IEEE Transactions Pattern Analysis Machine Intelligence. 11(7), 674-693, 1989 Harris, R. Jeff, R. Murray, et al. “HIS transformation for the integration of radar imagery with other remotely Sensed data”. PE&RS, 56(12), 1631-1634, 1990.
ACKNOWLEDGEMENTS
The experiment is jointly supported by the auspices of National Natural Science Foundation for Young Scientists of China (No. 41101321), China State Key basic Research Project (grant number: 2013CB733400), the Key Projects in the National Science & Technology Pillar Program (Grant No: 2012BAH28B03), Open Basic Research Plan of Key Laboratory of Geo-Informatics of National Administration of Surveying, Mapping and Geoinformation (Grant No: 777131403)