www.elsevier.comrlocateratmos
Case studies of spectral atmospheric transmittance
in the ultraviolet and visible regions in
Athens, Greece
II. Aerosol transmittance
H.D. Kambezidis
a,), A.D. Adamopoulos
a, D. Zevgolis
b,1a
Atmospheric Research Team, Institute of EnÕironmental Research and Sustainable DeÕelopment, National ObserÕatory of Athens, P.O. Box 20048, GR-11810 Athens, Greece
b
Department of Physics, UniÕersity of Patras, GR-26500 Patras, Greece
Received 6 August 1999; accepted 16 March 2000
Abstract
This work accounts for an investigation about the diurnal variation of aerosol spectral transmittance of solar irradiance under dominant wind conditions as case studies. Such a work is carried out in Athens for first time. The spectral transmittance values estimated were derived using
Ž .
ground-based spectral measurements of beam irradiance in the range 310–575 nm UV and VIS . The data were recorded by a system consisting of an automatic solar tracker and a spectrometer. All data were recorded under clear-sky conditions in the city center of Athens and the aerosol spectral transmittance was estimated towards zenith to avoid optical mass effects. The comparison reveals that the aerosol transmittance is higher under the influence of strong Etesian compared to sea-breeze conditions. The influence of low-pressure systems also plays a depollution role in the basin. Various features of diurnal variation are discussed with respect to emission sources, topographic peculiarities and wind pattern.q2000 Elsevier Science B.V. All rights reserved.
Keywords: Spectral solar beam irradiance; Aerosol spectral transmittance
)Corresponding author. Tel.:q30-1-3490119; fax:q30-1-3490140.
Ž . Ž .
E-mail addresses: [email protected] H.D. Kambezidis , [email protected] D. Zevgolis . 1
Tel.:q30-61-997475; fax:q30-61-997911.
0169-8095r00r$ - see front matterq2000 Elsevier Science B.V. All rights reserved.
Ž .
1. Introduction
Aerosols exhibit spatial and temporal variations in urban environments like Athens area. Scientific interest has focused on the evaluation of atmospheric turbidity, a measure of the aerosol load in the atmosphere. Various turbidity definitions have been
Ž .
proposed such as the Linke turbidity factor, TL Linke, 1922; 1929 , the Unsworth–
˚
Ž .
Monteith turbidity factor, TU Unsworth and Monteith, 1972 , the Angstrom turbidity
¨
˚
Ž . Ž .
parameters, a and b Angstrom, 1929 , the Schuepp coefficient B, Schuepp, 1949 ,
¨
¨
¨
Ž .
and the horizontal visibility V McClatchey and Selby, 1972 . Many studies dealing Ž
with aerosol optical properties appear in the literature e.g. Louche et al., 1987; Kocifaj, 1994; Bokoye et al., 1997; Schmid et al., 1997; Tomasi et al., 1997; Devara, 1998;
.
Kambezidis et al., 1998b; Jacobson, 1999 . Some of those appear as spectral narrowband Ž
studies e.g. McCartney and Unsworth, 1978; Cachorro et al., 1987; Lorente et al., 1994; .
Adeyefa et al., 1997; Kambezidis et al, 1997b; Marenco et al., 1997 . Furthermore, a
Ž .
variety of atmospheric aerosols absorbing solar radiation are known Jacobson, 1999 . The necessity in estimating the total atmospheric transmittance is discussed in the
Ž .
companion paper Kambezidis et al., 2000 . In addition, the effect of wind regime on the above quantity is studied. Here, an attempt is made to model the extinction of solar irradiance, taking into account various attenuation processes and constituents.
Ž .
Starting with Leckner 1978 , the total atmospheric transmittance was analyzed as a product of partial transmittance functions due to various atmospheric constituents considering Rayleigh scattering, absorption by ozone, water vapor and mixed gases as well as aerosol scattering. However, there was a special need to include nitrogen dioxide, the contribution of which to the extinction procedure is very significant in
Ž .
polluted areas. Therefore, Gueymard 1995 added one more term in his spectral radiative code SMARTS2, the transmittance function due to atmospheric NO .2
2. Methodology
In this study, we use the spectral measurements of solar beam irradiance taken by Ž
PPS on the same selected days as described in the companion paper Kambezidis et al.,
. Ž .
2000 . Based on SMARTS2 algorithm proposed by Gueymard 1995 , a new radiative
Ž .
transfer model was first developed by Kambezidis et al 1997a . This calculates spectral radiative properties such as atmospheric optical thickness and transmission and also
Ž
estimates atmospheric constituents such as O3 and NO2 Kambezidis et al., 1996, .
1997a . Ground-based multispectral measurements of direct solar irradiance are required as input values to the model. Such measurements were performed every 30 min in the spectral range 310–575 nm with a resolution of about 0.5 nm.
Ž . Ž .
The total spectral atmospheric transmittance, t l,uz in the sun-sensor direction , considering single scattering, can be written as follows:
t l
Ž
,uz.
sHŽ
l,uz.
rHoŽ .
l SŽ .
1Ž . y2 Ž
where H l,uz is the measured beam irradiance calibrated in W m a function of
. Ž .
Ž . Ž
Gueymard 1995 , and S is the correction factor for the sun–earth distance Kambezidis .
et al., 1997a .
Ž . XŽ .
The spectral optical thickness towards zenith , d l , is determined from the equation:
X
d
Ž
l,uz.
s1rm ln 1rt lŽ
,uz.
Ž .
2where m stands for the atmospheric optical mass.
Ž . X
The total spectral transmittance function towards zenith with ms1 , t, is, there-fore, given by the following equation:
X X
t
Ž
l,uz.
sexp ydŽ
l,uz.
.Ž .
3To model the atmospheric transmittance in any spectral range, six individual atmo-spheric processes are considered here: Rayleigh scattering, absorption by ozone,
nitro-Ž .
gen dioxide, uniformly mixed gases such as CO , O , water vapor as well as aerosol2 2
extinction. Their respective spectral transmittance functions are denoted tr, to, tn, tg,
tw, andta. Within narrow spectral regions, these atmospheric processes can be consid-ered independent of each other, so that the total transmittance function can be derived as
Ž
the product of these individual spectral transmittance functions Kambezidis et al., .
1997a,1998a; Gueymard, 1995 . Thus:
t l
Ž
,uz.
st lrŽ
,u tz. Ž
o l,u t lz. Ž
n ,u tz. Ž
g l,u tz.
wŽ
l,u t lz. Ž
a ,uz.
.Ž .
4Ž .
For each ith atmospheric extinction process isr, o, n, g, w, a mentioned above, the transmittance function ti can be written in terms of optical thickness di, and the optical mass m , as follows:i
tisexp
Ž
ymidi.
.Ž .
5Ž .
According to Eq. 5 the atmospheric transmittance due to Rayleigh scattering is retrieved as follows:
t lr
Ž
,uz.
sexp ymŽ . Ž .
u d lz rŽ .
6Ž .
where the molecular optical thickness is calculated from Leckner 1978 :
d l
Ž .
s0.008735ly4 .08.Ž .
7 rThe units of l in all the expressions are microns. The relative optical air mass, mX, for standard pressure P0s1013.25 hPa at sea level, is calculated from Gueymard Ž1995 :.
y1
y1 .697
X 0 .07
m
Ž .
uz s cosuzq0.45665uzŽ
96.4836yuz.
Ž .
8where uz is in degrees. The pressure corrected air mass, m, is calculated from:
msmXPrP , where P is the measured surface pressure in hPa.0
Ž .
The water vapor transmittance and air mass are after Gueymard 1995 :
c 1 .05 n
where the atmospheric mass due to water vapor is calculated from:
RH is the relative humidity in % , e is the saturation water vapor in hPa calculateds
Ž .
from Gueymard 1994 :
esexp 22.329699
Ž
y49.140396Ty1y10.921853Ty2y0.39015156T.
Ž
12.
s o o o
Ž .
with TosTr100, T being the absolute air temperature in K
fsA 0.394y0.26946lq
Ž
0.46478q0.23757l. Ž
PrP0.
Ž
13.
is a pressure scaling factor that compensates for inhomogeneities in the water vapor path length according to the Curtis–Godson approximation, and:
As1 forl-670 nm. In addition:
ns0.88631q0.025274ly3.5949exp
Ž
y4.5445l.
Ž
14.
cs0.53851q0.003262lq1.5244exp
Ž
y4.2892l.
.Ž
15.
The correction factor B takes into account the variation of the absorption with distance from the band center:
k being the water vapor absorption coefficient, in cmy1. w
Since mixed gases possess no absorption lines in the spectral range under considera-tion, the respective formulas are not taken into account here.
The transmittance function due to absorption by NO is:2
tnsexp
Ž
yk l mn n n.
,Ž
18.
where l is the total column of NO in the atmosphere. The corresponding atmosphericn 2
Ž .
mass is calculated from Gueymard 1995 :
y1
y3 .4536 0 .5
mn
Ž .
uz s cosuzq602.3uzŽ
117.96yuz.
.Ž
19.
Ž .
The corrected absorption coefficient is calculated from the data of kn l, Tn via the
Ž .
where kn l,Tr is the absorption coefficient for the reference temperature of Trs243.2 Ž
K, Tasa0qa T,l a0s332.41 K, als y0.34467 for summer and a0s142.68 K, .
als0.28498 for winter . The coefficients f are: fi 0s 0.69773, f1s y8.1829, f2s
37.821, f3s y86.136, f4s96.615, f5s y42.635 for l-625 nm. The atmospheric transmittance due to O absorption is calculated from:3
to
Ž
l,uz.
sexp ykoŽ
T ,l.
l mo o .Ž
21.
Ž .
l is the total ozone column in atm-cm calculated as in Kambezidis et al. 1997a .o
Ž .
The ozone air mass is calculated from Gueymard 1995 :
y1
y3 .2922 0 .5
mo
Ž .
uz s cosuzq268.45uzŽ
115.42yuz.
.Ž
22.
The temperature-dependent absorption coefficients, k , are calculated from:o
2 y1
ko
Ž
l,T.
smax 0, k oŽ
l,Tr.
qC T1Ž
eyTr.
qC2Ž
TeyTr.
4
, in cmŽ
23.
Ž
where Tesa0qa Tl a0s332.41 K, als y0.34467 for summer and a0s142.68 K,
. Ž .
als0.28498 for winter , T K is the temperature at which the ozone absorption coefficient is to be estimated. The constants C and C are:1 2
C s
Ž
0.39626y2.3272lq3.4176l2.
for 310-l-344 nmŽ
24a.
If the calculations are made for optical masses, mis1, the individual spectralŽ X
.
transmission functions ti are derived in the direction towards zenith, and therefore, are Ž . independent of the solar elevation angles at the times of the measurements. Thus, Eq. 4 can also be written as:
tX
Ž .
l strXŽ . Ž . Ž . Ž .
l toX l tnX l tgX l twXŽ . Ž .
l taX l .Ž
26.
Making the aerosol transmittance subject of the formula, we can estimate this parameter:
X X X X X X X
ta
Ž .
l stŽ .
l r trŽ . Ž . Ž . Ž .
l to l tn l tg l twŽ .
l .Ž
27.
3. Results and discussion
Ž To highlight the influence of wind regime on aerosol transmittance values
Adamo-. Ž
poulos et al., 1998 , we present case studies during a pure-sea-breeze day 20th May
. Ž . Ž
1997 , a pure Etesian day 5th September 1997 , a day with competing wind flows 1st
. Ž .
July 1997 and a day under the influence of a low-pressure system 11th July 1997 .
Ž .
Details are discussed in the companion paper Kambezidis et al., 2000 .
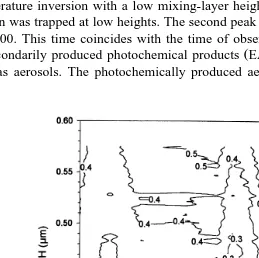
During the 20th of May 1997, the synoptic wind flow was very weak thus favoring the development of a sea-breeze cell. The calculated transmittances due to aerosols are shown in Fig. 1. These are very low because of the appearance of an air-pollution episode. The results are supported by high levels of ground-based air-pollutant
measure-Ž .
ments performed on a 24-h basis by the Greek Ministry of Environment EARTH, 1998 and are consistent with the reduction in visibility observed in the city center. As for the
Ž .
diurnal variation of the aerosol transmittance Fig. 1 , the morning peak of aerosol load Ž
centered at 9:00 coincides with the rush hour of the city Kambezidis et al., 1995; .
EARTH, 1998 . This is due to automobile-originated aerosols since this peak appears mainly in the VIS. The weak synoptic wind flow favored the appearance of a temperature inversion with a low mixing-layer height. As a result, a substantial aerosol burden was trapped at low heights. The second peak in aerosol concentration is observed at 13:00. This time coincides with the time of observation of maximum concentrations
Ž .
of secondarily produced photochemical products EARTH, 1998 which are considered here as aerosols. The photochemically produced aerosols should be the cause for this
peak, since this is observed throughout the considered spectral range. However, soil- and Ž
marine-originated aerosols must be present in the ambient air as well Scheff and .
Valiozis, 1990; Eleftheriadis et al., 1998 . After 15:00, aerosol transmittance rapidly improves. This is explained by the fact that aerosols are swept by sea-breeze northwards. This is also supported by the results of other studies that showed high levels of secondary-photochemical-pollutant concentrations at the foothills of Mts Parnitha and
Ž .
Penteli in the early afternoon hours Suppan et al., 1998 . There, a convergence zone develops and large air masses are lifted at an altitude from where they can take part in a
Ž .
long-range transport by the synoptic wind flow Klemm et al., 1998 . Furthermore, the relatively high transmittances observed over 500 nm compared to those at shorter wavelengths in the late afternoon hours indicate that the basin may contain a large
Ž .
quantity of marine aerosols Vaxelaire et al., 1991; Eleftheriadis et al., 1998 .
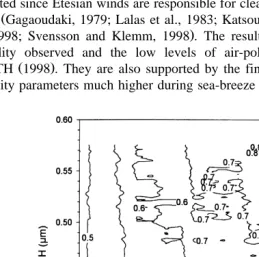
In sharp contrast, the aerosol transmittances calculated during the 5th of September
Ž .
1997 obtain much higher values Fig. 2 . This day was characterized by a relatively strong Etesian wind flow with speeds varying in the range 4.5–6.8 m sy1
. This was expected since Etesian winds are responsible for cleansing the atmosphere of the Athens
Ž
basin Gagaoudaki, 1979; Lalas et al., 1983; Katsoulis, 1988; Ziomas, 1998; Suppan et .
al., 1998; Svensson and Klemm, 1998 . The results are in accordance with the high visibility observed and the low levels of air-pollutant concentrations recorded by
Ž .
EARTH 1998 . They are also supported by the findings of another work that derived turbidity parameters much higher during sea-breeze days than those under the existence
Ž .
of strong Etesians Kambezidis et al., 1998b . Furthermore, a fair peak in aerosol load is observed in the morning due to traffic circulation. As the day progresses, the aerosol transmittance becomes higher and higher eventually reaching the value of 0.9 in the late afternoon. Moreover, aerosol transmittance turns out to be almost independent of the wavelength. This means that aerosols deplete solar irradiance almost equally throughout UV and VIS indicating a homogeneous atmosphere over Athens with respect to aerosols, due to the strong synoptic forcing.
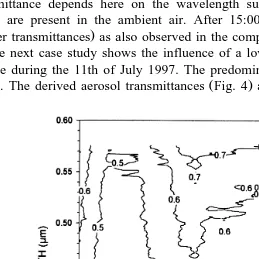
During the 1st of July 1997, a high-pressure system centered over Italy. The resultant wind flow was a combination of both Etesian wind forcing and sea-breeze circulation. Fig. 3 presents the aerosol transmittance having characteristics of both previous two
Ž .
wind regimes Figs. 1 and 2 as also found for total transmittance in the companion paper. The values derived are moderate and are comparable to those of pure-Etesian day in some cases. A peak in aerosol load is still observed in the morning due to increased anthropogenic emissions. The midday peak is not well pronounced as in the companion paper, too. In addition, unlike the findings during the pure-Etesian day, the aerosol transmittance depends here on the wavelength suggesting that aerosols of different origin are present in the ambient air. After 15:00, the atmosphere becomes cleaner Žhigher transmittances as also observed in the companion paper..
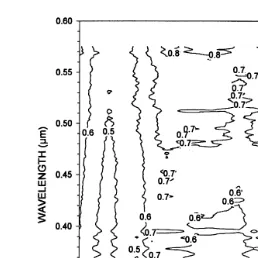
The next case study shows the influence of a low-pressure system situated north of Greece during the 11th of July 1997. The predominant wind direction was from the S
Ž .
sector. The derived aerosol transmittances Fig. 4 are much higher compared to those
Fig. 4. As in Fig. 1 but for the 11th of July 1997.
Ž .
obtained during the sea-breeze day Fig. 1 and in some cases, comparable to those
Ž .
calculated during the Etesian day Fig. 2 . A peak in atmospheric aerosol burden is observed at around 8:30 in the morning as found in all cases examined, suggesting that traffic is its origin. In the late afternoon hours, the cleansing effect of this low barometric system is more obvious. The peak in air pollution observed in the afternoon in the companion paper, is only found here in the VIS. We can invoke sea-spray transport as the cause.
4. Concluding remarks
The contribution of aerosols to the air-pollution of the Athens basin can be estimated from ground-based spectral measurements of solar beam irradiance using a radiative transfer model.
An atmospheric aerosol burden is observed in the morning under all examined wind regimes and coincides with the rush hour of the city. Nevertheless, various wind regimes cause different diurnal variations of spectral aerosol transmittance due to the various pollution sources involved, climatic and topographic peculiarities of the Athens basin.
References
Adamopoulos, A.D., Kambezidis, H.D., Zevgolis, D., Topalis, F.B., Djepa, V., 1998. In: Goetzberger, A.,
Ž .
Krainer, A. Eds. , Variability of total optical thickness over Athens, Greece. Proc. EuroSun98 2nd ISES Europe Solar Congress, 14–17 September, Portoroz, Slovenia. Franklin Company Consultants, Birming-ham, UK, pp. I.1.2.1–I.1.2.7.
Adeyefa, Z.D., Holmgren, B., Adedokun, J.A., 1997. Spectral solar radiation measurements and turbidity: comparative studies within tropical and a sub-arctic environment. Solar Energy 60, 17–24.
˚
Angstrom, B., 1929. On the atmospheric transmission of sun radiation and on dust in the air. Geogr. Ann. 11,¨
156–166.
˚
Bokoye, A.I., de La Casiniere, A., Cabot, T., 1997. Angstrom from turbidity parameters and aerosol optical¨
thickness: A study over 500 solar beam spectra. J. Geophys. Res. 102, 21905–21914.
˚
Cachorro, V.E., Casanova, J.L., de Frutos, A.M., 1987. The influence of Angstrom parameters on calculated¨
direct solar spectral irradiances at high turbidity. Solar Energy 39, 399–407.
Devara, P.C.S., 1998. Remote sensing of atmospheric aerosols from active and passive optical techniques. Int. J. Remote Sens. 19, 3271–3288.
EARTH, 1998. The Atmospheric Pollution in Athens-1997. Bulletin of the Ministry of Environment, Physical
Ž .
Planning and Public Works, in Greek .
Eleftheriadis, K., Balis, D., Ziomas, I.C., Colbeck, I., Manalis, N., 1998. Atmospheric aerosol and gaseous species in Athens, Greece. Atmos. Environ. 32, 2183–2191.
Gagaoudaki, H., 1979. Surface wind as a climatological factor affecting transportation and dispersion of
Ž .
pollutants in Athens area. National Meteorological Service, Athens, 7, in Greek .
Gueymard, C., 1994. Analysis of monthly average atmospheric precipitable water and turbidity in Canada and Northern United States. Solar Energy 53, 57–71.
Ž .
Gueymard, C., 1995. Simple model of the atmospheric radiative transfer of sunshine SMARTS2 : algorithms w
and performance assessment., FSEC-PF-270-95. Florida Solar Energy Center, Florida, Available online x
from ftp:rralpha.fsec.ucf.edurpublicrsmarts2r.
Jacobson, M.Z., 1999. Isolating nitrated and aromatic aerosols and nitrated aromatic gases as sources of
Ž .
ultraviolet light absorption. J. Geophys. Res., in press .
Kambezidis, H.D., Tulleken, R., Amanatidis, G.T., Paliatsos, A.G., Asimakopoulos, D.N., 1995. Statistical evaluation of selected air pollutants in Athens, Greece. Environmetrics 6, 349–361.
Kambezidis, H.D., Sakellariou, N.K., Topalis, F.B., Kanellias, A.A., Petrova, V.D., 1996. Air Pollution Monitoring with a Passive Pyrheliometric Scanner. Fres. Environ. Bull. 5, 631–636.
Kambezidis, H.D., Petrova, V.D., Adamopoulos, A.D., 1997a. Radiative Transfer. I. Atmospheric transmission monitoring with modeling and ground-based multispectral measurements. Appl. Optics 36, 6976–6982. Kambezidis, H.D., Petrova, V.D., Adamopoulos, A.D., 1997b. Radiative Transfer. II. Impact of meteorological
variables and surface albedo on atmospheric optical properties retrieved from ground-based multispectral measurements. Appl. Optics 36, 6983–6988.
Kambezidis, H.D., Adamopoulos, A.D., Djepa, V., Zevgolis, D., Topalis, F.B., 1998a. A radiative model based on multispectral solar direct radiation measurements. In: Pepper, D.W., Brebbia, C.A., Zannetti, P.
ŽEds. , Proc. Envirosoft98 7th International Conf. on Development and Application of Computer Tech-.
niques to Environmental Studies, 10–12 November, Las Vegas, Nevada, USA. WITPRESS, Boston, Southampton, pp. 89–98.
Kambezidis, H.D., Adamopoulos, A.D., Zevgolis, D., 2000. Case studies of spectral atmospheric transmittance
Ž
in the ultraviolet and visible regions in Athens, Greece. I: Total transmittance. Atmos. Res., companion
.
paper in this issue .
Katsoulis, B.D., 1988. Some Meteorological Aspects of Air Pollution in Athens, Greece. Meteorol. Atmos. Phys. 39, 203–212.
Klemm, O., Ziomas, I.C., Balis, D., Suppan, P., Slemr, J., Romero, R., Vyras, L., 1998. A summer air-pollution study in Athens, Greece. Atmos. Environ. 32, 2071–2087.
Kocifaj, M., 1994. Solving the diffusion of solar radiation in the atmosphere and identifying the aerosol structure. Atmos. Environ. 28, 777–783.
Lalas, D.P., Asimakopoulos, D.N., Deligiorgi, D.G., Helmis, C.G., 1983. Sea-breeze circulation and photo-chemical pollution in Athens, Greece. Atmos. Environ. 17, 1621–1632.
Leckner, B., 1978. The spectral distribution of solar radiation at the earth’s surface — Elements of a model. Solar Energy 20, 143–150.
Linke, F., 1922. Transmission koefficient und trubungsfactor. Beitr. Phys. Frei Atmos. 10, 91.
Linke, F., 1929. Messungen der sonnenstrahlung beivier freiballonfahrten. Beitr. Phys. Frei Atmos. 15, 176. Lorente, J., Redano, A., de Cabo, X., 1994. Influence of urban aerosol on spectral solar irradiance. J. Appl.
Meteorol. 33, 406–415.
Louche, A., Maurel, M., Simonnot, G., Peri, G., Iqbal, M., 1987. Determination of Angstrom’s turbidity coefficient from direct total solar irradiance measurements. Solar Energy 38, 89–96.
Marenco, F., Santacesaria, V., Bais, A.F., Balis, D., di Sarra, A., Papayannis, A., Zerefos, C., 1997. Optical
Ž
properties of tropospheric aerosols determined by Lidar and spectrophotometric measurements
Photo-.
chemical Activity and Solar Ultraviolet Radiation campaign . Appl. Optics 36, 6875–6886.
McCartney, H.A., Unsworth, M.H., 1978. Spectral distribution of solar radiation. I.: direct radiation. Q. J. R. Meteorol. Soc. 104, 699–718.
McClatchey, R.A., Selby, J.E., 1972. Atmospheric transmittance from 0.25 to 38.5 mm: Computer code LOWTRAN-2. Rep. AFCRL-72-0745, Environ. Res. Pap. 427, Air Force Cambridge Res. Lab., Hanscom Air Force Base, Mass.
Scheff, P.A., Valiozis, C., 1990. Characterization and source identification of respirable particulate matter in Athens, Greece. Atmos. Environ. 24, 203–211.
Schmid, B., Matzler, C., Heimo, A., Kampfer, N., 1997. Retrieval of optical depth and particle size distribution of tropospheric and stratospheric aerosols by means of sun photometry. IEEE Trans. Geosci. Remote Sens. 35, 172–182.
Schuepp, W., 1949. Arch. Meteorol. Geophys. Biokl. B 1, 257.¨
Suppan, P., Fabian, P., Vyras, L., Gryning, S.E., 1998. The Behaviour of ozone and peroxyacetylo nitrate concentrations for different wind regimes during the MEDCAPHOT-TRACE campaign in the greater Athens area of Athens, Greece. Atmos. Environ. 32, 2089–2102.
Svensson, G., Klemm, O., 1998. Aircraft measurements and model simulations of the air quality in Athens, Greece. Atmos. Environ. 32, 2269–2289.
Tomasi, C., Vitale, V., Tarozzi, L., 1997. Sun-photometric measurements of atmospheric turbidity variations caused by the Pinatubo aerosol cloud in the Himalayan region during the summer periods of 1991 and 1992. Nuovo Cimento 20, 61–88.
Unsworth, M.H., Monteith, J.L., 1972. Aerosol and solar radiation in Britain. Q. J. R. Meteorol. Soc. 98, 778–797.
Vaxelaire, P., Leveau, J., Menguy, G., Baldy, S., 1991. Ground-level spectral distribution of solar direct-nor-mal irradiance and marine aerosol attenuation coefficients at Reunion Island. Solar Energy 47, 189–196. Ziomas, I.C., 1998. The Mediterranean campaign of photochemical tracers — Transport and chemical
Ž .