David C. Steffens, Christopher E. Byrum, Douglas R. McQuoid,
Daniel L. Greenberg, Martha E. Payne, Timothy F. Blitchington,
James R. MacFall, and K. Ranga Rama Krishnan
Background:
There is a growing literature on the
impor-tance of hippocampal volume in geriatric depression.
Methods:
We examined hippocampal volume in a group
of elderly depressed patients and a group of elderly
control subjects (
N
5
66 geriatric depressed patients and
18 elderly nondepressed control subjects) recruited
through Duke’s Mental Health Clinical Research Center
for the Study of Depression in the Elderly. The subjects
received a standardized evaluation, including a magnetic
resonance imaging scan of the brain. Patients had
unipo-lar major depression and were free of comorbid major
psychiatric illness and neurologic illness. Differences
were assessed using
t
tests and linear regression
modeling.
Results:
Accounting for the effects of age, gender, and
total brain volume, depressed patients tended to have
smaller right hippocampal volume (
p
5
.014) and left
hippocampal volume (
p
5
.073). Among depressed
pa-tients, age of onset was negatively but not significantly
related to right hippocampal volume (
p
5
.052) and to left
hippocampal volume (
p
5
.062). We noted that among
subjects with either right or left hippocampal volume of 3
mL or less, the vast majority were patients rather than
control subjects.
Conclusions:
These results support a role for
hippocam-pal dysfunction in depression, particularly in late-age
onset depression. Longitudinal studies examining both
depressive and cognitive outcomes are needed to clarify
the relationships between the hippocampus, depression,
and dementia.
Biol Psychiatry 2000;48:301–309 ©
2000
Society of Biological Psychiatry
Key Words:
Depression, hippocampus, magnetic
reso-nance imaging
Introduction
T
he role of the hippocampus in mood disorders is
unclear. There are known neural connections between
the hippocampal formation and frontal and limbic areas
that are implicated in development of depressive
symp-toms, but how and to what extent the hippocampus may
modulate mood and the pathophysiology of the stress
response is not understood (McEwen 1997; Mongeau et al
1997). Neuroimaging, particularly magnetic resonance
imaging (MRI), has been used to study the hippocampus in
populations of patients with mood disorders (Axelson et al
1993; Coffey et al 1993; Krishnan et al 1991; O’Brien et
al 1997; Sheline et al 1996). These studies have yielded
conflicting results.
Focusing on hippocampal changes in geriatric
depres-sion allows investigators to test two major hypotheses
regarding age of first onset of depression and smaller
hippocampal volumes among elderly depressives. One
hypothesis follows the stress-induced glucocorticoid
tox-icity model (McEwen 1997; Sapolsky 1993), which links
the finding of hypothalamic-pituitary-adrenal axis
dyscon-trol leading to higher cortisol levels in depression (Carroll
et al 1981a) to subsequent glucocorticoid-induced
hip-pocampal damage (Sheline 1996). In this model, greater
length of time of depressive symptoms would predict
greater hippocampal damage. Thus, older patients with
earlier first onset of depressive symptoms should have
smaller hippocampal volumes compared with those with
later first onset of depression.
The other hypothesis follows the observation
(con-firmed by our own clinical experience) that late-onset
depression often precedes onset of dementia, particularly
Alzheimer’s disease (Jorm et al 1991; Kokmen et al 1991;
Speck et al 1995; Steffens et al 1997), which is itself
associated with hippocampal degeneration (Jack et al
1998; Laasko et al 1998). Here, a depressive syndrome
may represent the heralding sign of incident dementia, and
thus we would expect that certain individuals with
late-onset depression would have smaller hippocampal
vol-umes. Complicating hypothesis linking geriatric with
Alz-heimer’s disease is another large body of literature linking
late-onset depression with vascular brain changes
(Krish-From the Departments of Psychiatry and Behavioral Sciences (DCS, CEB, DRM, DLG, MEP, TFB, KRRK) and Radiology (JRM), Duke University Medical Center, Durham, North Carolina.
Address reprint requests to David C. Steffens, M.D., Assistant Professor of Psychiatry, Duke University Medical Center, Box 3903, Durham NC 27710. Received September 3, 1999; revised February 1, 2000; accepted February 7, 2000.
nan et al 1997; Soares and Mann 1997); this evidence
would suggest that cognitive decline may be a vascular
phenomenon,
possibly
with
limited
hippocampal
involvement.
Both hypotheses would thus predict smaller
hippocam-pal volumes in depressed patients versus control subjects
regardless of age of onset. If both hypotheses prove true,
then the effect of age of onset on hippocampal volume will
be determined by the relative effects of each condition,
and it is possible that one may not find any differences
when comparing early-onset with late-onset depressed
patients. Similarly, there will be no effect of age of onset
if neither model is operative. Yet it is also possible to
formulate hypotheses depending on the sample. If
late-onset depression predominates, then a significant negative
association between age of onset and hippocampal volume
may exist. Such is the case with our sample. Thus, we
predicted the following: 1) older depressed patients will
have smaller hippocampal volumes than will
nonde-pressed elderly control subjects and 2) hippocampal
vol-ume will be negatively correlated with age of onset among
the depressed group.
We sought to examine these issues in a heterogeneous
group of geriatric depressives and elderly nondepressed
controls.
Methods and Materials
Design and Sample
This study used a cross-sectional design. All subjects were participants in the NIMH Mental Health Clinical Research Center (MHCRC) for the Study of Depression in Later Life, located at Duke University, who were screened with the Center for Epidemiologic Studies-Depression Scale (CES-D; Radloff 1977). Control subjects were obtained from the Duke Aging Center Registry of elderly volunteers (60 years and older) who were free of psychiatric and neurologic illness. After complete description of the MHCRC and its procedures were explained to each subject, written informed consent was obtained.
Eligibility for patients was limited to those with CES-D scores
$16 or a diagnosis of major depression, single (incident cases) or recurrent (prevalent cases), and was restricted to patients aged 58 years or older who could speak and write English. Exclusion criteria included 1) another major psychiatric illness, such as bipolar disorder, schizophrenia, and schizoaffective disorder; 2) active alcohol or drug dependence; 3) primary neurologic illness, such as dementia, stroke, Parkinson’s disease, seizure disorder, or multiple sclerosis; 4) presence of a medical illness or medi-cation use that could affect cognitive function; 5) physical disability that precludes cognitive testing; and 6) metal in the body that precludes MRI. The MHCRC is particularly careful to assess subjects for dementia; all subjects have a clinical exami-nation by a geriatric psychiatrist, and all subjects with known or suspected dementia are excluded from the MHCRC.
At baseline, all subjects underwent a standardized section of
the MRI study (see MRI method section below). Within 60 days of the MRI, a trained interviewer administered the Duke Depres-sion Evaluation Schedule (DDES) to each enrolled subject. The DDES, a composite diagnostic interview instrument, includes sections of the NIMH Diagnostic Interview Schedule (Robins et al 1981) assessing depression (enriched with items assessing sleep problems and the clinical features of melancholia and psychosis), dysthymia, mania, and alcohol abuse or dependence. The DDES also includes the Montgomery–Asberg depression rating scale (Montgomery et al 1979), the Mini-Mental State Examination (MMSE; Folstein et al 1975), items assessing self-reported physical health, four subscales of the Duke Social Support Index (George et al 1989; Landerman et al 1989), and a section assessing frequency and severity of stressful life events during the year preceding the interview (Landerman et al 1989). Other clinical data, including the Carroll Rating Scale for Depression (Carroll et al 1981b), Hamilton Rating Scale for Depression (Hamilton 1960), Consortium to Establish a Registry for Alzheimer’s Disease test battery (Morris et al 1988), Hachin-ski Ischemia Scale (HachinHachin-ski et al 1975), Global Assessment Scale (Endicott et al 1976), and Cumulative Illness Rating Scale (Linn et al 1968) also were assessed at baseline.
DSM-IV diagnoses were assigned to all subjects by a consen-sus diagnostic conference, which included a board-certified or board-eligible psychiatrist, using procedures conforming to the Longitudinal, Expert and Available Data standard (Spitzer 1983) and informed by screening data, the DDES, and the clinical data listed above. Concordance between the consensus diagnoses and other diagnostic tests was moderate to high (George et al 1989).
Magnetic Resonance Imaging
MRI ACQUISITION. All subjects were screened for the presence of cardiac pacemakers, neurostimulators, metallic im-plants, metal in the orbit, aneurysm clips, or any other condition where MRI is contraindicated. Subjects were imaged with a 1.5 T whole-body MRI system (GE Medical Systems, Waukesha, WI) using the standard head (volumetric) radiofrequency coil. The scanner alignment light was used to adjust the head tilt and rotation to ensure the median was the canthomeatal line.
HIGH-RESOLUTION IMAGING FOR VOLUME MEASURE-MENT. Two dual-echo fast-spin echo acquisitions were ob-tained: one in the axial plane for morphometry for most cortical structures and a second (fast spin echo) in a coronal oblique plane for segmentation of the amygdala-hippocampus complex. The pulse sequence parameters were: TR54000 msec, TE5
30, 135 msec, 32 KHz imaging bandwidth, echo train length5
were then prescribed perpendicular to this line, covering the entire brain from just anterior to the front of the temporal lobe to posterior to the ventricles.
MR IMAGE PROCESSING. MrX Procedure (for Whole Brain) The basic segmentation protocol is a modified version of that developed by Kikinis et al (1992) and has been described previously (Byrum 1996). Gray and white contrast is often poor in MR scans of the elderly. Our seeding protocol, which identified the range of signal intensities that characterize each tissue type, was altered to address this problem. Gray matter points were selected by moving the cursor from regions of cerebrospinal fluid (CSF) on the outside of the brain to adjacent cortical gray areas while observing a two-dimensional scatter plot showing the image intensity for echo 1 graphed against the image intensity for echo 2. This eliminated the need to distin-guish the cortical gray regions from white matter, which can be nearly isointense on some scans. When the cursor first enters the cortical gray region, the location of the point in the scatter plot changes distinctly, thus identifying the gray matter region. Points for white matter seeding were selected from the anterior and posterior corpus callosum, as well as the central region of white matter tracts in each quadrant. The rationale was to exclude points that were anywhere near gray matter, and therefore least likely to be gray matter.
Once the brain was segmented into tissue types and the nonbrain tissue stripped away through a masking procedure, specific regions of interest (ROI) were assessed using tracing and connectivity functions. The cerebral hemispheres and caudate nuclei were traced and a mask was created that could be applied to the segmented brain. A connectivity function was used for quantifying the lateral ventricles.
The final step was to run a summarizing program that calculated the volume of each tissue type within the specific ROI. Volume was determined for the whole brain.
Grid Procedures (for Hippocampus) The Grid Program (developed by one of the authors, TFB) was used to quantify the left and right putamen and hippocampi. The Grid Program allows for a highly reliable, semiautomated determination of ROI volumes and is based on a manual point-counting method (MacFall et al 1994).
Our definition of the hippocampus was as follows: on each scan, we began with the most posterior coronal slice and then moved anteriorly. We began measuring the hippocampus when the pulvinar nucleus of the thalamus obscured the crura fornicis; if the crus was only obscured on one side, we only measured that side. The fimbria, which extends from the superior surface of the hippocampus across the CSF into the white matter above, was transected at its narrowest point. Along the medial border of the hippocampus, the thin strip of gray matter was cut at its narrowest point, and tracing then continued around the hip-pocampal body to the starting point. The amygdala-hiphip-pocampal transition zone appeared as a diffuse area of gray matter between the anterior portion of the hippocampus and the posterior portion of the amygdala; as with the fimbria, this area was transected at its narrowest point, which was usually found between the inferior lateral ventricles and the cistern. Continuing anteriorly, the
inferior lateral ventricles gradually shift from a vertical to a horizontal orientation but remain superior to the hippocampus. We defined the anterior border of the hippocampus as the slice on which the inferior lateral ventricles appeared horizontally without any body of gray matter visible below them. All technicians received extensive training by experienced volumet-ric analysts. Reliability was established (kappa.0.9) by repeat measurements on multiple MR scans in younger subjects before raters were approved to process study data. In addition, an ongoing reliability study was conducted to insure that the quality of volumetric analyses was maintained throughout the study. When examining older subjects, our interrater reliability was 0.79 for left hippocampus and 0.69 for right hippocampus.
Statistical Analysis
INITIAL ANALYSES. Right and left hippocampal volumes (HVs) between groups was examined usingttests for age (young vs. old with median age as cut-off), gender, race, depression versus control-subject status, and age of onset (patient group). Continuous variables (age, MMSE score, and total brain volume) were examined using analysis of variance (ANOVA) with the General Linear Models procedure (SAS Institute, Cary, NC). Differences between depressed patients and control subjects were analyzed in a series of ANOVA models (including forward selection models) with HV as the independent variable control-ling for age, gender, and total brain volume. Among the depressed group, a series of ANOVAs (including forward selec-tion) was performed to examine right and left HVs with age, gender, age of depression onset, number of previous depressive episodes, and total brain volume as independent variables. For age of onset analyses, we used an age cut-off of 45 years to distinguish between early-onset and late-onset depression, an age on which we have reported previously (Krishnan et al 1994). Analysis of variance was also used to examine differences on MMSE score within the patient group by age of onset.
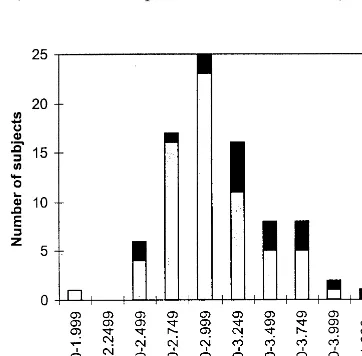
POST HOC ANALYSES. We observed that in the sample of both elderly control subjects and depressed subjects, the vast majority with right or left HV below 3 mL (close to the median) were depressed patients (Figures 1 and 2). We compared group membership (control vs. patients) for subjects with small HV (3 mL or less) versus subjects with large HV (greater than 3 mL) using a chi-square test. Right and left HVs, dichotomized into small versus large groups, were then used as independent variables in a series of logistic regression models controlling for age, gender, race, and total brain volume.
Results
The Sample
control subjects were missing that variable. Figures 1 and
2 show the distribution of right and left HVs for patient
and control subjects. We determined that a cut-off below
3 mL for both right and left HVs identified a subgroup of
subjects comprised almost entirely of patient subjects.
This observation serves as the basic for post hoc analyses
(see below). There was no difference between left and
right HV scores for the sample (
p
5
.268,
t
5 2
1.112).
Bivariate Analyses
Table 2 demonstrates mean values for right and left HVs.
In bivariate analyses, uncontrolled for age, gender, and
race, depressed subjects had significantly smaller HV than
did control subjects for both right HV (
p
5
.003,
t
5
2
3.088) and left HV (
p
5
.014,
t
5 2
2.509). As shown
in the table, white subjects had larger hippocampal
vol-umes than African American subjects, and this difference
reached significance for left HV. Further analyses revealed
that African American subjects tended to be older than
white subjects, and that the proportion of women was
higher among African Americans. In subsequent analyses
that controlled for age and gender, the race variable lost
significance.
Analyses Performed within Patient and
Control Groups
In analyses using ANOVA, there was an association
among patient subjects between right HV and total brain
volume (
p
5
.007) and a nonsignificant association
between right HV and MMSE score (
p
5
.053), whereas
there was no association between right HV and age (
p
5
.097). In control subjects, there was a significant
associa-tion between right HV and total brain volume (
p
5
.033),
but no association between right HV and age (
p
5
.411) or
MMSE score (
p
5
.577). Among patients, left HV was
associated with MMSE score (
p
5
.039) and to a
nonsig-nificant degree with total brain volume (
p
5
.058), but not
with age (
p
5
.143). In the control group, left HV was
associated with total brain volume (
p
5
.048), but there
were no associations between left HV and age (
p
5
.680)
or MMSE score (
p
5
.880).
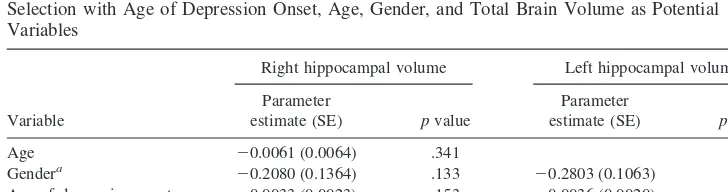
Age of Onset
Among depressed patients, age of onset was negatively but
not significantly related to right HV (
p
5
.052) and to left
HV (
p
5
.062). Number of reported episodes was
unre-lated to either right or left HV (
p
5
.999 and .942,
respectively). In the patient group, we also dichotomized
age of onset into early onset (
,
45 years,
n
5
28, mean age
of onset
5
25.6 years) and late onset (
$
45 years,
n
5
38,
mean age of onset
5
65.2 years). There were no gender
differences by age of onset, with women comprising 75%
of early-onset cases and 79% of late onset cases (
x
25
0.143,
p
5
.705). Mini-Mental State Examination score
was significantly associated with right HV (
p
5
.016) and
left HV (
p
5
.018) for the late-onset depressed patients,
but not for the group with early-onset depression (
p
5
.358
for right HV and
p
5
.543 for left HV).
Initial Regression Analyses
Table 3 demonstrates the results of linear regression
models with right and left HVs as the independent
vari-ables. Accounting for the effects of age, gender, and total
brain volume, depressed patients tended to have smaller
right and left HVs. In forward selection models, the
Figure 1. Numbers of subjects for each of 10 0.250-mL rangesof right hippocampal volume.■, control subjects;h, patients.
negative association between depressed patients and HV
was significant for right HV (
p
5
.014) and close to
significance for left HV (
p
5
.073). Table 4 contains
results of linear regression models using forward selection
models demonstrating a nonsignificant negative
relation-ship between age of onset and right HV (
p
5
.153) and left
HV (
p
5
.076).
Post Hoc Analyses
We report analyses that have not undergone statistical
correction for post hoc comparison. From Figure 1, 39 of
66 (59.1%) depressed subjects and 3 of 18 (16.7%) control
subjects had a right HV less than or equal to 3 mL
[
x
2(1)
5
10.182,
p
,
.001]. In Figure 2, 44 of 66 (66.7%)
depressed subjects and 5 of 18 (27.8%) control subjects
had a left HV less than or equal to 3 mL [
x
2(1)
5
8.800,
p
5
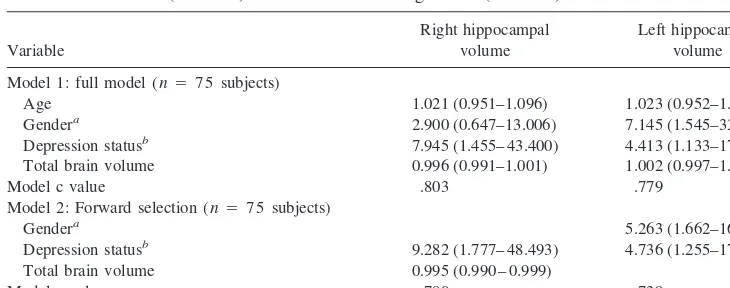
.003]. In a logistic regression model (Table 5) with
right HV as a dichotomous independent variable, when we
controlled for age, gender, and total brain volume,
depres-sion status (patient vs. control subject) was a significant
predictor (odds ratio
5
7.945, CI
5
1.455– 43.400,
p
5
.017). Similarly, in a logistic regression model for left HV
(Table 5), depression status remained significant (odds
ratio
5
4.413, CI
5
1.133–17.184,
p
5
.032). C values for
the models of right HV and left HV were 0.803 and 0.779,
respectively.
We were also interested in characterizing the group of
patients with right and left HVs less than 3 mL. Bivariate
analysis using ANOVA demonstrated that for this group,
age of onset was negatively associated with right HV (
p
5
.193) with a similar trend for left HV (
p
5
.079). In a
linear regression model with age of onset, age, gender, and
total brain volume, none of the independent variables were
significant predictors of either right or left HV.
Table 1. Characteristics of the Sample
Depressed subjects (n566) Control subjects (n518) pvalue
Age, mean (SD) 71.74 (8.42) 67.11 (5.04) .005a Women,n(%) 51 (77.27) 9 (50.00) .023b Race (%)
White 56 (84.85) 17 (94.44)
African American 9 (13.64) 1 (5.56) .683c
Other 1 (1.52) 0 (0)
MMSE score, mean (SD) 27.16 (3.10) 28.83 (0.99) .0004d
at5 22.938. bx255.155.
cFisher’s exact test, 2-tailed, for white vs. African-American subjects.
dBaseline Mini-Mental State Examination (MMSE) score was available on 63 depressed subjects;t53.684.
Table 2. Mean Values (SD) for Right and Left Hippocampal Volumes (HVs; mL)
Right HV tscore,pa Left HV tscore,pa
Age (median age570.5)
Less than 70.5 (n5 42) 3.12 (0.41) 3.03 (0.36)
70.5 or older (n5 42) 2.97 (0.42) 1.750, .084 2.92 (0.42) 1.251, .214 Gender
Men (n5 24) 3.33 (0.42) 3.23 (0.40)
Women (n5 60) 2.93 (0.36) 4.420,,.001 2.87 (0.34) 4.195, .0001 Male patients (n 515) 3.24 (0.39) 3.15 (0.34)
Female patients (n5 51) 2.90 (0.35) 3.183, .002 2.86 (0.34) 2.911, .005 Male control subjects (n59) 3.49 (0.46) 3.38 (0.46)
Female control subjects (n 59) 3.11 (0.34) 2.022, .060 2.97 (0.34) 2.153, .047 Race
White (n 573) 3.06 (0.42) 3.01 (0.39)
African American (n 510) 2.83 (0.31) 21.744, .085 2.72 (0.29) 22.243, .028
Other (n 51) 3.78 3.27
Depression status
Patients (n5 66) 2.98 (0.39) 2.92 (0.36)
Control subjects (n518) 3.30 (0.44) 23.088, .003 3.17 (0.44) 22.509, .014 Age of onset (patients)
Onset,45 years (n528) 3.06 (0.38) 3.00 (0.35)
Onset$45 years (n538) 2.92 (0.39) 1.467, .147 2.87 (0.36) 1.437, .156
Discussion
Our study supports the hypothesis that depressed elderly
patients have smaller HV than a group of nondepressed
elderly control subjects. In some of our models controlling
for age, gender, and total brain volume, we were able to
demonstrate differences between depressed patients and
control subjects. Additionally, among depressed patients,
those with older age of onset had smaller HV. Our study
reports on 66 depressed patients and 18 elderly control
subjects; therefore, sample size considerations suggest
caution when interpreting results. Number of subjects may
also explain why some analyses yielded significant results
(particularly the logistic regression models), whereas
oth-ers demonstrated statistical trends.
Two previous studies that reported decreased HV in
major depression (Axelson et al 1993; Sheline et al 1996)
examined a wide range of age of subjects; our study
focused on geriatric patients. Axelson et al (1993) in
measuring the amygdala-hippocampal complex (AHC)
found a negative relationship between AHC volume and
age of onset of depression (significant on the left, trending
on the right) and a significant negative correlation between
left AHC volume and number of hospitalization with a
trend for trend right AHC volume. Sheline et al (1996)
reported that days of depression were negatively and
significantly associated with HV, and Axelson et al (1993)
found similar trends between duration of illness and AHC
volume. Sheline et al (1996) concluded that this was
consistent with the glucocorticoid toxicity hypothesis put
forward by Sapolsky (1993). Our findings are only mildly
supportive of that hypothesis (with a trend toward smaller
HV in patients with early-onset depression compared with
control subjects) and are rather more supportive of the
observation that late-onset depression is a risk factor for
Alzheimer’s disease (Jorm et al 1991; Kokmen et al 1991;
Table 3. Linear Regression Models for Depressed Subjects vs. Control Subjects Controlling for Age, Gender, and Total Brain Volume (Model 1) and Using Forward Selection for Significant Variables
Variable
Right hippocampal volume Left hippocampal volume
Parameter
estimate (SE) pvalue
Parameter
estimate (SE) pvalue
Model 1 (N575 subjects)
Age 20.0085 (0.0058) .149 20.0055 (0.0057) .338 Gendera
20.1306 (0.1217) .287 20.1752 (0.1202) .149 Depression statusb
20.2097 (0.1092) .059 20.1557 (0.1079) .153 Total brain volume 0.0008 (0.0003) .037 0.0005 (0.0004) .203
ModelR2 .294 .211
Model 2 (N575 subjects) Gendera
20.2855 (0.0943) .003 Depression statusb
20.2673 (0.1062) .014 20.1908 (0.1048) .073 Total brain volume 0.0010 (0.0003) .0004
ModelR2 .256 .182
aFemale subject50, male subject51. bControl subject50, depressed subject51.
Table 4. Linear Regression Models for Right and Left Hippocampal Volumes Using Forward Selection with Age of Depression Onset, Age, Gender, and Total Brain Volume as Potential Variables
Variable
Right hippocampal volume Left hippocampal volume
Parameter
estimate (SE) pvalue
Parameter
estimate (SE) pvalue
Age 20.0061 (0.0064) .341 Gendera
20.2080 (0.1364) .133 20.2803 (0.1063) .011 Age of depression onset 20.0033 (0.0023) .153 20.0036 (0.0020) .076 Total brain volume 0.0005 (0.0004) .269
ModelR2 .218 .149
Model of left hippocampal volume contains only gender and age of onset because in four-variable forward selection model, age and total brain volume both hadp..5 and were excluded.
Speck et al 1995; Steffens et al 1997), particularly with our
finding of an association between MMSE score and HV
among depressed individuals. Although we did not
mea-sure directly days of depression, our finding of a
signifi-cant negative relationship between age of onset and HV, as
well as a lack of association between HV and number of
depressive episodes, did not support those findings.
How do our findings relate to those of Sapolsky
(1993) and Sheline et al (1996)? Although they only
mildly support their findings, glucocorticoid function in
geriatric depression may express itself in a different
manner from other clinical populations. For example,
the severe, late-onset depression experienced by many
of our subjects may be associated with greater
hypotha-lamic-pituitary-adrenal axis dysregulation or with more
comorbid medical illness. Such differences may relate
to severity of illness or the underlying pathophysiology
of illness. Thus, higher glucocorticoid exposure may be
related to the intensity and biology of the illness in
addition to its duration. In support of this hypothesis (in
results not shown), we found that patients with severe
depression had smaller HV compared with other
de-pressed individuals, with the difference on the left being
greater, but these results were not statistically
signifi-cant. Axelson et al (1993) found no relationship
be-tween severity of depression and AHC volume.
Alternatively, it may be that depressed subjects in
this sample are comprised of patients with either
late-onset preclinical dementia or early-late-onset recurrent
ma-jor depression. Those with preclinical dementia may not
be experiencing any glucocorticoid-induced
neurotox-icity, but they may have experienced a much larger
decrease in hippocampal volume as a consequence of
the dementing process. Simply put, the changes in
hippocampal volume may be greater in late-onset
de-pression compared with early-onset dede-pression because
the pathologic processes associated with late-onset
depression exert greater hippocampal effects than does
glucocorticoid neurotoxicity in patients with early-onset
depression. Clearly, more investigations using larger
samples of patients are needed to clarify the relationship
between duration of illness, severity of illness, stress
level, and hippocampal volume.
One potential limitation of our study was the timing of
the MRI scans in relation to entry into the study. With our
protocol, patients had a 2-month window upon entry into
the study to have a MRI scan. If HV is associated with
state effects of depression (e.g., higher cortisol levels),
then patients who underwent an MRI scan when they were
most acutely depressed might have smaller HV than those
who were unable to have an MRI upon entry to the study.
Coffey et al (1991), however, found no difference between
baseline, 2-week and 6-month volumes of the
amygdala-hippocampal complex in depressed patients receiving
electroconvulsive therapy. Thus, it is doubtful that over
the course of 2 months, much change in HV should occur.
We also may face limitations from our scanning
method. We used 3-mm MRI slices that may have limited
our ability to define the hippocampus or differentiate it
from surrounding structures. It also may have led to partial
volume artifacts. Lack of clarity between of hippocampal
boundaries in these older subjects may have contributed to
the suboptimal interrater reliabilities.
Caution is also warranted in the interpretation of our
post hoc results. We did not perform a statistical correction
to account for post hoc analysis. It became clear upon
inspection of the data presented in Figures 1 and 2 that
further analyses using 3 mL as a cutoff might yield
interesting results. We then performed four sets of
analy-ses for right and left HVs. The initial chi-square analyanaly-ses
of depression status by volume were highly significant and
remain significant after post hoc statistical correction. The
Table 5. Logistic Regression Models for Controlling for Age, Gender, Depression Status, and Total Brain Volume (Model 1) and with Forward Regression (Model 2)
Variable
Right hippocampal volume
Left hippocampal volume
Model 1: full model (n575 subjects)
Age 1.021 (0.951–1.096) 1.023 (0.952–1.099) Gendera 2.900 (0.647–13.006) 7.145 (1.545–33.042) Depression statusb 7.945 (1.455– 43.400) 4.413 (1.133–17.184) Total brain volume 0.996 (0.991–1.001) 1.002 (0.997–1.006)
Model c value .803 .779
Model 2: Forward selection (n 575 subjects)
Gendera 5.263 (1.662–16.660)
Depression statusb 9.282 (1.777– 48.493) 4.736 (1.255–17.870) Total brain volume 0.995 (0.990 – 0.999)
Model c value .780 .739
Odds ratios with confidence intervals for right and left hippocampal volumes dichotomized at,3 mL and$3 mL.
subsequent logistic models (
p
5
.017 for right HV,
p
5
0.032 for left HV) may lose significance. Future studies
that dichotomize the volume of the hippocampus should
employ larger samples of depressed patients to overcome
post hoc correction.
Clinical longitudinal research on hippocampal
vol-ume and function is needed to address the role of the
hippocampus in affective disorders. Such studies will
need to focus on both depression and cognitive
out-comes. In particular, studies will need to examine HV in
older depressed patients who subsequently develop
dementia. Alzheimer’s disease is associated with
hip-pocampal atrophy, whereas vascular dementia may not
be. Thus, the study of hippocampal volume in geriatric
depression may inform the relationship between
depres-sion and Alzheimer’s disease.
This study was supported by NIMH Grants Nos. P 30 MH40159, R01 MH54846, and K07 MH01367. Presented at the Annual Meeting of the American Association for Geriatric Psychiatry, March 13–17, 1999.
References
Axelson DA, Doraiswamy PM, McDonald WM, Boyko OB, Tupler LA, Patterson LJ, et al (1993): Hypercortisolemia and hip-pocampal changes in depression.Psychiatry Res47:163–173. Byrum CE, MacFall JR, Charles HC, Chitilla VR, Boyko OB,
Upchurch L, et al (1996): Accuracy and reproducibility of brain and tissue volumes using a magnetic resonance segmen-tation method.Psychiatry Res67:215–234.
Carroll BJ, Feinberg M, Greden JF, Tarika J, Albala AA, Haskett RF, et al (1981a): A specific laboratory test for the diagnosis of melancholia. Standardization, validation, and clinical util-ity.Arch Gen Psychiatry38:15–22.
Carroll BJ, Feinberg M, Smouse PE, Rawson SG, Greden JF (1981b): The Carroll Rating Scale for Depression. I. Develop-ment, reliability, and validation.Br J Psychiatry138:194 –200. Coffey CE, Weiner RD, Djang WT, Figiel GS, Soady SA, Patterson LJ, et al (1991): Brain anatomic effects of electro-convulsive therapy. A prospective magnetic resonance imag-ing study.Arch Gen Psychiatry48:1013–1021.
Coffey CE, Wilkinson WE, Weiner RD, Parashos IA, Djang WT, Webb MC, et al (1993): Quantitative cerebral anatomy in depression. A controlled magnetic resonance imaging study.
Arch Gen Psychiatry50:7–16.
Endicott J, Spitzer RL, Fleiss JL, Cohen J (1976): The Global Assessment Scale: A procedure for measuring overall sever-ity of psychiatric disturbance.Arch Gen Psychiatry33:766 – 771.
Folstein MF, Folstein SE, McHugh PR (1975): “Mini-mental state.” A practical method for grading the cognitive state of patients for the clinician.J Psychiatr Res12:189 –198. George LK, Blazer DG, Hughes DC, Fowler N (1989): Social
support and the outcome of major depression.Br J Psychiatry
154:478 – 485.
Hachinski VC, Iliff LD, Zilhka E, Du Boulay GH, McAllister
VL, Marshall J, et al (1975): Cerebral blood flow in dementia.
Arch Neurol32:632– 637.
Hamilton M (1960): A rating scale for depression. J Neurol Neurosurg Psychiatry23:56 – 61.
Jack CR Jr, Petersen RC, Xu YC, O’Brien PC, Waring SC, Tangalos EG, et al (1998): Hippocampal atrophy and apoli-poprotein E genotype are independently associated with Alzheimer’s disease.Ann Neurol43:303–310.
Jorm AF, van Duijn CM, Chandra V, Fratiglioni L, Graves AB, Heyman A, et al (1991): Psychiatric history and related exposures as risk factors for Alzheimer’s disease: A collab-orative re-analysis of case-control studies. Int J Epidemiol
20(suppl 2):S43–S47.
Kikinis R, Shenton ME, Gerig G, Martin J, Anderson M, Metcalf D, et al (1992): Routine quantitative analysis of brain and cerebrospinal fluid spaces with MR imaging.J Magn Reson Imaging2:619 – 629.
Kokmen E, Beard CM, Chandra V, Offord KP, Schoenberg BS, Ballard DJ (1991): Clinical risk factors for Alzheimer’s disease: A population-based case-control study. Neurology
41:1393–1397.
Krishnan KR, Doraiswamy PM, Figiel GS, Husain MM, Shah SA, Na C, et al (1991): Hippocampal abnormalities in depression.J Neuropsychiatry Clin Neurosci3:387–391. Krishnan KR, Hays JC, Blazer DG (1997): MRI-defined vascular
depression.Am J Psychiatry154:497–501.
Krishnan KRR, Ritchie JC Jr, Tupler LA, McDonald WM, Knight D, Nemeroff CB, et al (1994): Apolipoprotein E epsilon 4.Neurology44:2420 –2421.
Laakso MP, Soininen H, Partanen K, Lehtovirta M, Hallikainen M, Hanninen T, et al (1998): MRI of the hippocampus in Alzheimer’s disease: sensitivity, specificity, and analysis of the incorrectly classified subjects.Neurobiol Aging19:23–31. Landerman R, George LK, Campbell RT, Blazer DG (1989): Alternative models of the stress buffering hypothesis.Am J Community Psychol17:626 – 642.
Linn BS, Linn MW, Gurel L (1968): Cumulative illness rating scale.J Am Geriatr Soc16:622– 626.
MacFall JR, Byrum CE, Parashos I, Early B, Charles HC, Chittilla V, et al (1994): Relative accuracy and reproducibility of regional MRI brain volumes for point-counting methods.
Psychiatry Res55:167–177.
McEwen BS (1997): Possible mechanisms for atrophy of the human hippocampus.Mol Psychiatry2:255–262.
Mongeau R, Blier P, de Montigny C (1997): The serotonergic and noradrenergic systems of the hippocampus: Their inter-actions and the effects of antidepressant treatments.Brain Res Brain Res Rev23:145–195.
Montgomery SA, Asberg M (1979): A new depression scale designed to be sensitive to change.Br J Psychiatry134:382– 389.
Morris JC, Mohs RC, Rogers H, Fillenbaum G, Heyman A (1988): Consortium to Establish a Registry for Alzheimer’s Disease (CERAD) clinical and neuropsychological assess-ment of Alzheimer’s disease.Psychopharmacol Bull24:641– 652.
depres-sion, vascular dementia and other causes of cognitive impair-ment.Psychol Med27:1267–1275.
Radloff LS (1977): The CES-D scale: A self-report depression scale for research in the general population.Appl Psychol Measures1:385– 401.
Robins LN, Helzer JE, Croughan J, Ratcliff KS (1981): National Institute of Mental Health Diagnostic Interview Schedule: Its history, characteristics, and validity. Arch Gen Psychiatry
38:381–389.
Sapolsky RM (1993): Potential behavioral modification of glu-cocorticoid damage to the hippocampus. Behav Brain Res
57:175–182.
Sheline YI (1996): Hippocampal atrophy in major depression: A result of depression-induced neurotoxicity. Mol Psychiatry
1:298 –299.
Sheline YI, Wang PW, Gado MH, Csernansky JG, Vannier MW (1996): Hippocampal atrophy in recurrent major depression.
Proc Natl Acad Sci U S A93:3908 –3913.
Soares JC, Mann JJ (1997): The anatomy of mood disorders— review of structural neuroimaging studies. Biol Psychiatry
41:86 –106.
Speck CE, Kukull WA, Brenner DE, Bowen JD, McCormick WC, Teri L, et al (1995): History of depression as a risk factor for Alzheimer’s disease.Epidemiology6:366 –369.
Spitzer RL (1983): Psychiatric diagnosis: Are clinicians still necessary?Compr Psychiatry24:399 – 411.