DENSE IMAGE MATCHING FOR MARS EXPRESS HRSC IMAGERY BASED ON
PRECISE POINT PREDICTION METHOD
X. Geng a,b*, Q. Xua, J. Miaob, Y.F. Houa, S. Xing a, C.Z. Lan a
a Information Engineering University, Institute of Surveying and Mapping, 450001 Zhengzhou, China - (gengxun_rs, xing972403,
lan_cz)@163.com; [email protected]; [email protected]
b Xi’an Information Technique Institute of Surveying and Mapping, 710054 Xi’an, China – [email protected]
Commission IV, WG IV/8
KEY WORDS: Mars Exploration, Planetary Photogrammetry, Mars Topographic Mapping, Image Matching, High Resolution Stereo Camera
ABSTRACT:
Currently, Mars Express HRSC imagery is an essential data source to derive high accuracy Mars topographic data. In view of the characteristics of Martian surface satellite imagery, a dense image matching scheme for HRSC imagery based on precise point prediction method is proposed. The image matching strategies of our method are elaborated in detail. Based on the proposed method, DEM and DOM of Martian surface are derived and compared with those published by ESA. The experiment results show that the root mean square error in planar direction is about three pixels, while the root mean square error in height direction is about one pixel. Moreover, the mean square error in plane direction show a certain systematic error and the reasons are analysed. Experiment results also demonstrate that the point prediction accuracy for corresponding points is up to 1~3 pixels.
1. INTRODUCION
Mars topographic mapping is essential to scientific research of Mars (Kirk, 2000). The Mars exploration missions mainly focusing on topographic mapping include Viking (Rosiek, 2005), Mars Global Surveyor (Shan, 2005), Mars Express (Albertz, 2005 and Heipke, 2006) and Mars Reconnainssance Orbiter (Li, 2011). Among all these Mars exploration missions, the High Resolution Stereo Camera (HRSC) on Mars Express (MEX) has advantages in image resolution and global coverage.
Image matching is a basic question in photogrammetric field which is mainly used in bundle adjustment and automatic DTM extraction. The remote sensing images on Mars have almost the same characteristics of images on the desert filed of earth, which show little texture information. Consequently, it is difficult to perform the image matching for Mars imagery. Currently, the global coverage DTM of Mars has a resolution about 200~300m which is still can be improved using HRSC imagery. Up to now, Mars Express is still on service and large amount of Mars high resolution imagery can be obtained. In order to acquire high resolution mapping products of Mars, photogrammetric processing of HRSC imagery is performed. As we all know, most of the processing time is spent on automatic DTM extraction. Though a great deal of research on the automatic DTM extraction from HRSC imagery has been done (Albertz, 2005, Kirk, 2006 and Heipke, 2006), it is still a problem worth studying. Given the large data volume and pushbroom imaging principle nature of HRSC imagery, the computation efficiency of image matching for HRSC imagery can be optimized furthermore. In this paper, a dense image matching method for HRSC imagery based on precise point prediction is proposed and the robustness and efficiency of our method is verified.
* Corresponding author
2. RIGOROUS GEOMETRIC MODEL OF HRSC Mars Express which was launched in 2003 is the first Mars exploration mission of Europe. The image resolution of HRSC imagery carried on Mars Express is about 10 m. Moreover, the images collected by HRSC have almost covered the whole Mars surface.
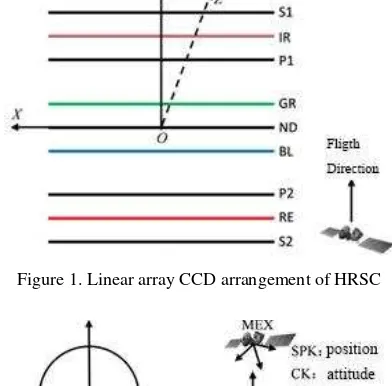
As illustrated in figure 1, there are nine linear CCD arrays and each linear CCD array has 5184 pixels. The focal length is 175 mm and the radiometric resolution is 12 bits. HRSC can acquire five panchromatic band images and four multi-spectral band images simultaneously. The image resolution of panchromatic band is superior to that of multi-spectral band. Through image fusion high resolution multi-spectral images can be generated.The rigorous geometric model of satellite images is the basis for subsequent photogrammetric processing. Integrated Software for Imagers and Spectrometers (ISIS) and SPICE kernels which storing the spacecraft position and pointing data are used to extract the camera calibration parameters, exterior orientation elements, reference coordinates and other necessary information (Kirk, 2006). The construction procedures of rigorous geometric model for HRSC pushbroom imagery are as follows:
1. Convert Level 2 image of HRSC from Planetary Data System (PDS) format to TIFF format using GDAL (Geospatial Data Abstraction Library).
2. Acquire the focal length, pixel size, pixel position and other geometric parameters of camera using SPICE kernels.
3. Import original PDS format HRSC imagery into ISIS and export scanning line time to a text file.
4. Acquire the position and attitude data of each scanning line using SPICE kernels and the text file containing the scanning line time.
5. Construct the rigorous geometric model of HRSC imagery using camera’s geometric parameters and exterior orientation elements.
Figure 1. Linear array CCD arrangement of HRSC
Figure 2. Acquiring EO using SPICE kernels
The procedure of acquiring exterior orientation elements of HRSC imagery by SPICE kernels is shown as figure 2. Through a series of transformation between Earth, Mars and MEX, the exterior orientation of HRSC imagery can be calculated. The reference time is J2000 and the object coordinates is Mars Centered Mars Fixed coordinates. The mathematical model of HRSC pushbroom imagery is as follows:
[ ] = [ ] + ����� �� � �� �� [ −�]
where � = focal length
, = image coordinates
, , = coordinates of projection center
, , = object coordinates
���� = rotation matrix from J2000 to Mars-centered
Mars-fixed coordinates
�� = attitude rotation matrix measured by star tracker
� � = rotation matrix from satellite body to star
tracker
� �� = rotation matrix from satellite body to
camera
3. IMAGE MATCHING BY PRECISE POINT PREDICTION METHOD
3.1 Basic Principles
As we all know, there is little texture information on Mars surface and it is hard to extract feature points. Meanwhile, compared with earth observation satellite images, there are some advantages on
image matching for Mars surface images, such as there are no human buildings and moving objects. These factors can be used to design the image matching algorithm for Mars surface images. In view of the image characteristic of Mars surface, a dense image matching strategy based on Precise Point Prediction Method (P3M) for HRSC imagery is proposed in this paper.
The basic principle of P3M is illustrated in figure 3. The red dashed line represents epipolar line direction. Set the gray value of image point , on Image � is 132 and the gray value of correspondent point ′, ′ on Image � is 130. Given two point prediction method of correspondent points for image matching. Set the prediction accuracy of the first method is inferior and the gray value of the pixel predicted by the first method is 148. Apparently, given a large search window size such as 5×5, the correspondent point is not within the search window. However, the second method shows superior prediction accuracy and the pixel predicted by the second method has gray value of 173, which is close to the real correspondent point. In the latter circumstance, given a small search window size such as 3×3, the correspondent point with the gray value 130 can be searched immediately. It is obvious that the image matching problem can be solved conveniently with an accurate point prediction and an appropriate search window size.
Figure 3. Correspondent point precise prediction
To be more concrete, the main strategies of our image matching method are as follows:
(1) Construct mathematical model of point prediction method based on affine transform using neighbouring known points. Given a certain number of matched points, the affine transform model can be constructed and the correspondent point’s approximate position can be predicted. It is obvious that the prediction position will be more accurate with more matched known points.
(2) Use approximate epipolar line geometric constraint to decrease the search window size. In reality, the procedure of approximate epipolar resampling is a procedure of geometric correction. The image matching measure of P3M is normalized correlation coefficient (NCC). On approximate epipolar resampled images, the NCC can be conducted more efficiently due to the correction of geometric deformation.
(3) Acquire initial matched points through SURF. SURF is the modified version of SIFT which show better efficiency. Experimental results show that even if there is little texture information on Mars remote sensing images, dozens of correspondent points can be matched. Therefore, SURF algorithm can be used to extract initial matched points. These points can be used as known points in subsequent image matching steps.
(4) Select distinct feature points to densify the correspondent points firstly. Naturally, the distinct feature points are more convenient to be matched than general points.
3.2 Precise Point Prediction
When there are some known matched points, the distance between these known matched points and the image point to be matched are always small, such as 50 or 100 pixels. Therefore, affine transformation model can be used to construct the mapping rule from left image point to right image point. The mathematical model is as follows:
{ == ++ ++
There are six unknown affine transformation coefficients in equation 2. It is obvious that each correspondent points can give two equations. Consequently, it is enough to solve the six unknown coefficients with three correspondent points. When there are more than three points, least squares adjustment is used. After the affine transformation coefficients are solved, the position of a correspondent point can be predicted according to equation 2. Actually, when there are enough known matched points, the accuracy of point prediction of correspondent points can reach 1~3 pixels. This is why we call the method as Precise Point Prediction. After the image point is predicted, the search window size should be set according to the distance between the neighbouring matched points and the image point to be matched, approximate epipolar line geometric constraints and terrain information. Therefore, the point prediction model can be illustrated as follows.
{ . point prediction: , → � , . set search window size: ×
3.3 Procedure
Set stereo images I1 and I2 and the image matching procedures are shown in figure 4. The specific procedures are as follows:
(1) Approximate epipolar resampling HRSC imagery. Based on rigorous geometric model of pushbroom imagery, the stereo images of HRSC imagery are resampled along approximate epipolar line through projection trajectory method. The detailed epipolar resampling procedure of HRSC imagery is illustrated in literature (Geng, 2015).
(2) Using SURF to extract feature points firstly, then calculate feature descriptor vector and match feature points. Set the number of initial correspondent points is �
.
(3) Extract more feature points for densifying correspondent points. Use the � matched points as known points to perform correspondent point can be predicted.
(5) Calculate normalized correlation coefficients and fix the correspondent point.
(6) Densifying image matching results step by step. Repeat step 3 to step 5 and densify image matching results until enough correspondent points are matched or there are no more feature points. In this circumstance, in order to find more correspondent points to generate DEM, grid points can be used.
(7) Match more correspondent points on grid points. On image I1, select points by certain grid intervals such as 5×5 pixels, then using P3M to match these grid points.
Image I1 Image I2
Figure 4. Procedure of P3M image matching
4. EXPERIMENT AND ANALYSIS
In order to analyse the accuracy of point prediction and the robustness of our method, experiment is conducted with Mars Express HRSC Level 2 Images. The algorithm is implemented by Visual Studio 2010 and Qt on Windows 8 operating system with Intel Core i5 (2.50GHz) CPU and 4GB memory.
4.1 Accuracy of Point Prediction
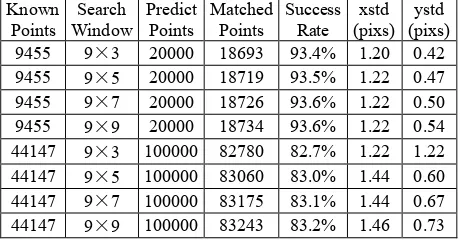
Two group experiments were conducted with H5273 orbit images obtained by HRSC. Firstly, SURF algorithm is used to extract initial matched points. The number of initial matched points of first group is 9455 and the number of second group is 44147. Different search window size is used to analyse the accuracy of point prediction and the success rate of image matching. The errors between the predicted points and the local optimum NCC matched points are compared. Experimental results are shown in Table 1.
Known
Points WindowSearch PredictPoints MatchedPoints SuccessRate (pixs)xstd (pixs)ystd 9455 9×3 20000 18693 93.4% 1.20 0.42 9455 9×5 20000 18719 93.5% 1.22 0.47 9455 9×7 20000 18726 93.6% 1.22 0.50 9455 9×9 20000 18734 93.6% 1.22 0.54 44147 9×3 100000 82780 82.7% 1.22 1.22 44147 9×5 100000 83060 83.0% 1.44 0.60 44147 9×7 100000 83175 83.1% 1.44 0.67 44147 9×9 100000 83243 83.2% 1.46 0.73 The International Archives of the Photogrammetry, Remote Sensing and Spatial Information Sciences, Volume XLI-B4, 2016
Table 1. Errors between prediction points and real points
In Table 1, xstd and ystd represent the standard deviation of the difference between the predicted point and the NCC matched points in X and Y direction. According to the experiment results, we come to the conclusion as follows:
(1) For the accuracy of point prediction, the root mean square error in X direction is about 1.5 pixels and the root mean square error in Y direction is less than 1 pixel. Moreover, most of the points’ prediction errors are less than 2 pixels, which demonstrates that the position accuracy of predicted point by P3M is very accurate.
(2) As a result of the high prediction accuracy, increasing the search window size has no impact on the success rate of image matching. Therefore, a small search window size can be given to improve the computation efficiency.
(3) Due to the approximate epipolar line geometric constraints, the point prediction errors in Y direction is small. Though the search window size is extended from 9×3 to 9×9, the success rate of image matching is not affected.
4.2 Robustness
In view to the fact that the image matching procedures are conducted step by step and the point prediction method uses many neighbouring known points. Even if there are several wrong matched points, nevertheless in subsequent NCC image matching level the correspondent point matching will not fail. This equals to eliminating the wrong matched points in upper image matching step and the point prediction accuracy in the next image matching step is not decreased greatly.
A manual error point is added into H8433 orbit image. The prediction error of wrong matched point is about 20 pixels. The number of known matched points is 9321 and 18766 correspondent points are densified. Experimental results show that wrong matched points have no impact on subsequent image matching procedure. Therefore, the image matching strategy of our method have a potential robustness against errors.
4.3 DEM Generation
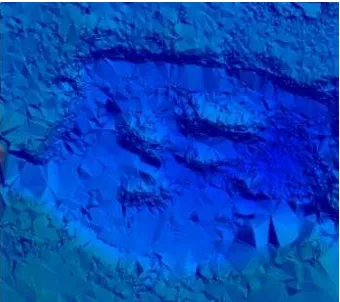
Four orbits HRSC images are processed using rigorous geometric model and bundle adjustment are conducted through ISIS software. For each orbit images, S1 and S2 panchromatic bands are used to construct stereo images. Using the dense correspondent points matched by P3M, the DEM can be generated through forward intersection. The DEM automatic extraction results are shown in table 2 and figure 5~8. The Curiosity landing sites as labelled in red ellipse in figure 8. The efficiency of image matching is about 1000 points per second with one single thread and the algorithm can be optimized by multithreading technique in the future.
Image Orbit
Terrain Type
Image Size
Matching Steps
Matched Points
H3304 Valley 2000×2000 2 37032
H5273 Creater 5000×5000 2 147712 H8433 Valley 3000×3000 2 195858
H9465 Hills 1000×1000 2 24014
Table 2. Experiment results of DEM extraction
Figure 5. DEM results of H3304
Figure 6. DEM results of H8433
Figure 7. DEM results of H9465
(a) our results (b) ESA’s results The International Archives of the Photogrammetry, Remote Sensing and Spatial Information Sciences, Volume XLI-B4, 2016
(c) 3D scene
Figure 8. DEM results of H5273 compared with ESA
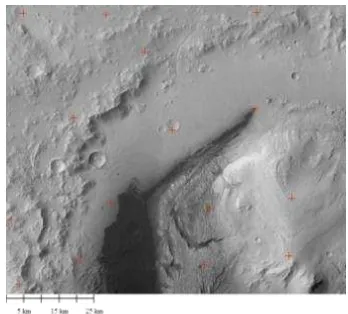
Figure 9. Point distribution of accuracy comparison
4.4 Experiment results compared with ESA
In order to analyse the geometric accuracy of our method, several points are selected on the DEM and DOM which are generated from H5273 orbit. The geometric positon of these points are compared with ESA’s results. The point distribution is shown in figure 9. Mars reference coordinates system is defined as sphere and the radius is 3396.0 km. The image resolution of DOM is about 25 m and the grid intervals of DEM is 50 m. In longitude direction, the max residual is 269 m and the RMSE is 95 m which is about three to four pixels. In latitude direction, the max residual is 244 m and the RMSE is 38 m, which is about one and a half pixels. In height direction, the maximum residual is 124 m and the RMSE is 52 m, which is about one grid interval. It is obvious that there are systematic errors in planar direction. In longitude direction the systematic error is 2~3 pixels and in latitude direction the systematic error is about one pixel. However, there is no distinct systematic error in height direction. The factors that introduce systematic errors are as follows:
(1) The exterior orientation elements of HRSC imagery used in this paper are acquired from SPICE kernels which are the initial results of ESA. Though the geometric accuracy has been improved through photogrammetric bundle adjustment, systematic errors may not be completely avoided.
(2) In view to the fact that Mars Express has been on operation more than 10 years, the camera calibration parameters may change and the rigorous geometric model of HRSC is not as accurate as before.
According to the above analysis, if the systematic errors are eliminated, the errors between our results and ESA’s are only 1~2 pixels, which demonstrate our method’s feasibility.
5. CONCLUSIONS
In this paper, a dense image matching scheme based on precise point prediction method for Mars surface images is put forward. The experiment is conducted with Mars Express HRSC imagery and the method’s feasibility is verified. The experiment results show that the position accuracy of point prediction of our method is up to 1~3 pixels, which can greatly improve the image matching efficiency.
ACKNOWLEDGEMENTS
This work was supported by the National Natural Science Foundation of China (41401533) and National Program on Key Basic Research Project of China (2012CB720000).
REFERENCES
Albertz, J., Attwenger, M., and Barrett, J., 2005. HRSC on Mars Express—photogrammetric and cartographic research.
Photogrammetric Engineering and Remote Sensing, 71(10), pp. 1153-1166.
Geng, X., Xu, Q., Xing, S., and Hou, Y., F., 2015. Approximate epipolar resampling of Mars Express HRSC linear pushbroom imagery based on projection trajectory method. Geomatics and Information Science of Wuhan University, 40(1), pp.40-45.
Heipe, C., Oberst, J., Albertz, J., Attwenger, M., 2006. The HRSC DTM Test. In: The International Archives of the Photogrammetry, Remote Sensing and Spatial Information Sciences, Goa, India, Vol. XXXVI, Part B4.
Kirk, R., L., Kraus, E., H., and Rosiek, M., 2000. Recent planetary topographic mapping at the USGS. In: The International Archives of the Photogrammetry, Remote Sensing and Spatial Information Sciences, Amsterdam, The Netherlands, Vol. XXXIII, Part B4, pp. 476-490.
Kirk, R., L., Kraus, E., H., Galuszka, D., Redding, B., Hare, T., M., 2006. Topomapping of Mars with HRSC images, ISIS and a commercial stereo workstation. In: The International Archives of the Photogrammetry, Remote Sensing and Spatial Information Sciences, Goa, India, Vol. XXXVI, Part B4.
Li, R., X., Hwangbo, J., Chen Y., H., and Di, K., C., 2011. Rigorous Photogrammetric Processing of HiRISE Stereo Imagery for Mars Topographic Mapping. IEEE Transactions on Geoscience and Remote Sensing, 2011, 49(7), pp.2558-2572.
Rosiek, M., Kirk, R., L., and Archinal, B., A, 2005. Utility of Viking Orbiter images and products for Mars mapping.
Photogrammetric Engineering and Remote Sensing, 71(10), pp. 1187-1195.
Shan, J, Yoon, J., and Lee, D., S., 2005. Photogrammetric analysis of the Mars Global Surveyor mapping data.
Photogrammetric Engineering and Remote Sensing, 71(1), pp. 97-108.