CHANGE DETECTION OF REMOTE SENSING IMAGES BY DT-CWT AND MRF
Shida OuYanga, Kuikui Fana,b, Huibing Wanga, and Zhongyuan Wang b a
NASG,Satellite Surveying and Mapping Application Center, Bai sheng cun 1 Hao Yuan, Beijing, China - [email protected]
b
School of Environment Science and Spatial Informatics, China University of Mining and Technology, Xuzhou, China [email protected]
KEY WORDS: Change Detection, DT-CWT, MRF, Multi-Scale Decomposition, ICM, Segmentation
ABSTRACT:
Aiming at the significant loss of high frequency information during reducing noise and the pixel independence in change detection of multi-scale remote sensing image, an unsupervised algorithm is proposed based on the combination between Dual-tree Complex Wavelet Transform (DT-CWT) and Markov random Field (MRF) model. This method first performs multi-scale decomposition for the difference image by the DT-CWT and extracts the change characteristics in high-frequency regions by using a MRF-based segmentation algorithm. Then our method estimates the final maximum a posterior (MAP) according to the segmentation algorithm of iterative condition model (ICM) based on fuzzy c-means(FCM) after reconstructing the high-frequency and low-frequency sub-bands of each layer respectively. Finally, the method fuses the above segmentation results of each layer by using the fusion rule proposed to obtain the mask of the final change detection result. The results of experiment prove that the method proposed is of a higher precision and of predominant robustness properties.
1. INTRODUCTION
With the continuous development of remote sensing data acquisition technologies and the update cycle of image data is getting shorter and shorter, change detection technology, an important application in remote sensing image processing and analysis, has successfully playing an indispensable role in land use and cover, forest and vegetation cover, change detection of towns and roads, natural disaster relief and governance and geographic database updating as well as many other fields[1]– [3].
Generally, change detection techniques can be grouped into supervised and unsupervised types. By contrast, since unsupervised change detection can obtain the final change results without using any additional prior knowledge except the original images, it has become the concerning focus of many research scholars[4]–[6]. Usually unsupervised change detection techniques are based on difference image, which is mainly divided into four categories: thresholding[7]–[9], transformation[10]–[12], clustering[13],[14] and modeling[15]–[17]. Thresholding can be implemented by selecting the appropriate threshold to distinguish between the change and non-change pixels in difference image. Bayesian optimal threshold method[18], [19] is of the advantage of briefness and intuition, but often performs only a single scale segmentation which will inevitably lead to over-segmentation or incompletely segmentation, and the test results are greatly dependent on the selected threshold. Transformation mainly includes multi-scale transformation and statistical analysis, such as WT (wavelet transform)[4], PCA (principal component analysis) transformation[10], and KICA (kernel independent component analysis) transformation[11]. Such methods can better overcome the effects of sensor noise, registration error and other factors, but those does not consider the correlation between pixels, which affects the edge detection roughness and leads to more false detection pixels. Clustering generally facilitate clustering analysis according to the characteristics, affinity and similarity of the sample, such as K-means[20],[21],
FCM (fuzzy c-means)[13],[22] and so on. These methods take into account the change ambiguity of image and have a strong robustness to image registration. However, those largely depending on the choice of initial clustering centers, and noise will has a large effect on the clustering results. Image modeling simulates the distribution of related spatial context by building model in which the pixels are interrelated[23]–[25]. Such approaches consider the interaction between the neighborhood pixels, better overcome the pixel isolated problem, However, it has a weaker expression of the mutation and detail information and cause more pseudo-change detection. In order to solve the problem in the methods described above, scholars developed a remote sensing image change detection method based on the combination between Discrete Wavelet Transform (DWT) and Markov random Field (MRF)[12]. These methods take advantage of the frequency analysis capability of WT and takes spatial correlation of pixels into account, better overcome single pixel independence, false change caused by noise and registration errors and other factors. Since the high frequency information is not taken into account during the fusion process, it will inevitably result in some loss of information, in addition to, WT coupled with the direction selectivity and translation sensitivity, so the details change detection are still under-expression.
multi-scale decomposition algorithm, is implemented to the difference image. Secondly, the change characteristics in high-frequency regions are extracted using the segmentation algorithm based on MRF. Thirdly, the same size images are obtained by reconstructing the high-frequency and low-frequency sub-bands of each layer respectively. Additionally, the method performs the final segmentation to the reconstruction result above of each layer according to maximum a posterior probability (MAP) criterion. Finally, the final change detection result is obtained by fusing the above segmentations.
To evaluate the performance of the method proposed, four groups of contrast experiments were carried on optical remote sensing images. This paper is organized as follows. After a brief introduction to the research status of change detection, the related theories are presented in Section 2. Section 3 shows the proposed algorithms which include the combination between DT-CWT and MRF, ICM segmentation model based on FCM and fusion rules. Experimental environment, key steps, results and discussion and analysis are given in Section 4. Finally, Section 5 draws some conclusions.
2. DT-CWT AND MRF SEGMENTATION MODEL
2.1 DT-CWT Decomposition
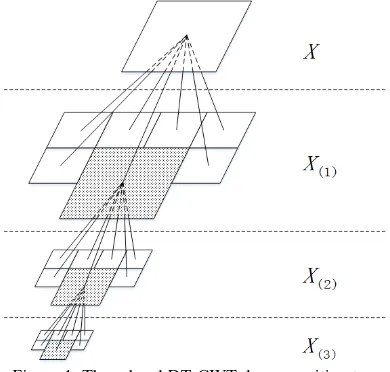
To overcome the sampling structure difference of odd / even filter due to the strict linear phase, we use Q-Shift (Quarter Sample Shift) filter group based on orthogonal transformation[27] to perform two-dimensional DT-CWT decomposition on test images. Each decomposition produces a low-frequency and six directional high-frequency sub-bands (±15°,±45°,±75°). As shown in figure 1, it is a three-level DT-CWT decomposition tree, and X is the original image, X(n)(n = 1,2,3) is the n-th level low or high decompositions, shaded parts are low frequency subband, blank parts are the high frequency subband.
Figure 1. Three level DT-CWT decomposition tree
2.2 MRF Segmentation Model
Since Markov Random Field (MRF) can perfectly describe the spatial correlation of image information and effectively establish the prior model of context, it is widely applied in remote sensing image classification and change detection[14][28]. MRF segmentation model is proved under Bayesian and its establishment generally is described by two
random fields, one is tag field W={W | w1, w2, …, wn}, which is used to track and mark the category of the test image pixel; the other is feature field F={F | f1, f2, …, fn}, which is often used for feature analysis under the precondition of mark field. Suppose F=f is a feature vector extracted from a random image X=x, W=w is the segmentation result based on F=f. According to Bayes criterion, the problem of image segmentation can be expressed as:
Optimal segmentation of an image is to find the best mark field
W
of the target image, and the posterior probability function P(W=w|F=f) has its maximum value[29], which is a typical MAP-MRF issue. Basing on MAP criterion, global optimal estimation of image segmentation can be expressed as:)
Considering
W
in (2) is complex to calculate, MRF-MAP can be converted to the optimization of GRF minimum energy function according to the Hammersley–Clifford theorem and the Gibbs theorem[30] which can be achieved by ICM (iterative condition model) algorithm.3. CHANGE DETECTION ALGORITHM BY DT-CWT AND MRF
3.1 Algorithmic Process
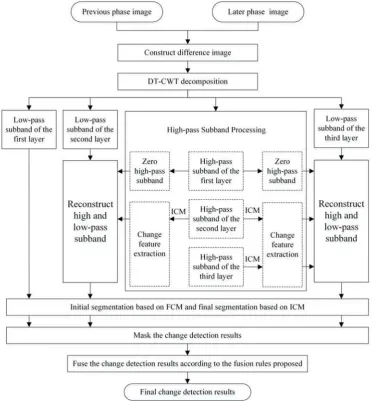
Considering the accuracy and efficiency of the algorithm, the paper performs three-layer DT-CWT decomposition on the test, the algorithm flowchart shown in Figure 2.
Suppose, X1(i,j)and X2(i,j), two grayscale matrices for remote sensing images with the same region, are the same size of m×n and are precisely registered. The specific algorithm of change detection based on DT-CWT and MRF is as follows:
Step 1 Obtain the difference image D according to
)
Step 2 Perform a three-level DT-CWT decomposition on the difference image D , which can respectively produce a low-frequency sub-band
{
L1,L2,L3}
and six directionalhigh-Step 3 Set the high-frequency components of the first layer to zero. In addition, respectively calculate initial cluster centers to the high-frequency sub-bands of the second and third layers according to v1=(min(D(i,j))+t)/2 、
Step 4 Based on the equivalence of MRF and GRF, constantly update the tag field
W
km,l to reach the final optimal segmentation, namely MRF-MAP, by using ICM model whosean initial segmentation can be obtained according to the clustering algorithm of FCM based on adaptive Bayes threshold.
Fig 2. Flowchart of change detection based on DT-CWT and MRF
Step 5 Mask the final segmentation results, divide the mask matrix into change class C and non-change class U according to the pixel values. Pixel with a value of 1 belongs to C class and pixel with a value of 0 belongs to U class. We can obtain the change feature of high-frequency sub-bands that are extracted according to remaining the pixels of the high-frequency sub-bands of the second and third layers where the pixels of class C correspond, and set the pixels where the pixels of class U correspond to zero.
Step 6 Take the low frequency sub-band in first layer L1 as C1, reconstruct the low frequency sub-band in second layer L2 and
l k, ˆ
H (k=1,2;l=±15,±45,±75) as C2, reconstruct the low frequency sub-band in third layer L3 and
l k, ˆ
H (k=1,2,3;l=±15,±45,±75) as C3.
Step 7 Make C1, C2 and C3 respectively repeat steps 3 and 4, namely, perform the initial segmentation based on FCM and ultimate optimal segmentation MRF-MAP, then mask the
segmentation results above to obtain the final binary mask image Z1, Z2, Z3.
Step 8 Fusing the binary mask image Z1, Z2, and Z3 according to the similarity fusion rules to get the final change detection result Z.
In the algorithm, the loop termination condition of FCM is that the difference between adjacent loop cluster centers is less than 0.0001 and the maximum loop times is set to 15, maximum iteration number of ICM is set to 30.
3.2 ICM Segmentation Model Based On FCM
high resolution remote sensing images. Besides, in the algorithm proposed, the high and low frequency sub-band coefficient is very small by DT-CWT decomposition after normalization so that it is difficult to get the initial clustering centers according to the usual image histogram. In order to overcome the problems, we gain the initial clustering centers of FCM according to adaptive Bayes threshold instead of histogram. The flow chart of ICM segmentation algorithm based on FCM is shown in Figure 3, where cluster number is set to 3.
Figure 3. ICM segmentation algorithm based on FCM
Suppose to the gray matrix of test image isX( ji, ), the specific steps of ICM segmentation algorithm based on FCM are as follows:
Step 1 Obtain Bayes threshold t of X( ji, ), then calculate the initial cluster center V1=[v1,v2] according to
2
Step 2 Calculate the membership matrix U, and update the tag field Wm and the cluster center Vm, where m is the number of iterations.
Step 3 Judge the iteration termination condition, repeat steps 2 and constantly update Wm.
Step 4 Based on the equivalence of MRF and GRF ,we can gain tag field energy Um(w) by calculating the energy of each
pixels in tag field Wm under second-order neighborhood system according to the energy function:
∑
∈Where c is a potential group, C is a second-order potential group set.
Step 5 Calculate characteristic field parameters, namely,
meanµmand variance σ2m according to initial segmentation state, calculate the energy of each pixels of characteristic field according to the energy function:
2 update tag field Wm according to the principle of minimum combination energy:
Step 6 Judges loop termination condition, repeat steps 4 and 5 constantly update tag field to reach the final optimal segmentation MRF-MAP.
Segmentation model based on DT-CWT and MRF, that is, regarding high or low frequency sub-band of each layer through DT-CWT decomposed as a Markov random field and each pixel of each sub-band has the Markov property, so it is possible to achieve the optimal segmentation of each sub-band by using the above the MRF segmentation algorithm.
3.3 Fusion Rules
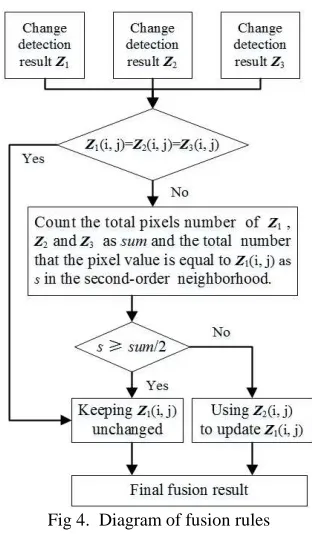
In order to express the change region more accurately, we gain the final change detection result by fusing Z1, Z2 and Z3. Firstly, Judging whether the value of Z1(i, j), Z2(i, j) and Z3(i, j) is same, and if so, keeping the value of Z1(i, j) unchanged, or counting the total pixels number of Z1, Z2 and Z3 as sum and the total number that the pixel value is equal to Z1(i, j) as s in the second-order neighborhood. Then, Judging whether s is larger than or equal to sum/2, and if so, keeping the value of Z1(i, j) unchanged, or using the value of Z2(i, j) to update Z1(i, j). The flowchart of fusion rules is shown in Figure 4.
Fig 4. Diagram of fusion rules
4. EXPERIMENTAL RESULTS AND DISCUSSION
4.1 Data Sources
Since the surface cover changes are very complex in different periods, it is usually to use high-resolution remote sensing images in experiment. In order to verify the accuracy and stability of the DTCWT-MRF-Bayes change detection algorithm proposed in this article, we select high-resolution optical remote sensing images from various sensors, where the two sets of ZY-3 satellite images are numbered I, II. Detailed data introduction is shown in table I below.
manually by directly observing the difference between the two original images and observing the difference images. The images of each group of tests are shown in Figure 5, 6, 7, and 8, respectively. All the images with (a) show the phase 1 images,
all the images with (b) show the phase 2 images, all the images with (c) show the reference change images, where registration error between two phase images is less than 1 pixel.
Tab. I Data Information
Type Time Place Size Bands
ZY-3 Images-I 2014.12 Huang Gang Reservoir in TianJin 448*640 Panchromatic 2015.12
ZY-3 Images-II 2014.10 North River in LiaoNing 576*576 Panchromatic
2015.09
TM5 Images 2000.07 Rondonia State in Brazil 512*512 Multi-channel
(band 4,3,2) 2006.07
Quickbird Images 2012.04 YanZhou city in ShanDong 320*320 Band 3
2012.09
(a) 2014.12 (b)2015.12 (c)reference image Fig 5. ZY-3 images of Huang Gang Reservoir in TianJing
(a)2014.10 (b)2015.09 (c)reference image Fig 6. ZY-3 images of North River in LiaoNing
(a)2000.07 (b)2006.07 (c)reference image Fig 7. TM5 images of Rondonia State in Brazil
(a)2012.04 (b)2012.09 (c)reference image Fig 8. Quickbird images of YanZhou city in ShanDong
4.2 Analysis And Evaluation Of Test Results
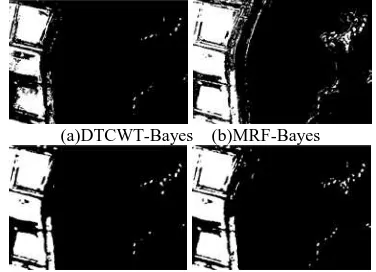
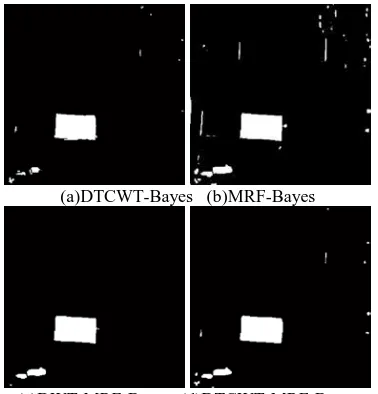
In order to verify the effectiveness of the algorithm, we selected the method of DTCWT-Bayes, MRF-Bayes, DWT-MRF-Bayes and the method proposed to carry out comparative test and analysis. All the algorithms in the paper were operated in Matlab2012a with a configuration of Intel (R) Core (TM) i7, 2.67GHz frequency, 8GB memory. Figure 9, 10, 11 and 12 respectively show the change detection results to section IV. A. where all the images with (a) show the detection result of
method DTCWT-Bayes, all the images with (b) show the detection result of method MRF-Bayes, all the images with (c) show the detection result of method DWT-MRF-Bayes and all the images with (d) show the detection result of method proposed DTCWT-MRF-Bayes.
(a)DTCWT-Bayes (b)MRF-Bayes
(c)DWT-MRF-Bayes (d)DTCWT-MRF-Bayes Fig 9. Change detection results of ZY-3 images of Huang
Gang Reservoir in TianJing
(a)DTCWT-Bayes (b)MRF-Bayes
(c)DWT-MRF-Bayes (d)DTCWT-MRF-Bayes Fig 10. Change detection results of ZY-3 images of North
(a)DTCWT-Bayes (b)MRF-Bayes
(c)DWT-MRF-Bayes (d)DTCWT-MRF-Bayes Fig 11. Change detection results of TM5 images of Rondonia
State in Brazil
(a)DTCWT-Bayes (b)MRF-Bayes
(c)DWT-MRF-Bayes (d)DTCWT-MRF-Bayes Fig 12. Change detection results of Quickbird images of
YanZhou city in ShanDong
1) All the images with (a) from figure 9 to 12 can be clear that the method of DTCWT-Bayes presented serrated to edge detection, and Figure 10 (a) and 11 (a) were shown a large number of undetected areas. Since the multi-scale characteristics of DT-CWT, the detection results are of less noise, and better overcome the sensor noise, but are of the more rough edge detection and more error detection pixels due to that it takes no account of the spatial correlations between pixels.
2) All the images with (b) from figure 9 to 12 can be observed that there are many discrete dots and lines in the detection results based on MRF-Bayes. This can be explained by no adopting multi-scale analysis, which cause that the expression of sudden change information is insufficient and more pseudo-changing information is detected.
3) All the experiment results with (c) and (d) can be seen that the isolated points are significantly fewer and edge detection is more smooth and delicate, these well overcome the effects of sensor noise and registration errors and present good robustness. Besides, we can see the group of (d) is more accurate to the
detection of the edge and tiny sudden change information than the group of (c), the reasons can be explained that on one hand DTCWT-MRF-Bayes, the algorithm proposed, is of more direction expression and on the other hand DWT-MRF-Bayes directly losses all the high frequency information in fusion which loss of large amount of information although can better denoising. In summary, from a subjective point of view, overall change detection performance is the best of the algorithm proposed.
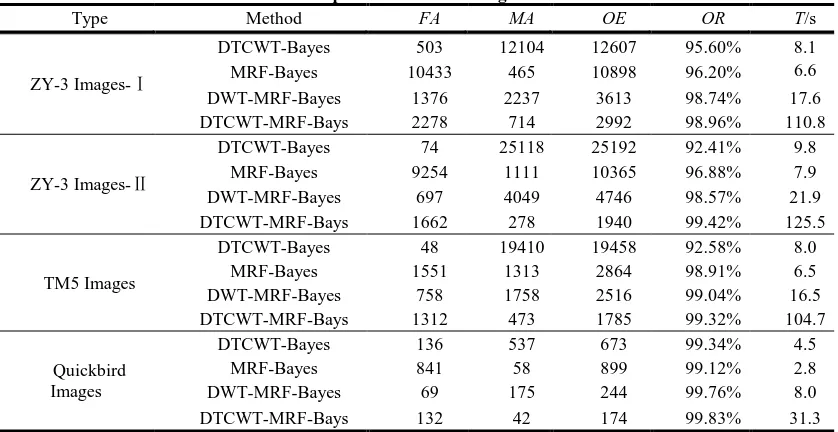
For objective evaluation, taking the number of FA (the number of false alarms), MA (the number of missed alarms), OE (the number of overall error) and OR (overall right rate) and the running time T as the performance evaluation index. Suppose the reference change image is R(i,j), the result image of the final change detection is Z( ji, ), the total number of pixels is S, so each index can be calculated as follows:
∑
= == ( (i,j) 0& (i,j) 1)
FA R Z (6)
∑
= == ( (i,j) 1& (i,j) 0)
MA R Z (7)
MA FA
OE= + (8)
S OE S
OR=( − )/ (9)
In addition, T is the actual running time of each change detection algorithm. The results of the performance comparison of four change detection are shown in table II.
As can be seen from Table II:
1) In all groups of tests, the method of DTCWT-Bayes presents that MA and OE are much higher than the other three methods and FA is smallest except in the test of Quickbird image. These prove that FA can be reduced effectively by introducing DT-CWT to the change detection algorithm, but the phenomenon of missed detection is much serious.
2) In the results of four group tests above, MRF-Bayes shows the biggest FA. Besides, MRF-Bayes shows the smallest MA
except for slightly higher than the method proposed. These prove that MA can be greatly reduced by making full use of the pixel correlation of MRF, but the phenomenon of false detection is much serious.
3) In the three methods with MRF, DTCWT-MRF-Bayes is of the minimum FA, this because it directly loss its high frequency information in the fusion algorithm; In the three methods with wave analysis, DTCWT-MRF-Bayes has the minimum MA, meanwhile DTCWT-MRF-Bayes achieves the minimum OE and the highest OR in four sets of test results, These show that the method proposed has the highest change detection precision.
Tab. II
Performance Comparison of Four Change Detection Results
Type Method FA MA OE OR T/s
ZY-3 Images-Ⅰ
DTCWT-Bayes 503 12104 12607 95.60% 8.1
MRF-Bayes 10433 465 10898 96.20% 6.6
DWT-MRF-Bayes 1376 2237 3613 98.74% 17.6
DTCWT-MRF-Bays 2278 714 2992 98.96% 110.8
ZY-3 Images-Ⅱ
DTCWT-Bayes 74 25118 25192 92.41% 9.8
MRF-Bayes 9254 1111 10365 96.88% 7.9
DWT-MRF-Bayes 697 4049 4746 98.57% 21.9
DTCWT-MRF-Bays 1662 278 1940 99.42% 125.5
TM5 Images
DTCWT-Bayes 48 19410 19458 92.58% 8.0
MRF-Bayes 1551 1313 2864 98.91% 6.5
DWT-MRF-Bayes 758 1758 2516 99.04% 16.5
DTCWT-MRF-Bays 1312 473 1785 99.32% 104.7
Quickbird Images
DTCWT-Bayes 136 537 673 99.34% 4.5
MRF-Bayes 841 58 899 99.12% 2.8
DWT-MRF-Bayes 69 175 244 99.76% 8.0
DTCWT-MRF-Bays 132 42 174 99.83% 31.3
Comprehensively taking subjective and objective point into account, without considering the running time, the algorithm proposed can obtain more accurate change area. Meanwhile, it can well remove noise and keep the edge information of the change region and shows a stronger robustness and visual effect.
Besides, in order to more intuitively understand the practicality of the method proposed in production, take the quickbird images with a size of 2000*2000 for example to do the test. As shown in Figure 13, we can see that the algorithm can effectively detect the change regions. Unfortunately, it takes 18 minutes and 20 seconds which shows quite a long time under the relatively low computer configuration. But, it can be expected that this feasible algorithm proposed will be possible to have a shorter runtime in practical workstation applications.
(a)2012.04 (b)2012.09 (c) change detection result Fig 13. Quickbird images of YanZhou city in ShanDong
5. CONCLUSION
In this paper, unsupervised remote sensing image change detection method is proposed based on the combination between DT-CWT and MRF. Firstly performing multi-scale decomposion to the difference image by making full use of the multi-direction expression, anisotropy and multi-scale properties of DT-CWT, which helps to the expression and analysis of image information and improving the accuracy of change detection. Then the method extracts the change characteristics in high-frequency regions by using the segmentation algorithm based on ICM, and respectively reconstructing the high-frequency and low-frequency sub-bands of each layer which has been processed. After these, it can better balance between noise reduction and the retention of high
frequency information. Finally, we carry out the final iteration and segmentation according to MRF segmentation algorithm. Because MRF segmentation algorithm makes full use of the correlation between pixels, it can not only greatly reduce the false alarm rate, but also well avoid the influence from registration errors. The results of comparative experiment prove that the method proposed looks more smooth and delicate for the edge detection and less noise. In addition, as shown in the table of evaluation index to the four change detection methods, it can be seen that the method proposed is of minimum total number of errors and the highest accuracy rate. In short, the algorithm proposed achieve higher precision and is predominantly robust But it will take much more time due to iterative processes in the algorithm. Therefor how to improve the detection efficiency and analyzing the complexity of the algorithm need further research.
REFERENCES
[1] C. Wu, B. Du, and L. Zhang, 2014. “Slow feature analysis for change detection in multispectral imagery,” IEEE Transactions on Geoscience and Remote Sensing., vol. 52, no. 5, pp. 2858–
2874.
[2] Y. Y. Dian, S. H. Fang, and C. H. Yao, 2014. “The geographic object-based method for change detection with remote sensing imagery,” Geomatics and lnformation Science of Wuhan University., vol. 39, no. 8, pp. 906–912.
[3] F. Bovolo and L. Bruzzone, 2007. “A split-based approach to unsupervised change detection in large-size multitemporal images: application to tsunami-damage assessment,” IEEE Transactions on Geoscience and Remote Sensing., vol. 45, no. 6, pp. 1658–
1670.
[4] T. Celik and K.-K. Ma, 2010. “Unsupervised change detection for satellite images using dual-tree complex wavelet transform,” IEEE Transactions on Geoscience and Remote Sensing., vol. 48, no. 3, pp. 1199–1210.
[6]M. Hao, H. Zhang, W. Z. Shi and K. Z. Deng, 2013. “Unsupervised change detection using fuzzy c-means and MRF from remotely sensed images.” Remote Sens. Lett., vol, 4, no. 12 pp. 1185–1194.
[7] Y. Bazi, L. Bruzzone, and F. Melgani, 2005. “An unsupervised approach based on the generalized Gaussian model to automatic change detection in multitemporal SAR images,” IEEE Trans. Geosci. Remote Sens., vol. 43, no. 4, pp. 874–887.
[8]Y. Y. Dian, S. H. Fang, and C. H. Yao, 2016. “Change detection for high-resolution images using multilevel segment method,” Journal of Remote Sensing., vol. 20,no. 1, pp. 129–137.
[9] G. Moser, S. Serpico, and G. Vernazza, 2007. “Unsupervised change detection from multichannel SAR images,” IEEE Geosci. Remote Sens. Lett., vol. 4, no. 2, pp. 278–282.
[10] S. Marchesi and L. Bruzzone, 2009. “ICA and kernel ICA for change detection in multispectral remote sensing image,” IEEE International Geoscience and Remote Sensing Symposium., vol. 2, no. 1, pp. 980–983.
[11] Y. Q. Wu, Z. Q. Cao and F. X. Tao, 2015. “Change detection of remote sensing images by multi-cale geometric analysis and KICA,” Journal of Remote Sensing., vol. 19, no. 1, pp. 127–133.
[12] F. F. Xin, L. C. Jiao, G. T. Wang and H. L. Wan, 2012. “Change detection in multi-temporal remote sensing images based on the wavelet-domain hidden Markov chain model,” Journal of Xidian University: Natural Science., vol. 39, no. 3, pp. 43–49.
[13] A. Ghosh, N.S. Mishra and S. Ghosh, 2011. “Fuzzy clustering algorithms for unsupervised change detection in remote sensing images,” Information Sciences., vol. 181, no. 4, pp. 699–715.
[14] M. Gong, L. Su, M. Jia and W. Chen, 2014. “Fuzzy clustering with a modified MRF energy function for change detection in synthetic aperture radar images,” Fuzzy Systems IEEE Transactions on., vol. 22, no. 1, pp. 98–109.
[15] B. Xiong, Q. Chen, Y. Jiang and G. Kuang, 2012. “A threshold selection method using two SAR change detection measures based on the Markov random field model,” IEEE Geoscience and Remote Sensing Letters., vol. 9, no. 2, pp. 287–291.
[16] C. C. Li, X. D. Qi and G. S. Zhang, 2013. “A study on SAR image change detection based on MRF models,” Modern Radar., vol. 35, no. 7, pp. 31–35.
[17] C. C. Li, G. S. Zhang, H. D. Li and D. D. Li, 2014. “A study on SAR image change detection based on improved Markov random field models,” Modern Radar., vol. 36, no. 9, pp. 36–39.
[18] L. Bruzzone and D. F. Prieto, 2000. “Automatic analysis of the difference image for unsupervised change detection,” IEEE Transactions on Geoscience and Remote Sensing., vol. 38, no. 3, pp. 1171–1182.
[19] T. Celik, 2010. “A Bayesian approach to unsupervised multiscale change detection in synthetic aperture radar images,” Signal Processing., vol. 90, no. 5, pp. 1471–1485.
[20] K. Venkateswaran, N. Kasthuri, K. Balakrishnan and 2013. “Change Detection in Synthetic Aperture Radar Images Using Contourlet Based Fusion and Kernel K-Means Clustering,” International Journal of Advanced Remote Sensing and GIS., vol. 2, no. 1.
[21] A. M. Lal, S. M. Anouncia and Gopalakrishnan, 2015. “Multispectral image change revealing using Translation invariant wavelet transform fusion and Adaptive k-means clustering,” International Journal of Applied Environmental Sciences., vol. 10, no. 2, pp. 681–693.
[22] W. P. Wang, H. Y. Zhou, Y. G. Hu and J. Q. Wang, 2007. “Detection of target change in SAR images based on cluster analysis,” Transducer and Microsystem Technology., vol. 26, no. 9, pp. 76–78.
[23] W. Gu, Z. Lv and M. Hao, 2015. “Change detection method for remote sensing images based on an improved Markov random field,” Multimedia Tools and Applications., pp. 1-16.
[24] F. Baselice, G. Ferraioli and V. Pascazio, 2013. “Markovian change detection of urban areas using very high resolution complex SAR images,” IEEE Geoscience and Remote Sensing Letters., vol. 11, no. 5, pp. 995-999.
[25] C. Benedek and T. Sziranyi, 2009. “Change detection in optical aerial images by a multilayer conditional mixed Markov model,” IEEE Transactions on Geoscience and Remote Sensing., vol. 47, no. 10, pp. 3416–3430.
[26] N. Kinsbury, 1998. “The dual-tree complex wavelet transform: A new efficient tool for image restoration and enhancement,” European Signal Processing Conference., pp. 319-322.
[27] N. Kinsbury, 2001. “Complex wavelets for shift invariant analysis and filtering of signals,” Applied and Computational Harmonic Analysis., vol. 10, pp. 234–253.
[28]H. Zhang, W. Shi, Y. Wang an
based Markov random field approach for classification of high spatial resolution multispectral imagery,” Geoscience & Remote Sensing Letters IEEE., vol. 11, no. 2, pp. 489–493.
[29] X. L. Wei and W. M. Shen, 2010. “Gabor-MRF model based on color texture image segmentation,” Geomatics and lnformation Science of Wuhan University., vol. 35, no. 8, pp. 955–958.