ANALYSIS OF MOBILE LASER SCANNING DATA AND MULTI-VIEW IMAGE
RECONSTRUCTION
Christian Briesea,b, Gerald Zachc, Geert Verhoevenb,d,e, Camillo Ressla, Andreas Ullrichc, Nikolaus Studnickac, Michael Doneusd,b
a
Institute of Photogrammetry and Remote Sensing of the Vienna University of Technology, Austria - cb@ipf.tuwien.ac.at
bLBI for Archaeological Prospection and Virtual Archeology, Vienna, Austria c
RIEGL Laser Measurement Systems GmbH, Horn, Austria
d
Vienna Institute for Archaeological Science, University of Vienna, Austria
eDepartment of Archaeology, Ghent University, Belgium
Commission V, Working Group V/3
KEY WORDS:Mobile, Laser scanning, LIDAR, Photogrammetry, Georeferencing, Reconstruction, Comparison
ABSTRACT:
The combination of laser scanning (LS, active, direct 3D measurement of the object surface) and photogrammetry (high geometric and radiometric resolution) is widely applied for object reconstruction (e.g. architecture, topography, monitoring, archaeology). Usually the results are a coloured point cloud or a textured mesh. The geometry is typically generated from the laser scanning point cloud and the radiometric information is the result of image acquisition. In the last years, next to significant developments in static (terrestrial LS) and kinematic LS (airborne and mobile LS) hardware and software, research in computer vision and photogrammetry lead to advanced automated procedures in image orientation and image matching. These methods allow a highly automated generation of 3D geometry just based on image data. Founded on advanced feature detector techniques (like SIFT (Scale Invariant Feature Transform)) very robust techniques for image orientation were established (cf. Bundler). In a subsequent step, dense multi-view stereo reconstruction algorithms allow the generation of very dense 3D point clouds that represent the scene geometry (cf. Patch-based Multi-View Stereo (PMVS2)). Within this paper the usage of mobile laser scanning (MLS) and simultaneously acquired image data for an advanced integrated scene reconstruction is studied. For the analysis the geometry of a scene is generated by both techniques independently. Then, the paper focuses on the quality assessment of both techniques. This includes a quality analysis of the individual surface models and a comparison of the direct georeferencing of the images using positional and orientation data of the on board GNSS-INS system and the indirect georeferencing of the imagery by automatic image orientation. For the practical evaluation a dataset from an archaeological monument is utilised. Based on the gained knowledge a discussion of the results is provided and a future strategy for the integration of both techniques is proposed.
1 INTRODUCTION
In the last years laser scanning (LS) with its active direct 3D mea-surement principle established itself as a widely used data ac-quisition method for the dense sampling of objects and complete scenes resp. landscapes (?). LS can be utilised in static (terrestrial LS (TLS)) or kinematic (airborne (ALS) or mobile LS (MLS)) mode. While TLS can be used for the detailed documentation of a certain area of interest, ALS and MLS can be utilised for large area mapping tasks. TLS data is typically georeferenced by in-direct techniques with control and tie points (e.g. retro-reflective targets or tie spheres), whereas ALS and MLS require the direct georeferencing of the moving sensor coordinate system based a position and orientation (POS) system. POS systems typically consist of a global navigation satellite system (GNSS) receiver and an inertial navigation unit (INS). Next to an adequate abso-lute georeferencing accuracy the resulting observed position and orientation of the platform has to be synchronised with the simul-taneous LS observations and possible image data. The georefer-encing of the resulting point cloud based on the POS observations can be further improved by adjustment techniques based on tie features (e.g. control and tie planes, cf. (?), (?)). Subsequently, the surface reconstruction (filtering, interpolation, etc.) can be determined based on the georeferenced point cloud.
Besides the developments in the field of LS data acquisition and processing research in computer vision and photogrammetry lead to advanced automated procedures in image orientation and im-age matching. These methods allow a highly automated gen-eration of 3D geometry based on image data. The automated
image orientation is founded on advanced feature detector tech-niques. In the last years a variety of feature detector techniques like SIFT (Scale Invariant Feature Transform, cf. (?)) has been developed to describe, analyse and match images, see (?). An im-portant impact for 3D reconstruction computer vision algorithms was gained by so-called structure-from-motion (SfM) algorithms. SfM allows to reconstruct 3D scene geometry and camera motion from a sequence of 2D imagery captured by a camera moving around the scene, cf. (?); (?). To do this, the SfM algorithms use image matching to detect image feature points and subsequently monitor their movement throughout the sequence of multiple im-ages. Using this information as input, the locations of those fea-ture points can be estimated and rendered as a sparse 3D point cloud. As the SfM heavily depends on the accurate knowledge of camera positions, estimating the latter is one of the core com-ponents in SfM, cf. (?); (?). Using the output of these SfM al-gorithms (i.e. the sparse point cloud and the camera positions, orientation, and calibration parameters) as input, computer vi-sion algorithms known as dense multi-view stereo (MVS) recon-struction algorithms can generate very dense 3D point clouds that present the majority of geometric scene details (?). Besides the software Patch-based Multi-view Stereo (PMVS21), which is an example of a widely used free multi-view stereo software pack-age, these techniques also start to become implemented in low-cost software packages (?), enabling the creation of 3D models even from very unordered image collections.
This paper focuses on the analysis of MLS data and
simultane-1
ously acquired imagery from the same moving platform. In the following section 2 the utilized sensor equipment is presented, whereas section 3 focuses on the actual data acquisition campaign that is used for the analysis of both data sources. Furthermore, this section summarises the individual processing steps for the MLS and image data. The evaluation of the current results is pro-vided in section 4 and is dipro-vided into a part that focuses on the georeferencing result (cf. subsection 4.1) and a further part that discusses the surface model generation (cf. subsection 4.2). Sec-tion 5 concludes the paper and provides an outlook into future research directions.
2 THE MLS SYSTEM
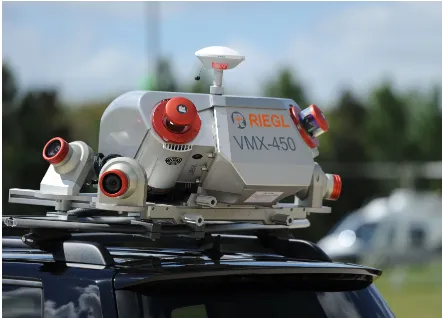
Within this study data from the RIEGL MLS system VMX-450 (see figure 1) was utilised. The hardware of the VMX-450 con-sists of two RIEGL VQ-450 laser scanners, a camera system, a portable control unit box, and an GNSS/INS-unit which com-prises the electronics for real-time kinematic (RTK) measure-ments and three sensors: the INS, a GNSS receiver including an-tenna, and a wheel sensor (distance measuring indicator, DMI). Furthermore, a modular camera system VMX-450-CS6 is also part of the hardware. The RIEGL VQ-450 laser scanners and the GNSS/INS-unit are rigidly attached to a stable mounting platform which can be mounted on a vehicle. A single cable connects this measuring head to the control unit box. It is housed in a com-pact case and contains the power supply, an embedded computer running the RiACQUIRE software package for data acquisition, removable hard drives, and a touch-screen providing a convenient control interface for the operator. During acquisition, both laser scanners are operated synchronously, thus taking 3D measure-ments at the double measurement rate of a single scanner. Further key data of the system can be found in table 1.
The VMX-450-CS6 camera system complements the acquisition of LS data with the recording of high-resolution color images. Up to six individually selectable, fully calibrated digital color cameras with electronic shutters can be integrated. Each of these industrial cameras is encased in a robust aluminium housing al-lowing reliable operation under adverse conditions. Image trig-gering can be parametrised individually for each camera either time-based or distance-based. When the picture is captured, the camera sends a strobe signal which is precisely time-stamped by the electronics of the camera system. In conjunction with the known mounting parameters, precise position and orientation of the cameras are defined over time. Camera control and image data recording is completely managed by the acquisition soft-ware embedding the pictures into the project structure together with the scan data. The accurately time-stamped images can be used to color the scan data, but are also the basis for photogram-metric processing. The cameras can be attached to the mounting frame and oriented individually to meet the requirements of the current application. A single cable connects the camera system to the VMX-450 measuring head. A robust mechanical connection between these two components guarantees a stable mounting of the camera system with respect to the laser scanners while main-taining the modularity and portability of the whole system at the same time. An additional PC embedded in the control unit is re-sponsible for acquiring image data and storing it on three more hard disks. Although the camera system is designed for use with the cameras offered by RIEGL, also models from other manu-facturers, for example digital single-lens reflex (D-SLR) cameras and infrared cameras or spherical camera solutions, can be inte-grated.
Figure 1: RIEGL MLS system VMX-450.
Effective measurement rate up to 1100000 points/s Max. measurement range 800 mρ >80 % and 300 kHz 140 mρ >10 % and 1.1 MHz Scan rate (selectable) up to 400 lines/sec Laser Class 1 (eyesafe) Multi target capability yes Position (absolute) typ. 20-50 mm Position (relative) typ. 10 mm Roll, Pitch, Yaw 0.005◦, 0.005◦, 0.015◦
Number of cameras up to 6 Resolution 5 megapixels Lens / FOV 5 mm / 80◦*60◦
Camera frame rate up to 4 fps
Table 1: Specifications of the MLS system RIEGL VMX-450.
3 MLS DATA ACQUISITION AND DATA PROCESSING OF THE TEST SUITE
For the analysis of the MLS and image data we have selected the Roman monument called ”Heidentor”, part of the archaeo-logical site of Carnumtum (Austria). This monument measures approx. 15 m by 15 m and has a height of approx. 14 m (?). Fig-ure 2 illustrates the Heidentor during the data acquisition with the RIEGL VMX-450 system on the 29thof March 2012. The data acquisition with inner (through the monument) and outer tracks around the monument took approx. 22 minutes (including the cal-ibration and initialisation of all on board sensors). A data acqui-sition speed of approx. 10 km/h and an approx. object distance of 10 - 15 m was selected in order to cover the complete monument and to guarantee a sampling of the object surface of 1 point/cm2
. The cameras were triggered to acquire an image every 3 m. The camera exposure was fixed to 1 ms with an automatic gain. All in all approx. 64.5 million laser points were recorded and with the attached 4 cameras 1156 images were acquired.
After data acquisition the MLS trajectory was processed and the MLS point cloud was determined with the RIEGL software RiPro-cess2. The recorded image data is available in the raw pgm
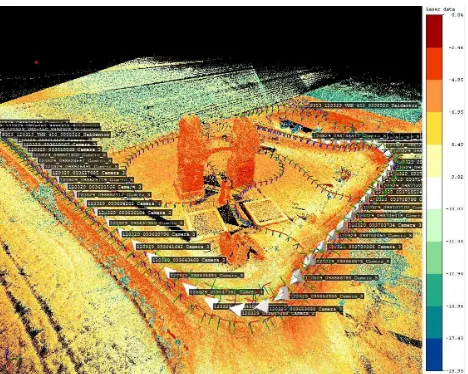
(port-able graymap)-format. In order to generate RGB images a de-bayering, executed with the help of the software RiProcess, has to be applied. This results in RGB images in the file format jpeg (compressed). An overview of the acquired MLS data can be seen in figure 3. Before the data acquisition there was a perfect covered sky (constant ilumination conditions), but during the data acquisition the sun penetrated the cloud layer and unfortunately
2
many of the images are affected by bad lighting conditions (deep shadows and bright highlights). In order to enhance the image quality for the subsequent image orientation and dense match-ing task the shadows were brightened and some sharpenmatch-ing was added. These post-processing steps were necessary, as the imag-ing conditions were very unfavourable and the dynamic range of the scene largely surpassing that of the imaging sensor.
For the subsequent image orientation and surface model gener-ation 165 images were selected and imported into the software PhotoScan3, a 3D reconstruction package form the Russian
de-veloper Agisoft build around structure from motion (SfM) and dense matching, cf. (?); (?); (?). After uploading all 165 views in PhotoScan, image feature points are detected in all the source im-ages. Although the algorithm is developed by Agisoft, it is simi-lar to the well-known SIFT algorithm developed by (?), since the features are also stable under viewpoint, scale and lighting varia-tions. Based on its local neighbourhood, each point gets its own local descriptor which is subsequently used to detect point cor-respondences across the complete image set. The latter process was sped-up by taking the positions of the camera stations into ac-count: highly accurate D-GNSS positional data that could be ex-tracted from the Exif image metadata. Furthermore, this informa-tion allowed to define the same coordinate frame for the images as for the original MLS data. Using the correspondences between the image features as input, the locations of those feature points could be estimated and rendered as a sparse 3D point cloud. Dur-ing the latter process the camera interior and exterior parameters, which are used for the following evaluation of the georeferencing results in section 4.1, are computed as well. Within this step the available calibrated interior parameters of the cameras were used as a start value and were refined within the adjustment. Once the SfM process was finished, the feature points with the largest reprojection error were deleted and a bundle-block adjustment further refined the camera parameters. This process was repeated a few times to obtain a highly optimised set of interior and exte-rior camera parameters. In the end, only 144 photographs were used for the next processing steps, since some images could not be matched while others had too large positional errors. The re-sulting RMS (root mean square error) of the image positions after bundle block adjustment was 0.030 m, 0.013 m, and 0.015 m for the x-, y-, and z-coordinate, respectively.
After the image orientation, PhotoScan complements the SfM ap-proach with a variety of dense MVS algorithms to compute a dense estimate of the surface geometry of the observed scene. Because these solutions operate on the pixel values instead of on the feature points (?), this additional step enabled the gener-ation of a detailed three-dimensional mesh model. Within Pho-toScan an arbitary object type, an ultra high target quality, and a smooth geometry type was selected. Since the image stations are accurately known in the MLS coordinate reference system, the meshed model should not need any additional referencing. Al-though PhotoScan supports different geographical and projected coordinate reference frames, the output of the mesh in the MLS reference frames failed. Hence, the final meshed model needed to be re-georeferenced in a local reference fame. To this end, four ground control points (GCP) were extracted from the MLS point cloud and treated as local coordinates. After deleting some un-connected faces (i.e. noise), the vertices extracted from the mesh represented the point cloud resulting from the image matching step. This data set is subsequently used for the evaluation of the MLS and imaged based surface reconstruction in section 4.2.
3
http://www.agisoft.ru/products/photoscan/professional/
Figure 2: Study site: Heidentor, Carnuntum (Austria) together with the RIEGL VMX-450 system on top of a car.
Figure 3: Overview of the acquired MLS data of the study site: Heidentor, Carnuntum (Austria). The point cloud is coloured based on the recorded laser reflectance value.
4 EVALUATION
This section provides in subsection 4.1 an accuracy analysis be-tween the direct and indirect georeferencing of the acquired im-age data. Furthermore, an evaluation of the surface models gen-erated by LS and image matching is provided in subsection 4.2.
4.1 Evaluation of the image georeferencing
The image data was georeferenced on one hand by direct geo-referencing based on the GNSS/INS system on board the RIEGL MLS system with the help of a mounting calibration for each of the four cameras. On the other hand 144 images were success-fully oriented and georeferenced by indirect observations within a bundle block adjustment using the software PhotoScan. Within the evaluation the resulting coordinates of the projection centers and the corresponding rotation angles were compared.
were approx. 0.20 m, 0.03 m, and 0.05 m, and the nick, roll, and yaw angle, differed approx. by 0.3◦, 0.1◦, and 0.8◦respectively.
These two images are located next to each other at the begin of the track of the selected images and the image information included a lot of homogeneous background (flat field with a high amount of similar features). This image content might have lead to a lower accurate result which was not detected during the bundle block adjustment just due to wrongly estimated correspondences. For the subsequent accuracy values and histograms these two images were removed and the analysis is just based on the remaining 142 images.
(a) X coordinate (b) Y coordinate
(c) Z coordinate (d) Roll angle
(e) Nick angle (f) Yaw angle
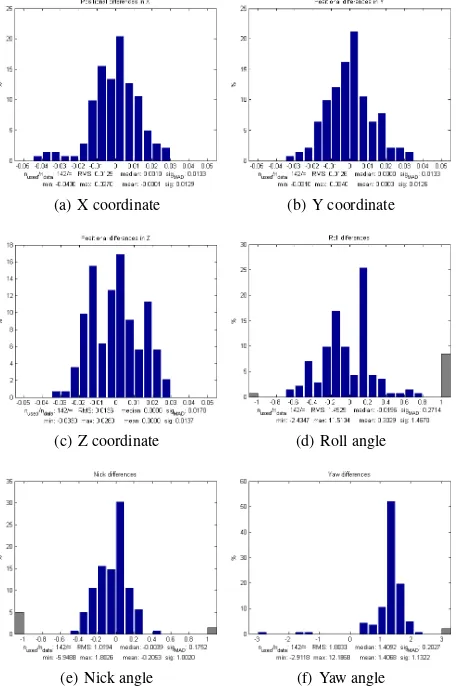
Figure 4: Histograms of the positional (units: meter) and angle (units: degree) differences between direct and indirect georefer-encing of the imagery.
Figure 4 presents histogram visualisations of the differences be-tween direct and indirect georeferencing of the images split into the positional differences for the x-, y-, and z-coordinate and the orientation difference expressed by roll, nick, and yaw dif-ferences. For the x-coordinate the median of the differences is 0.001 m and the standard deviation of the differences is 0.013 m. The values for the y- and z-coordinate are are both 0.000 m for the median with a standard deviation of 0.013m and 0.014 m, re-spectively. The median differences of the roll, nick, and yaw an-gle are: -0.020◦, -0.004◦, 1.410◦; with the corresponding
stan-dard deviations: 1.467◦, 1.002◦, and 1.132◦. While the
posi-tional differences do not show significant systematic errors and the standard deviations of the differences (approx. 0.01 m) cor-respond well to the accuracies from the bundle block adjustment, the differences for the orientation angles show a small system-atic error for roll and nick, but a significant median difference for the yaw component of more than 1◦. The corresponding
stan-dard deviations are all higher than 1◦. When further analysing the
histograms one can see that these high values for the standard de-viation are introduced by a few gross errors (maybe also the result of very close images near the object of interest). By calculating a robust measure for the standard deviation (sigma mad (median absolute deviation)) these values can be significantly reduced to 0.271◦, 0.175◦, and 0.203◦, respectively.
4.2 Evaluation of the surface models
For the first evaluation of the two differently estimated surface models, one model determined based on the LS data and the other based on the image data, a 2.5D strategy was chosen. One of the main facades of the Roman monument was selected for the evaluation.
For the determination of the laser scanner surface model all scan data (for the selected facade 4 individual parts of the trajectory contributed to the data set) of the selected facade was transformed into a 2.5D facade coordinate system. With the resulting 6.9 mil-lion points a 2.5D surface model was generated by a moving planes interpolation with the software OPALS4. Furthermore, a point density model was determined. Figure 5 represents a visu-alisation of the point density model and a shading of the surface model acquired by the laser scanners available with the RIEGL VMX-450 MLS system. In green areas of the point density vi-sualisation the number of points is higher than 25000 points/m2
, while in red areas the number is below 12500 and white areas in-dicate no available LS data. In the densly sampled area the shad-ing of the facade surface nicely represents the individual stones, while in areas with lower sampling the surface representation is less dense or even contains some holes.
(a) Visualisation of the LS point density (units: points/m2)
(b) Shading of the surface model
Figure 5: Selected facade acquired by laser scanner data. Upper image: Visualisation of the point density model; Lower image: shading of the resulting 2.5D surface model.
4
The result of the dense surface matching of the selected facade can be inspected in figure 6. The area is sampled with 6.4 mil-lion of points, which is quite similar to the LS data set. For the point density visualisation the same legend was selected. It can be clearly seen in subfigure 6(a) that the density on the left part of the facade is significantly less than on the right part. Similar to the laser data result, in very densly sampled areas individual stones on the facade can be recognised. However, compared to the LS data result, the structural details seem to be a little bit more smoothed (this can especially seen in the upper part where many small surface details are strongly generalised).
(a) Visualisation of the point density (units: points/m2) from dense image
matching
(b) Shading of the surface model
Figure 6: Selected facade acquired by dense surface matching of the MLS image data. Upper image: Visualisation of the point density model; Lower image: shading of the resulting 2.5D sur-face model.
In order to compare both results analytically a difference model was calculated with OPALS. The resulting visualisation of this model can be investigated in figure 7. The sigma mad of the dif-ferences is about 0.04 m. Difdif-ferences within - 0.01 m and + 0.01 m are light grey, the colors towards blue and red represent increas-ing differences of 0.01 m. At both ends of the legend the differ-ences are above 0.05 m. In general the differdiffer-ences are signifi-cantly lower for the lower part of the facade. Within these lower differences the stone boundaries are clearly visible in the differ-ence models (indicating the assumption that the boundaries are better defined in the LS model). The lower left bigger yellow dif-ference area seems to correspond to the LS point density pattern and most likely indicates higher deviations in the LS data (maybe
a worse estimated trajectory or worse view geometry (narrow in-tersection angle between the surface and the laser beam)). The bigger differences in the upper part seem to be mainly caused by a vertical tilt between the two models which might be intro-duced to the necessary realignment step in PhotoScan (see be-fore, 4 corresponding points for the absoluter georeferencing of the SfM model had to be measured). Further, differences might be the result of the significant smoothing of the surface model generated by image matching, largely due to the absence of suf-ficiently overlapping image data.
In order to get an impression of the actual local differences of both surface models a least squares adjustment (LSM) of the two models was determined by OPALS. For the estimation the de-termination of 12 affine parameters was selected. The resulting difference model after the adjustment of the individual models can be inspected in figure 8. The value for sigma mad of the dif-ferences improved significantly from 0.04 m to 0.01 m and most of the systematic differences in the upper part of the monument could be reduced significantly. The remaining differences are mainly caused by the different surface smoothing (stronger in the SfM model), by the different view geometry, and on sharp edges.
Figure 7: Visualisation of the difference model (units: meter) between the LS and the SfM surface model.
Figure 8: Visualisation of the difference model (units: meter) between the LS and the SfM surface model after LSM adjustment (determination of affine parameters in between the two models).
5 CONCLUSION
platform. This comparison includes on the one hand the analysis of the georeferencing of the image data (direct (utilising the on board POS system) versus indirect georeferencing (by automatic image orientation and bundle block adjustment)) and on the other hand the analysis of surface models either generated by the LS data or from the image data via dense surface matching.
The preliminary results indicate individual strength and weak-nesses. While the indirect georeferencing worked quite well for most of the images that represented sufficient image content, some imagery definitely needs external POS data to achieve an accurate georeferencing (especially for images with homogeneous back-ground with similar features). However, in the case of POS errors or the absence of sufficient GNSS signals automated image ori-entation based on SfM algorithms might allow the determination of the position and orientation of the moving platform. To fulfil this aim sufficient image content and an adequate image quality are essential. During this study it could already be seen that the image arrangement is of the utmost importance. While the im-age orientation and surface matching works typically quite well for images that are specifically acquired for a good geometric re-construction, the surface matching based on constantly triggered imagery delivers sub-optimal results. They do not consider nor adapt to the actual shape of the observed object of interest, hence causing much more problems and reducing the degree of automa-tisation (manual effort is necessary after the automated data ac-quisition campaign to select and adapt the usable image set).
For a further analysis of the MLS data of this study a refined geo-referencing of the laser scanner data set would be necessary. Cur-rently slight systematic differences in between the sampling of the object surface along different trajectories can be recognised. In order to reduce this influence as much as possible a scan data adjustment (e.g. with external control surfaces) would be essen-tial (cf. Scan Data Alignment (SCAL) tool in RiPROCESS for relative adjustment). Furthermore, the data export of the surface models in PhotoScan (right coordinate frame) has to be solved.
MLS systems nowadays allow for a very fast and accurate auto-mated sampling of the landscape, but in certain critical situations (e.g. no GNSS signal within city areas) they may fail or may al-low only a limited data accuracy if the system just relies on the POS observations. Image data that sometimes are just acquired for a colourisation of the point cloud have the ability to support the position and orientation determination of such kinematic plat-forms and furthermore may allow to support the object surface reconstruction. However, in order to optimally support the MLS system with additional geometric information, an advanced data acquisition and processing setup is necessary.
6 ACKNOWLEDGMENTS