Y. Lia,*, L. Zhub, H. Shimamurab, K. Tachibanab a
International Institute for Earth System Science, Nanjing University, Jiangsu, China, 210093,[email protected] b
Pasco corporation, 1-1-2 Higashiyama, Meguro-ku, Tokyo 153-0043 [email protected]
! Modelling, polygon, image, DSM, feature, fitting
!
Automatically detection, extraction and re-construction of 3D building modelling are difficult yet potentially high-payoff challenges for photogrammetric applications. Solution usually requires integrating various sources, including LIDAR, imagery, and digital surface models (DSM). However, highly automated and robust geometric modelling remains unsolved. We will present a 2D modelling technique which represents a building’s outline in an as-is way. It gives visually accurate corners and lines for buildings. Aerial remotely sensed imagery and a DSM are used to detect and segment building masks. A refining footprint modelling is implemented through line modelling, edge refining, and segment merging and generating. A district grouping based main orientation algorithm is proposed. This approach has the ability of successive improvement, moving from a prototype to a subtle end product. Experiments with Japanese data show that the models generated automatically fit the manual models very well.
"
" # $%#
There is an increasing demand of building models in various GIS applications. Remote sensed data provides a cheaper and more effective source for this demand. Yet highly automated and robust building modelling remains a problem unsolved. Large-scale production of building models greatly rely on 2D digital line graph data (DLG) that are generated interactively, while the 3D models are automatically derived using reliable tools provided by softwares like TerraScan (TerraSolid, 2011) CyberCity Modeler (Gruen, 2003) PhotoModeller (Zlatanova 2011) on the base of the 2D DLG. Generating the DLG or the 2D model usually take most of the workload in any building mapping projects. Especially for the large amount of remote sensed data, manual processing of the 2D modelling by fewer workers is unpractical. So the automatically modelling with fewer parameters or interactions is mostly needed.
"& '(%#') *' '%*+,'
"&" Building extraction
Building extraction technology uses computer science including image processing, pattern recognition on single or multiple images to detect and extract the information of a building, such as contour, shape, location or height. Segmentation, feature detection can be used singly or integrated. In early years, researchers generally use image singularly to make it. For instance, in 1990s, Irvin etc. proposed an idea extracting buildings by their shadows (Irvin 1989). Off-terrain objects have shadows if no other height data shadow can directly but partly indicate the height information. When there are more data sources available, multi-source data based methods become popular. In conclusion, the building extraction technologies can
be divided approximately into two big categories, no matter for imagery only or for multiple data.
Region growing (Lari 2007) texture segmentation (Kim 1999, Levitt 1997), dynamic contour (Fazan 2010) including level set (Hao 2010) belong to this type. Some methods only partition the image into regions. Further recognition or classification (Stassopoulou 2000, Baatz 1999) is needed to tell which ones are buildings. For texture analysis it is difficult to get a clear edge between man-made and non man-made terrain. So it is not proper to use this method for building modelling in high resolution imagery. For large scale imagery, the intensity or color of building roofs can vary extremely and can ruined the segmentation.
For better interpretation of a building, feature based detections are mostly studied. Among all the features, line is the most important one to identify the buildings. Grouping process (Lin 1998, Lee 2003) is proposed using the edges and line segments derived from the image to group according to their spatial relations. Because no restraint is given to a building area, this kind of methods will be affected sensitively by the thresholds. Moreover, in resolutions higher than 0.5m there will surely are more lines of ridges which are not parallel each other.
"&"& )'(( - '#, )
There is numerous building modelling theorems. In 2D case, some studies assume that the house is composed by several parts, and each one is modeled separately as a few of given primaries, called parameterized methods (Tseng 2003, Braun 1995, Chow 2003). Others take the roof as several planar which can be extracted from the data without certain shape of models (Laramee 2003. For our case, we would like to consider the contour polygon firstly. So the planar detection based methods won’t be employed.
". ' '%*+, #* )/+#
The study site is in Tokyo, Japan. Because of the high density of population of Japan, the residential areas are full of houses. The houses connect each other and remain almost no space between them. Therefore, the biggest difficulty is separate the houses. Considering the house roof generally has some ridge or peak DSM is used to detect these local highest points which will be used to segment the houses. We have visual light air-born imagery with blue, green, red and near infrared spectrum. DSM for the same area is available and rectified with the imagery. A method of extracting and modelling 2D building outline is proposed in this paper, which is depicted generally in part 2. The segmentation of image-DSM pair to obtain the building objects will be described in part 3, while the outline modelling will be introduced in part 4. The result of the data of Tokyo using our method will be displayed in part 5.
&" 0
For super cities like Tokyo, millions of houses require accurate yet efficient building extraction and modelling system. As we know, DSM provides orthogonal height values of the terrain which is not available by RGB image. It is free from color or material reflection. It makes things simple so that makes it free from misunderstood by non-uniform lighting, shade or shadow. Sometimes the simple one is the effective one. The question is, the spatial accuracy of the DSM is much lower than RGB images. Even for radar or LiDAR derived DSM, the accuracy is not as good as imagery because of lack of some details. For sophisticated building modelling, DSM singular is not enough. Efficient employing of image is necessary. Thus there are so many literatures about the integrated using of DSM and imagery (Rootensteiner 2003, Guo 2003, Franz 2003). We have matched image-DSM pair at hand. We can generate the candidate area of the buildings from DSM and project them to the image to search more accurate features of the buildings.
We have studied a high efficient marker controlled watershed MCW and LSNAT segmentation on DSM which can extract both small dense houses and high or large buildings. This result will be used here as masks of grouping building parts PPOs derived from image. The grouping of PPOs guarantees the accurate edge and component of a building. Based on the building contour, a modeling process of corner extraction, orientation estimation, and refining line model is proposed. The technique can be described by the block diagram of Fig.1
Figure 1 Block diagram of 2D building outline modelling method neighbours. MCW is the best proper method for this goal. Because the accuracy of DSM in both planar and vertical direction is not compactable with visible image in the same resolution, the rough building extracted from DSM only give the approximated locations and shapes of the buildings. The more accuracy building contour is expected to be extracted from the image. Buildings extracted from DSM, called masks, are the references to group the segmentation objects into buildings.
Figure 2 Flow chart graphic interpretation
Small scale pixel aggregation on the image is employed to generate a basic pure pixel object (PPO), which should only cover one unique feature. Building blocks segmented by MCW are taken as masks to integrate the PPO to a building footprint. NDVI is used to remove vegetation objects from the PPO filtered by building masks. These integrated PPOs compose a building footprint which has quite high accuracy in terms of the shape, as shown in Fig.2.
:
Pure pixel is a kind of relative concept. Generally it refers to pixels reflecting single attribute in a region. For example, an area of forests which contains a certain type of tree, or area which contains river water. In low or medium resolution remote sensed imagery, a lot of pixels reflect mixture of the spectrum of multiple terrain targets. In urban and high resolution imagery case, visual interpretation can easily recognize the pure pixels. If we define relatively small set of target, most pixels can be taken as pure pixel belonging to a certain class, such as roof, wall, road, road shoulder, line, bridge, tree, water, or band. Some uncertain pixels exist, normally not for building structure. Therefore, we can group the connecting identical pure pixels as a uniform area called pure pixel object (PPO), and process the image in term of these PPO to reduce the computation load and random error caused by single pixel. To do this, we employed a well known software of object-oriented segmentation named eCognition in small scale threshold. eCognition merges a pair of neighbouring objects with the least dissimilarity in sense of spectrum and shape in each iteration, when pixel is taken as the initial object. The whole image pixels will be grouped as many objects of uniform features. Greater threshold gives larger average size of the objects and less number of them. Of course, objects under small threshold are more likely “pure”. RGB International Archives of the Photogrammetry, Remote Sensing and Spatial Information Sciences, Volume XXXIX-B3, 2012
image with 20cm resolution generally require 10 to 20 scale threshold to get relatively PPOs.
:
Building blocks segmented from DSM are taken as masks to integrate the PPO to a building footprint. Mask usually has fatter area than the building in RGB according to our processing. Some other PPOs like street or ground may be covered or partly covered by it. So the mask should be eroded to a smaller area to make sure that each object covered by the mask is a part of the building.
:
There always are some small trees planted along the walls of a house in Japan. The PPOs filtered by building mask sometimes include one or two of them. A threshold of NDVI is used to remove these objects. The remaining building PPOs are grouped to compose a building footprint which has quite high accuracy in the sense of both shape and location.
:
In tree eliminating, some PPOs of building may be taken as tree objects and be excluded. This error can be fixed by region fullness processing. That is, a fullness measure is defined as the ratio of the building footprint to the building mask. For those under a certain value, object based region growing is implemented. The neighbouring PPOs covered by the mask within certain hue difference will be taken as building PPOs.
2" &
Objective: a polygon for a building. The as-is polygon model is subject to a square constraint, thus the modelling process becomes a problem of optimization. Neighbouring lines of the polygon are perpendicular to each other in the modelling process. The line is fitted to the maxima of the intensity gradients. Corners are generated initially by corner detection and then dynamically added or merged during the iteration. The whole procedure is entirely automated.
2" % * ' #%# 3% *
:
The pair of main orientation of a building is represented by angles
α β
, , and subject to |α
−β
| 90; ,=α β
∈ −( 90, 90). It is observed that houses are usually built along a certain orientation for a natural neighbourhood. Almost all the studies consider this in their own ways. Primitive based methods directly use models subject to the principle in the procedures. Many others fit the line features with this constrains. We adopt the latter idea since we have corners and lines extracted and connected from the image.:
A house’s orientation is estimated according to the whole neighbourhood rather than to a singular house. In direction fitting for a single house, the corners can be used to estimate are relatively less. Sometimes the direction estimation has obvious error. For a region with many houses, the direction errors are not uniform, so that the models display a mass. Block direction pair clustering (BDPC) is developed to classify the neighbourhoods into several groups. Neighbourhood orientation is estimated relatively and assigned to each house belonging to it.
BDPC algorithm can be described in Fig. 3. The distance of a pair of buildings is defined as the shortest distance between the
contours of the two buildings. The distance of each pair of buildings is calculated. The district is grouped according to the cluster which is computed on distance matrix. The main orientation of a district is estimated using all the slopes of the lines in this district by angle histogram. There will be two peaks for a district, which has difference of 90 degree.
Figure 3 main orientation estimation
This technique increases the accuracy significantly, because larger samples give more robust estimation. Fig 4 shows a modelling result for a test sample district naming data1 using BDPC. Fig. 4 shows the building PPO (a) and the groups of the district (b) in various colour. The district division is not so correct for the houses arranged as one row in the middle of the scene. Some of them are falsely classified as their neighbouring blocks, so their orientation estimations are wrong. Fig. 5 displays the detected district orientation by the same colour with that in Fig. 4 superimposed on the angle histogram respectively. Each of the figures shows approximately two-peaks distribution of the angles, which different by about 90 degrees. The two peaks corresponding to the main orientation couple for this district.
(a) Building PPOs
(b) District orientation Figure 4 District grouping
(a) District 1 (b) District 2 Figure 5 Main orientations for districts in Fig 4
2"& / () - /#( ' )'((
-Refer to Fig. 1, the building outline modelling include several main steps: corner detection, main orientation estimation, line modelling, etc. Main orientation derived from line connecting between corners by angle nearest neighbouring. Building model is defined as a polygon, which is described by corners but transferred to a curve of it. Corner is defined as the points with local maximal curvature of the curve (Mokhtarian 1998).
:
A line segment is represented by a line equation
=
+
(1) calculated by the midpoint coordinates of0( ) and slope . :
When the main orientation angle is determined, the lines must be rearranged to subject to the orientation, parallel or perpendicular. The model parameters should be recalculated. The location of the lines will be adjusted in this process to fit pixels here) are reunited into a single segment ( ) , whose intercept
( )
is re-calculated according to updated midpoint0
( )
which is re-located by the average of the original two midpoints0( ) and 0( +1) and re-refined according to the
refining algorithm. The numbers of the following lines after 1
+ are reduced by 1.
For two neighbouring parallel line segments ( ) and ( +1) beyond this distance, a new line segment is inserted as ( +1) which is perpendicular with them. Other segments’ indexes are increased by 1. The inserted segment equation will be
( 1) ( 1) by the average of the two midpoints of the original parallel segments and refined according to the refining algorithm.
A building then is represented by a polygon with the refined corners as the vertices. They are calculated by the intersections of the neighbouring modelled lines.
4"
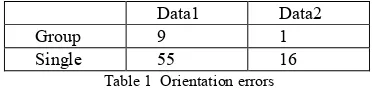
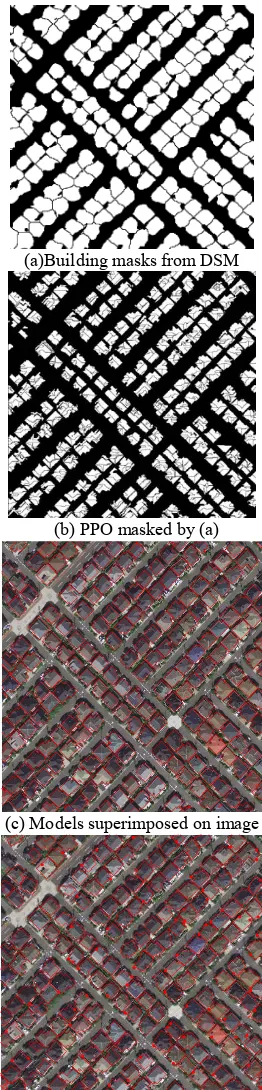
Besides of data1, a large set of data of Tokyo naming data2 was worked and some of the results are displayed in Fig. 6 and Fig. 7. Fig. 6 (a)-(c) shows the results in several stages of the algorithm for a dense residential area. There is one class detected and one main orientation estimated. For comparison, Fig. 6 (d) shows the polygons modelled once at a time. Due to less of samples for orientation estimation, the building polygons hardly match the real houses and display random errors. The comparison of the obviously wrong orientation (over 10 degree deviation) for the singly modelled result with proposed one is listed in Tab. 1 for data1 and data2.
Data1 Data2
Group 9 1
Single 55 16
Table 1 Orientation errors
We also compared the models derived automatically using our algorithms with that made manually and display them superimposed in Fig. 6 (e). Some buildings on the four edges of the image sample are not extracted or not entirely modelled, because of the modelling algorithm doesn’t consider this situation. For the houses wholly display in the image, the locations are highly correct and the outline shapes are very fitting. There are totally 186 houses which can be recognized from this area. Only one was not extracted. Among 169 with whole shape and close to whole shape buildings, there are 6 models have area error lower than 80%, where 4 models locate at the edges and have close to whole shapes. There are 4 models have are error lower than 90%. Most edges of the houses deviate 1 to 3 pixels. For better visualization effect the corners and models of a patch of this area are illustrated in Fig. 7.
For evaluation, the numbers of correctly extracted houses and correctly modelled houses were counted, as in Tab. 2. A house with more than half its shape is taken as a whole house. There is some false merging occurring in the left part of data 1, where large buildings and small houses are mixed. This is caused by NDSM generation International Archives of the Photogrammetry, Remote Sensing and Spatial Information Sciences, Volume XXXIX-B3, 2012
algorithm. Experiments prove that no crossing false clusters occurred for any data at any parameters. The only possible question is more or less clusters. For the quality of the clustering considering their orientation correctness, by visually determination, a deviation of less than 10 degrees is tolerable, and is not taken as an error. The orientation correct rate is defined as the number of correctly oriented houses divided by the extracted houses, as shown in Tab. 2.
(a)Building masks from DSM
(b) PPO masked by (a)
(c) Models superimposed on image
(d) Polygons modeled once at a time
(e) Models (in blue) and manual polygons (in yellow)
Figure 6 Stage results of the sample data
Figure 7 Corner and model details
Data1 Data2
Extracted 111 163
Error oriented 9 1
Orientation Correct rate 91.89% 99.38%
Tab. 2. Performance for the data sets
5"
We developed a method of 2D building modelling based on human knowledge to the houses. It starts from DSM-image pair and end to polygon description. The whole work flow includes PPO grouping for building extraction, model hypotheses, feature detection, model refining. In each stage, some new technique or algorithm are developed. They make every step giving correct and accurate result. That is, the edges or lines fit that in the image very well. More work will be done for the refined modelling for a single house.
'6'*' +'
Baatz, M. and Schape, A. 1999, Object-oriented and multi-scale image analysis in semantic network. ! " #
! $
, August 16th-20th.
Braun, C., Kolbe T.H., Lang F., Schickler W., Steinhage V., Cremers A.B., Förstner W., and Plűmer L., 1995, Models for photogrammetric building reconstruction, % & , 19(1): 109–118.
Chow T.T., Clarke J.A., and Song C.L., 2003, The role of primitive part modelling within an integrative simulation
environment, ' ! !( )
' * + , +August 11-14, pp. 187-194.
Fazan A. J. and Poz A. P. D., 2010, Building roof contours extraction from aerial imagery based on snakes, and dynamic
programming, !& #-.- /
( , Australia, 11-16 April 2010.
Franz R, John T., 2003, Building detection using lidar data and
multispectral images, ) ,
12:673-682.
Gruen A., Zhang L., Wang X., 2003, 3D city modelling with TLS (Three-Line Scanner) data+ ! ) *
+ !
, Vol. XXXIV-5/W10.
Guo T., 2003, City modelling using high-resolution satellite image and airborne laser scanning, Tokyo University.
Hao T., Yang J., Wang Y., etc, 2010, Towards automatic building extraction: Variational level set model using prior shape knowledge. ) ) , 36(11): 1502-1511. Irvin, R.B., McKeown, D.M. 1989, Methods for exploiting the relationship between buildings and their shadows in aerial imagery. !''' 0 + 1 + . 19(6): 564-1575. Kim, T., Vision, J., Muller, P., 1999, Development of a graph-based Approach for Building Detection. ! 2
, 17: 3-14.
Laramee R. S., Jobard B., Hauser H., 2003, Image space based visualization of unsteady flow on surfaces,
.3 !''' 2 $ .
Lari Z., Ebadi H., 2007, Automated building extraction from high-resolution satellite imagery using spectral and structural information based on artificial neural networks, !
,4 .
Lee D.S., Shan J., Bethel J.S. 2003, Class-guided building
extraction from Ikonos imagery, '
, 69(2): 143-150.
Levitt S., Aghdasi F. ,1997, Texture measure for building recognition in aerial photographs. !'''
.COMSIG 560 .556
) ✁9-10 Sept.1997, 75-80.
Lin, C., Nevitia, R. 1998, Building detection and description from a single intensity image, 2 !
7 , 72(2): 101-121.
Mokhtarian F., Suomela R., 1998, Robust image corner detection through curvature scale space, !'''
) 1 ! ✁20(12), pp.
1376-1381.
Rootensteiner E, Jansa J. , 2003, Automatic extraction of buildings from lidar data and aerial images. 0! + 2 0 !2+ + & .
Stassopoulou et al. 2000, Automatic extraction of building statistics from digital orthophotos, ! 8
& ! , (8): 759-841
Tseng, Y.-H, Wang S., 2003. Semi-automated building extraction based on CSG model-image fitting,
' % , 69(2), 171-180.
Zlatanova S., Heuvel F A. v.d., 3D city modelling for mobile augmented reality,
http://www.gdmc.nl/zlatanova/thesis/html/refer/ps/SZ_FH_CIP A.pdf
http://www.terrasolid.fi/en/products/terrascan
http://www.ecognition.com/products/trial-software International Archives of the Photogrammetry, Remote Sensing and Spatial Information Sciences, Volume XXXIX-B3, 2012