EVALUATION OF VEGETATION INDICES FOR RANGELAND BIOMASS
ESTIMATION IN THE KIMBERLEY AREA OF WESTERN AUSTRALIA
Charity Mundavaa,b*, Petra Helmholza,b, Antonius G.T. Schutc, Robert Cornera, Brendan McAteeb,d, David W. Lambb,e
a
Department of Spatial Sciences, Curtin University, Kent Street, Bentley, Western Australia [email protected], [email protected] b
Cooperative Research Centre for Spatial Information, P.O. Box 672 Carlton South, Victoria 3053
cWageningen University, Plant Production Systems Group, 6700AK, Wageningen, The Netherlands - [email protected] d
Western Australian Land information Authority, Landgate, 65 Brockway Rd, Floreat, WA 6014 - [email protected]
e
Precision Agriculture Research Group, University of New England, Armidale New South Wales - [email protected]
KEY WORDS: Analysis, Modelling, Estimation, Prediction, Imagery, Landsat
ABSTRACT:
The objective of this paper is to test the relationships between Above Ground Biomass (AGB) and remotely sensed vegetation indices for AGB assessments in the Kimberley area in Western Australia. For 19 different sites, vegetation indices were derived from eight Landsat ETM+ scenes over a period of two years (2011-2013). The sites were divided into three groups (Open plains, Bunch grasses and Spinifex) based on similarities in dominant vegetation types. Dry and green biomass fractions were measured at these sites. Single and multiple regression relationships between vegetation indices and
green and total AGB were calibrated and validated using a “leave site out” cross validation. Four tests were compared: 1) relationships between AGB and vegetation indices combining all sites; 2) separate relationships per site group; 3) multiple regressions including selected vegetation indices per site group; and 4) as in 3 but including rainfall and elevation data. Results indicate that relationships based on single vegetation indices are moderately accurate for green biomass in wide open plains covered with annual grasses. The cross-validation results for green AGB improved for a combination of indices for the Open plains and Bunch grasses sites, but not for Spinifex sites. When rainfall and elevation data are included, cross validation improved slightly with a Q2 of 0.49-0.72 for Open plains and Bunch grasses sites respectively. Cross validation results for total AGB were moderately accurate (Q2 of 0.41) for Open plains but weak or absent for other site groups despite good calibration results, indicating strong influence of site-specific factors.
1. INTRODUCTION
Australian rangelands are economically significant and pastoral enterprises cover large parts of the continent. In the state of Western Australia (W.A), rangelands cover 87% of the total land area (2.5 million square kilometres) (DAFWA, 2014). Livestock productivity and ecological health are driven mainly by the cover and composition of the perennial grass component of pastures (DRD, 2011). Rangeland vegetation comprises living and dead plant material in proportions that vary strongly within relatively short distances (Huete and Jackson, 1987). Ground coverage is low with a mixed species composition resulting in high spatial and temporal variability of biomass and dead/green vegetation components (O'Neill, 1996). Pastoralists need to know forage availability to assess carrying capacity and grazing periods.
Above Ground Biomass (AGB) estimates provide an important indication of feed availability and monitoring growth dynamics may give clues to the vegetation condition (Reeves et al., 2001). AGB in this context therefore refers to the total amount of edible biomass (including dead and green components) available to grazing cattle while green biomass refers specifically to green components of AGB.
Remote sensing provides temporal and spatial information on feed resources and makes measurements at large extents possible by reducing laborious field sampling and sample processing procedure (Starks et al., 2006). Remotely sensed vegetation indices represent an integrative measure of both vegetation photosynthetic activity and canopy structural variation that is useful in monitoring, time series analysis, and change detection studies (Huete et al., 2002). They can be used as a proxy for plant photosynthesis and relate to the leaf area index (LAI), determining the capacity of a vegetation canopy to intercept solar radiation.
The objective of this paper is to evaluate the robustness of vegetation indices derived from Landsat ETM+ imagery for AGB assessment in the Kimberly region in Western Australia (WA); a region of significance to
Australia’s livestock production (EPA, 2004a). Firstly,
region of Western Australia) and the methodology. The results section evaluates the potential for the prediction of AGB using Landsat ETM+ imagery. The paper closes with a conclusion and outlook for future research.
2. BACKGROUND
Remote sensing derived, ratio-based vegetation indices have been in use for a long time in AGB estimation and the number of publications is immense (Lu, 2006). A
vegetation index’s main intention is to enhance the
vegetation signal while minimising solar irradiance and soil background effects (Jackson, 1991). Reflectance data are affected by soil properties (Rondeaux et al., 1996), atmosphere (Huete et al., 2006), viewing angle effects (López Díaz and González-Rodríguez 2003) pixel heterogeneity caused by variation in dead/green ratios, ground cover and leaf angle distribution (Hilker et al., 2008).
For the Landsat ETM+, commonly used indices include various ratios of the NIR and RED wavebands, such as Normalised Difference Vegetation Index (NDVI) Normalised Difference Weighted Index (NDWI), and Soil Adjusted Vegetation Index (SAVI). These have been successfully used for AGB estimation at various scales (Lu, 2006). The most widely applied index in biomass estimation is the NDVI, (Anderson et al., 1993; Todd et al., 1998). Although the NDVI has been useful in many studies, it has clear limitations. It is most sensitive to ground coverage with chlorophyll containing leaves (Purevdorj et al. 1998), as present in the vegetative growth phase (Donald et al., 2010), but the response saturates when the ground is completely covered, typically at a LAI of 2 to 3 (Baret and Guyot, 1991). Previous studies have identified strong relationships between vegetation indices and AGB for grassland ecosystems (Wylie et al, 2002). For instance, Dancy et al (1986) reported an R2 of 0.72 when deriving ground cover in Botswana rangelands and Beeri et al (2007) reported a prediction error of 18% for total biomass in moderately grazed pastures due to overestimation by NDVI. However, Beck et al (1990) found no correlation between green or total biomass and ground derived NDVI. The most probable reason for this was the spatially-variable soil background and the contribution of senescent material.
In the Australian context, relationships between biomass and vegetation indices have been successfully developed for the Mediterranean and temperate zones (Donald et al., 2010). However, little information is available for the North Western tropical zone as many vegetation indices have not been extensively tested. Commonly used indices are not suitable as rangelands are dominated by perennial vegetation which does not have a strong response in the NIR region (Jafari et al., 2007). The NDVI has severe limitations as it only responds to the green component (O'Neill, 1996).
Pixel heterogeneity poses a problem as pixels may encompass green and senescent vegetation including soil. Todd et al (1998) pointed out that soil-vegetation spectral mixing distorts biomass estimation in semi-arid environments. Senescent material can have a profound
effect on the net spectral response of plant canopies (Todd et al., 1998).
Red soils characterising the Australian rangelands have a great influence on the red reflectance. Indices that incorporate a soil background adjustment factor (Ahamed et al., 2011) enhancing the vegetation signals over high biomass areas while reducing atmospheric influences (López Díaz and González-Rodríguez, 2003) are worth considering. Examples of soil adjusted indices include Soil Adjusted Vegetation Index (SAVI), (Huete, 1988) and Soil Adjusted Total Vegetation Index (SATVI), (Marsett et al 2006).
Stress related indices have also been found to be good predictors of ground cover. O'Neill (1996) working in semi-arid shrubland in western New South Wales (Australia) found that the STVI is strongly related to total vegetation cover in both summer and winter. In the southern rangelands of South Australia Jafari et al (2007) reported that stress related indices 1 and 4 (STVI-1, 4) were good predictors of perennial vegetation and of total ground cover at the landscape scale. This points out that the both near and middle infrared wavelengths are useful in monitoring vegetation in semi-arid environments. However, relationships between vegetation indices and AGB are species and often location specific (Eisfelder et al. 2011), hence there is the need to evaluate which vegetation indices work in this environment. The main aim of this paper is to explore and verify the use of vegetation indices derived from remote sensing data (Landsat) as well as elevation and rainfall data for the estimation of AGB in the Kimberley region of WA. Indices evaluated in the work are based on findings of the
“Pastoral Lease Assessment using Geospatial Analysis project” for rangelands in this region of WA (Robinson et al., 2012) (see table 2).
3. MATERIALS AND METHODS
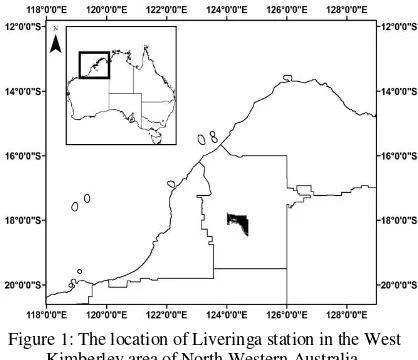
The study area is the Milne Agrigroup owned Liveringa cattle station located in the Kimberley area of WA (Figure 1).
1923), with a wet and a dry season. The station covers an area of approximate 263 000 ha and is located along the Fitzroy river. It includes several land systems and land types that vary in soil type, plant species composition and land condition. Selected sites covered the seven major land systems and included three sites per land system. These land systems were: Djada, Egan, Calwynyardah, Myrooda, Luluigui, Camelgooda and Wanganut (DAFWA, 2014).
Field data was collected in rangeland pastures in 8 field visits within the 2011/2012 and 2012/2013 seasons, according to the protocol introduced in Mundava et al (2013). At each site location, radials extended 50 m from the centre in North, South, West and East directions. The effective sampling size was 0.785 ha. Direct (destructive) and indirect (non-destructive) sampling was carried out. Direct sampling consisted of the clipping and harvesting of quadrats. Indirect sampling involved calibration against these harvested samples.
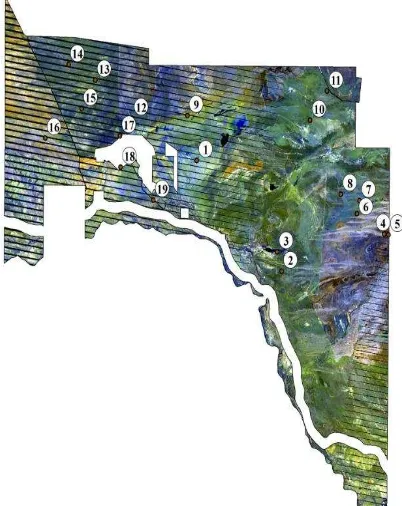
Satellite images from the Enhanced Thematic Mapper Plus (ETM+) on-board Landsat 7 were used. Atmospheric correction with an estimate of transmissivity was performed using the Landsat calibration module in ENVI (version 5.0, EXELIS, 2013). The Landsat 7 ETM+ has a Scan Line Corrector (SLC) failure which causes some areas to be imaged twice while no data is recorded for others (Figure 2).
Figure 2: Landsat ETM+ false colour image including a RGB combination of bands 6, 5 and 4 with site locations
at Liveringa station from 23 December 2011. The SLC error affected 13 sites over the two seasons. Bilinear interpolation was used to approximate the required image information from adjacent pixels. If all adjacent pixels around the site had no data, this site was excluded from the evaluation process. The sampling dates and corresponding images used in this analysis are
shown in Table 1. The Landsat 7 ETM+ path 109 and rows 72 and 73 covered the study area.
Sampling Date % Cloud Landsat pass *72 *73
11-18 December 2011 0 6 23 December 18-25 February 2012 7 6 25 February
19-26 March 2012 0 3 29 March
16-23 June 2012 8 0 16 June
30 November - 7 December 2012
1 0 10 December
15-22 February 2013 3 0 9 February 12-19 April 2013 0 0 (13 April) 15-22 June 2012 0 n/a 2 June
Table 1: Sampling Dates and Landsat passes used in the study, *72/73 refers to the Landsat rows. An approximated one arc second (30 m) Shuttle Radar Topography Mission (SRTM) Digital Elevation Model (DEM) was produced by Geoscience Australia in 2009. The daily gridded total rainfall (mm) data was obtained from the Australian Bureau of Meteorology (BOM) corresponding to the sampling dates. The spatial resolution of the grids is 5 km x 5 km. The positional accuracy of the observational stations is approximately 1 km. Extraction and processing of rainfall grids was done with ArcMap (version 10.2).
Vegetation indices used in this study are presented in Table 2 and were calculated using the ESRI ArcMap software model builder tool (version 10.2). In order to match the image pixels to the size of the ground represented in the sample sites, index values were bi-linearly interpolated from adjacent cells with valid values using a weighted distance method. This step was required because the study sites covered a circular area with a 50 m radius, equivalent to four Landsat pixels.
Vegetation Index Example studies Normalised Difference
Vegetation Index (NDVI)
Tucker et al (1983) Soil Adjusted Vegetation
Index (SAVI)
Washington-Allen et al (2006)
Soil Adjusted Total Vegetation Index (SATVI)
Marsett et al(2006)
Land Monitor Curry et al ( 2008)
Normalised Difference Senescent Vegetation Index (NDSVI)
Dean (2005)
Stress-related Vegetation Index (STVI-1)
O’Neill (1996)
Jafari et al (2007) Stress-related Vegetation
Index (STVI-3)
O’Neill (1996)
Jafari et al (2007) Green +Red band Wallace and Thomas
(1998)
Table 2: Vegetation indices used in this study (Adapted from Robinson et al (2012)).
sites), Bunch grasses (9 sites) and Spinifex (5 sites) (Mundava et al., 2013). Open plains refer to sites in areas with periodic flooding with mostly annual grasses, Bunch grasses include mostly perennial grasses and cover sandy Pindan country and other higher terrain while Spinifex sites were dominated by hard or soft spinifex (Triodia spp). In a second test, relationships between the site groups and the vegetation indices were established. In a third test, relationships including a combination of indices for each site group were evaluated. This time a multiple regression model was used; the dependent variables are green and total AGB and the independent variables considered are all the indices derived from the Landsat data. The three best independent variables were selected in a step wise regression approach. Robustness
of the relationships was tested with a “leave site out”
cross validation approach. Cross validation is a statistical procedure that tests the predictive ability of a model. The result from the cross validation is a Q2value, a measure of the predictive ability of the model (Loague and Green, 1991). A correlation is assumed to be satisfying when Q2 values exceed 0.5. Note that Q2 can become negative when predictions are poor. The final test is similar to the third test but elevation and rainfall are included as additional independent variables in the multiple regression model. For the evaluation of all the tests, we consider that a successful correlation is detected when the adjusted R2
value obtained for the evaluation has a value of at least 0.5. This implies that 50% of the variance in the dependent variable is accounted for by the model.
The tests are summarised in Table 3. The left column represents the test number, the middle column the test configuration and the right column, the number of data samples available for each test.
Test no.
Name Number of test
samples 1 Single vegetation indices for
19 sites in a simple linear regression model
152 (19 sites sampled 8 times) 2 Single vegetation indices for
three site groups in a simple linear regression model
O=48, B=64, S=40 (3 groups at 8 time points) 3 Combined vegetation indices
for three site groups in a multiple regression model
O=48, B=64, S=40 (3 groups at 8 time points) 4 Combined vegetation indices
and additional data for three sites groups in multiple regression model
O=48, B=64, S=40 (3 groups at 8 time points) Table 3: Overview of the processed tests where O=Open
plains, B=Bunch grasses and S=Spinifex.
4. RESULTS
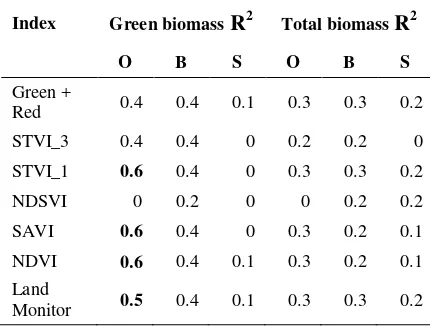
When all sites are included (test 1), relationships between total or green AGB and selected vegetation indices resulted in consistently weak relationships with R2 values below 0.2. Relationships remained far below the defined threshold of 0.5 and were therefore not useful to assess Table 4: Coefficients of determination for vegetation indices with green and total biomass where O=Open plains, B= Bunch grasses and S= Spinifex. Values equal
or above 0.5 are highlighted.
However, there is an improvement in correlation with green biomass for Open plains, with R2 values of between 0.4 and 0.6, occasionally achieving the required threshold value of 0.5. For Open plains, green biomass has a moderate correlation with the vegetation indices STVI_1, SAVI and NDVI with a R2 of 0.6. However Bunch grasses have a low correlation with green biomass for all indices with R2 values ranging from 0-0.4. Similar results are obtained for Spinifex (R2
values between 0-0.2) for green AGB. The correlation of the indices with total AGB was low for all sites with R2
values of between 0 and 0.3
When all indices were combined together in a multiple regression model (test 3), there was no correlation found for total biomass for each of the site groups (Open plains, Bunch grasses and Spinifex), (top part of Table 5). The
the multiple regression tests 3and 4.
Bunch grasses. The most significant term for the Open plains was STVI3 while for Bunch grasses it was STVI1. However, the validation for total biomass was poor with Q2 values of -0.05 for Open plains, -0.09 for Bunch grasses and -1.74 for Spinifex. For green biomass, Open plains and Bunch grasses had LSO-Q2 values of 0.53 and 0.42. Spinifex had poor Q2 values at -0.22.
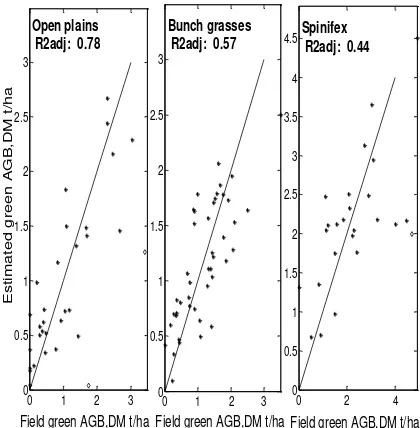
When elevation and rainfall information are added to the analysis (test 4), results slightly improve for total biomass for Open plains 0.58 (lower part of Table 5). However, the Bunch grasses and Spinifex values still fall below the defined threshold at 0.37 and 0.40 terms are the plant water sensitive indices in combination with rainfall and elevation. This shows that rainfall is a strong driver of plant growth in this environment. The validation for total biomass had Q2 values of 0.41 for Open plains, 0.17 for Bunch grasses and -1.14 for Spinifex. For green biomass, Open plains and Bunch grasses had LSO-Q2 values of 0.72 and 0.49. Spinifex
had very low Q2 values at -0.21. The cross validation results for this test were comparable to test 3 with significant improvement for Open plains. This indicates that this more complex model did not significantly improve results for Bunch grasses and Spinifex.
Figure 3: Green biomass plotted against a combination of vegetation indices, rainfall and elevation data in a
multiple regression model. R2adj= Adjusted R2. An exception in this analysis was the Spinifex group
Figure 4: Clump of Spinifex grass in the field
5. CONCLUSION AND OUTLOOK
In comparing vegetation indices derived from Landsat ETM+ imagery and AGB, in heterogeneous rangeland environments in the Kimberley region of WA, there was no correlation between vegetation indices and green or total AGB when combining all sites and samples in one single relationship. However, results improved for green AGB when sites were grouped in terms of similar botanical composition, i.e. Open Plains, Bunch Grasses and Spinifex in a multiple regression model, but not for total AGB. Open Plains had a correlation of 0.60 while Bunch grasses had 0.56. Spinifex which is predominantly perennial had a very low correlation of 0.19 for green biomass. Calibration results slightly improved for Open plains green biomass to 0.78 and validation results to 0.72 when elevation and rainfall information is added to the model. However validation results did not improve for Bunch grasses and Spinifex. Total biomass models did not provide any robust estimates when validated using the leave site out validation. Q2 values ranged from -1.14 to 0.41. This indicates a strong variability within the sampled sites. A combination of vegetation indices provided robust estimates for green AGB Open plains and Bunch grasses groups and only for total AGB Open plains group. The introduction of environmental information did not further improve validation results. These results indicate that Landsat vegetation indices are helpful to map green AGB across the most important grazing areas including the vegetation types Bunch grasses and Open plains. However, relationships were not robust for Spinifex and perform poorly for total AGB despite moderately strong calibrations, indicating a very strong influence of site-specific factors. The next step is to test if calibrated relationships of previous seasons enable accurate predictions of future seasons, or if further in-season calibrations are required. The prediction of AGB is important to rangeland farmers for setting stocking limits throughout the grazing periods.
ACKNOWLEDGMENT
The work has been supported by the Cooperative Research Centre for Spatial Information, whose activities are funded by the Australian Commonwealth's
Cooperative Research Centres Programme. The authors
also acknowledge the assistance of Mr Peter O’Brien
(Liveringa Station, Milne Agrigroup) and his team. We also want to acknowledge and thank Landgate and CSIRO along with Richard Stovold, Graham Donald, Dr. Norman Santich, Derek Schneider, Vanessa Lonergan, Michael Schaefer, Mark Trotter, Andrew Toovey, Dr. Zheng-Shu Zhou, Elizabeth Hulm, Dr. Waqar Ahmed, Bob McCartney and Andrew Buchanan for their valuable fieldwork assistance and technical support.
REFERENCES
Ahamed, T., Tian, L., Zhang, Y., Ting, K.C., 2011. A review of remote sensing methods for biomass feedstock production. Biomass and Bioenergy. 35, pp. 2455-2469. Anderson, G.L., Hanson, J.D., Haas, R.H., 1993. Evaluating landsat thematic mapper derived vegetation indices for estimating above-ground biomass on semiarid rangelands. Remote Sensing of Environment 45, pp. 165-175.
Baret, F., Guyot, G., 1991. Potentials and limits of vegetation indices for LAI and APAR assessment. Remote Sensing of Environment 35, pp. 161-173.
Beck, L.R., Hutchinson, C.F., Zauderer, J., 1990. A comparison of greenness measures in two semi-arid grasslands. Climatic Change 17, pp. 287-303.
Beeri, O., Phillips, R., Hendrickson, J., Frank, A.B., Kronberg, S., 2007. Estimating forage quantity and quality using aerial hyperspectral imagery for northern mixed-grass prairie. Remote Sensing of Environment 110, pp. 216-225.
Curry, P., Zdunic, K., Wallace, J., Law, J., 2008. Landsat monitoring of woodland regeneration in degraded mulga rangelands: implications for arid landscapes managed for carbon sequestration, Australasian Remote Sensing and Photogrammetry Conference., Darwin, Northern Territory, Australia, pp. 1–4.
DAFWA, 2014. Department of Agriculture and Food
Western Australia. Available at:
https://www.agric.wa.gov.au/. Accessed 31/03/2014 Dancy, K.J., Webster, R., Abel, N.O.J., 1986. Estimating and mapping grass cover and biomass from low-level photographic sampling. International Journal of Remote Sensing 7, pp. 1679-1704.
Dean, C. 2005. Monitoring of Pastoral Rangeland Condition in the Southern Northern Territory (Australia) by Remote Sensing—Status and Prospects. In: Achim, R.
and Hill, J. (Eds.) “Proceedings of the 1st
International Conference on Remote Sensing and Geoinformation Processing in the Assessment and Monitoring of Land
Degradation and Desertification”, Trier, Germany, 7th –
9th September 2005, pp. 151-158
Department of Regional Development and Lands (DRD) 2011. Rangelands tenure options. Government of Western Australia, Perth.
Donald, G.E., Gherardi, S.G., Edirisinghe, A., Gittins, S.P., Henry, D.A., Mata, G., 2010. Using MODIS imagery, climate and soil data to estimate pasture growth rates on farms in the south-west of Western Australia. Animal Production Science 50, pp. 611-615.
Eisfelder, C., Kuenzer, C., Dech, S., 2011. Derivation of biomass information for semi-arid areas using remote-sensing data. International Journal of Remote Sensing 33, pp. 2937-2984.
Environment Protection Authorty (EPA) 2004a, Environmental protection and ecological sustainability of the rangelands in Western Australia. Position Statement No. 5, EPA, Perth
EXELIS, 2013. ENVI Classic Tutorial: Atmospherically Correcting Multispectral Data Using FLAASH®. Exelis Visual Information Solutions, Inc.
Hilker, T., Coops, N.C., Wulder, M.A., Black, T.A., Guy, R.D., 2008. The use of remote sensing in light use efficiency based models of gross primary production: A review of current status and future requirements. Science of The Total Environment 404, pp. 411-423.
Huete, A.R., 1988. A soil-adjusted vegetation index (SAVI). Remote Sensing of Environment 25, pp. 295-309.
Huete, A., Didan, K., Miura, T., Rodriguez, E.P., Gao, X., Ferreira, L.G., 2002. Overview of the radiometric and biophysical performance of the MODIS vegetation indices. Remote Sensing of Environment 83, pp. 195-213. Huete, A.R., Didan, K., Shimabukuro, Y.E., Ratana, P., Saleska, S.R., Hutyra, L.R., Yang, W., Nemani, R.R., Myneni, R., 2006. Amazon rainforests green-up with sunlight in dry season. Geophysical Research Letters 33, L06405.
Huete, A.R., Jackson, R.D., 1987. Suitability of spectral indices for evaluating vegetation characteristics on arid rangelands. Remote Sensing of Environment 23, pp. 213-218.
Jackson, R., 1991. Interpreting vegetation indices. Preventive veterinary medicine 11, pp. 185-200. Jafari, R., Lewis, M.M., Ostendorf, B., 2007. Evaluation of vegetation indices for assessing vegetation cover in southern arid lands in South Australia. The Rangeland Journal 29, pp. 39-49.
Köppen, W., (1923) Die Klimate der Erde. Walter de Gruyter, Berlin
Loague, K., Green, R.E., 1991. Statistical and graphical methods for evaluating solute transport models: Overview and application. Journal of Contaminant Hydrology 7, pp. 51-73.
Lu, D., 2006. The potential and challenge of remote sensingbased biomass estimation. International Journal of Remote Sensing 27, pp. 1297-1328.
Marsett, R.C., Qi, J., Heilman, P., Biedenbender, S.H., Watson, M.C., Amer, S., Weltz, M., Goodrich, D., Marsett, R., 2006. Remote Sensing for Grassland Management in the Arid Southwest. Rangeland Ecology & Management 59, pp. 530-540.
Mundava, C., Schut, A.G.T., Stovold, R., Donald, G., Lamb, D.W., Helmholz, P., 2013. Ground truthing protocols for biomass estimation in rangeland environments, Geoscience and Remote Sensing Symposium (IGARSS), 2013 IEEE International, pp. 2122-2124.
O'Neill, A.L., 1996. Satellite derived vegetation indices applied to semi-arid shrublands in Australia. Australian Geographer 27, pp. 185-199.
Purevdorj, T.S., Tateishi, R., Ishiyama, T., Honda, Y., 1998. Relationships between percent vegetation cover and vegetation indices. International Journal of Remote Sensing 19, pp. 3519-3535.
Reeves, M.C., Winslow, J.C., Running, S.W., 2001. Mapping Weekly Rangeland Vegetation Productivity Using MODIS Algorithms [Abstract]. Journal Rangeland Management pp. 54, 207.
Robinson, T.P., Novelly, P., Corner, R.J., Thomas, P., Russel-Brown, A., 2012. Pastoral Lease Assessment using Geospatial Analysis (PLAGA) - Remote Sensing Based Rangeland Condition Assessment Res. Department of Food and Agriculture Western Australia (DAFWA), Perth.
Rondeaux, G., Steven, M., Baret, F., 1996. Optimization of soil-adjusted vegetation indices. Remote Sensing of Environment 55, pp. 95-107.
Starks, P.J., Zhao, D., Phillips, W.A., Coleman, S.W., 2006. Development of Canopy Reflectance Algorithms for Real-Time Prediction of Bermudagrass Pasture Biomass and Nutritive Values. Crop Science 46, pp. 927-934.
Todd, S.W., Hoffer, R.M., Milchunas, D.G., 1998. Biomass estimation on grazed and ungrazed rangelands using spectral indices. International Journal of Remote Sensing 19, pp. 427-438.
Tucker, C.J., Vanpraet, C., Boerwinkel, E., Gaston, A., 1983. Satellite remote sensing of total dry matter production in the Senegalese Sahel. Remote Sensing of Environment 13, pp. 461-474.
Wallace, J.F. and Thomas, P.W.E., (1998). Rangeland monitoring in northern Western Australia using sequences of Landsat imagery. Report to National Landcare Program Project No. 953024. Agriculture Western Australia, unpublished.
Washington-Allen, R.A., West, N.E., Ramsey, R.D., Efroymson, R.A., 2006. A protocol for retrospective remote sensing-based ecological monitoring of rangelands. Rangeland Ecology & Management 59, pp. 19-29.