GEOARCHAEOLOGICAL SITE DOCUMENTATION AND ANALYSIS OF 3D DATA
DERIVED BY TERRESTRIAL LASER SCANNING
D. Hoffmeister a, *, S. Zellmann b, K. Kindermann c, A. Pastoors d, U. Lang b, O. Bubenzer a, G.C. Weniger d, G. Bareth a
a
Institute of Geography, University of Cologne, Albertus-Magnus-Platz, 50923 Cologne, Germany – (dirk.hoffmeister,
olaf.bubenzer, g.bareth)@uni-koeln.de
b
Chair of Computer Science, University of Cologne, Albertus-Magnus-Platz, 50923 Cologne, Germany –
(zellmann, lang)@uni-koeln.de
c
Institute of Prehistoric Archaeology, University of Cologne, Albertus-Magnus-Platz, 50923 Cologne, Germany –
[email protected]
d
Neanderthal Museum, Talstrasse 300, 40822 Mettmann, Germany –
(pastoors, weniger)@neanderthal.de
Commission V/2
KEY WORDS: archaeology, geoarchaeology, terrestrial laser scanning, documentation, 3D GIS
ABSTRACT:
Terrestrial laser scanning was conducted to document and analyse sites of geoarchaeological interest in Jordan, Egypt and Spain. In those cases, the terrestrial laser scanner LMS-Z420i from Riegl was used in combination with an accurate RTK-GPS for georeferencing of the point clouds. Additionally, local surveying networks were integrated by established transformations and used for indirect registration purposes. All data were integrated in a workflow that involves different software and according results. The derived data were used for the documentation of the sites by accurate plans and cross-sections. Furthermore, the 3D data were analysed for geoarchaeological research problems, such as volumetric determinations, the ceiling thickness of a cave and lighting simulations based on path tracing. The method was reliable in harsh environmental conditions, but the weight of the instrument, the measuring time and the minimum measurement distance were a drawback. However, generally an accurate documentation of the sites was possible. Overall, the integration in a 3D GIS is easily possible by the accurate georeference of the derived data. In addition, local survey results are also implemented by the established transformations. Enhanced analyses based on the derived 3D data shows promising results.
* Corresponding author.
1. INTRODUCTION
Terrestrial laser scanning (TLS) has been used for the documentation of several geoarchaeological sites within the framework of an interdisciplinary research project. The Collaborative Research Centre 806 (CRC806): “Our Way to Europe – Culture-Environment Interaction and Human Mobility in the Late Quaternary” funded by the German Research Foundation since 2009 (CRC806, 2014) investigates the complex relationship of chronology, culture, climate and environment during the dispersal of Anatomically Modern Humans (AMH) from Africa into Eurasia during the last 190,000 years (Richter et al., 2012).
For the documentation and analysis of key sites of the CRC806, TLS was used, which is based on Light Detection and Ranging (LIDAR) and provides highly accurate and dense 3D point clouds (Vosselman and Maas, 2010). The method can be applied on different scales with airborne platforms, known as Airborne Laser Scanning (ALS), on mobile platforms, known as Mobile Laser Scanning (MLS), as well as on terrestrial platforms, known as TLS.
In general, laser scanning has been used by numerous projects for the documentation of cultural heritage and archaeological sites. Examples are the survey of historic buildings (Herdt and Jones, 2008; Riveiro et al., 2011) and caves with ancient remains (Buchroithner and Gaisecker, 2009; González-Aguilera et al., 2011; Lerma et al., 2010; Rüther et al., 2009). TLS data can be further used to reconstruct, for example, small missing parts of artefacts, which are printed as 3D objects (Fatuzzo et al., 2011) and general CAD models (Lerones et al., 2010). ALS surveys are important for the detection and documentation of sites (Bewley et al., 2005; Devereux et al., 2008), particularly supported by different visualisation techniques (Štular et al., 2012). The detection of sites in forests is simplified by an integration of the full-waveform detection and, accordingly, enhanced bare-earth extraction (Doneus et al., 2008). Furthermore, bathymetric ALS is able to detect and document sites in shallow-water (Doneus et al., 2013).
However, laser scanning is just one method to capture and accurately document cultural heritage sites (Remondino, 2011). Further possibilities are close-range photogrammetry (De Reu et al., 2013; Plets et al., 2012) or photogrammetry by UAVs
(Rinaudo et al., 2012). Lambers et al. (2007) showed that a combined approach of TLS and UAV-photogrammetry is promising.
In this case, the TLS LMS-Z420i from Riegl, Austria in combination with a highly accurate, kinematic DGPS (RTK-GPS) HiPer Pro from Topcon, Japan is evaluated for the documentation of sites in Jordan, Egypt and Spain. Enhanced analyses were conducted on the derived 3D data. The data were combined with local archaeological data, as well as 3D data from a structured-light scanner. The accurate georeference allows additionally the combination with general remote sensing data, e.g. satellite imagery.
2. METHODS 2.1 Surveying
For the investigations in Jordan, Egypt and Spain we used the TLS LMS-Z420i from Riegl, Austria. The positions of the laser scanner were directly measured by a highly accurate kinematic DGPS (RTK-GPS) HiPer Pro from Topcon, Japan. In addition, one further position for the estimation of the orientation of the scanner is recorded, where a larger reflector on a ranging pole is established. The relative accuracy of the RTK-GPS is ~1 cm in regard to the base station and shows an absolute accuracy of ~1.5 m in the horizontal and vertical direction, which is proven by tests with known surveying points. For inside positions, such as in caves, tachymetric surveying in combination with indirect referencing of scan positions by tie points was used to connect outside and inside measurements. Equal points measured by the RTK-GPS or the TLS and the tachymeter were used to establish transformations between geodetic and local surveying systems.
All sites were observed by multiple scan positions. At most of the scan positions, additional tilted scans were conducted, to cover the entire site. The TLS device was additionally equipped with a digital camera of type Nikon D200, which was mounted on the head of the laser scanner to take pictures. These pictures can be used for the colourisation of the point clouds by assigning RGB-values to each point, for direct measurements in the pictures, and for texturing final 3D models, as the orientation between the camera and the scanner is known.
2.2 Post-Processing
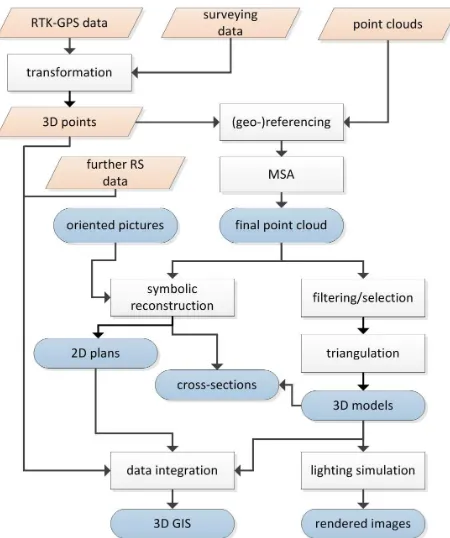
The general workflow of post-processing and enhanced analysis is shown in Fig. 1. The different scan positions were directly georeferenced by the measurements from the RTK-GPS or data from tachymetric surveying, which is transformed by a Helmert transformation. We used the Iterative Closest Point (ICP) algorithm, which is implemented in RiSCAN PRO (Riegl, Austria) as the Multi Station Adjustment (MSA) to enhance this registration (Besl and McKay, 1992). The final point cloud is used to reconstruct specific elements, such as detailed floor plans or cross-sections of important areas. In this case, the software PointSense Heritage (Kubit GmbH, Germany) in combination with AutoCAD Civil 3D 2013 (Autodesk Inc., USA) is used. In addition, the final, consistent point cloud is completely or in parts triangulated to 3D models, after removing noise and outliers by filter functions or manual selection. 3D modelling is usually conducted by Geomagic 12 (Geomagic GmbH, Germany). The 3D models are additionally origins for detailed cross-sections. Furthermore, the 3D models can be used for enhanced analysis and integrated in 3D-GIS environments, such as ArcScene (ESRI Inc., USA).
Figure 1. The flowchart depicts the post-processing steps.
Further 3D data, such as tachymetric surveying data of archaeological findings, RTK-GPS points of drillings or geo-radar profiles, as well as topographic maps, airborne and satellite imagery is available and integrated for every site. Several areas of interest at one site were also recorded by a structured-light scanner, type Breuckmann smartSCAN3D-DUO, and successfully combined with the data of the TLS. Similar is possible with high-resolution photogrammetry.
For an insight into different lighting conditions, a physically inspired lighting simulation was conducted on the 3D models. Therefore, the path tracing algorithm was implemented, which was proposed by Kajiya (1986) and originates from geometric optics. It solves the rendering equation by stochastically sampling the hemisphere over positions where rays hit a surface by sending additional, secondary rays and accumulating light intensity along the path. Fully converged, the algorithm produces images that faithfully depict the radiance at each position of the cave due to direct and indirect lighting.
3. SITES
The sites of Jordan, Egypt and Spain are consecutively presented. The cave sites were measured by inside and outside scan positions that are connected by tachymetric surveying.
The Neolithic settlement of ‘Ain Jamman (N 30°1'14'', E 35°28'5'') is located in southern Jordan (Makarewicz, 2009; Rollefson, 2005). The area was visited during the investigation of a rubble layer, which occurs at several Neolithic sites in Jordan. It was suspected to be the reason for the abandonment of such sites and caused by rapid climate change, but geoarchaeological investigations revealed that this layer is of a later, possible anthropogenic origin (Zielhofer et al., 2012). However, for an accurate documentation of the site, nine scan positions, each with an additional tilted scan, were conducted. RTK-GPS data was recorded in WGS 1984, UTM 36N.
The Sodmein Cave (N 26°14'44'', E 33°58'24'') is located in the Red Sea Mountains of Egypt. In this cavern more than 4 m of stratified human occupation debris can be identified, spanning from the Late Pleistocene to the Holocene, where the lowermost layers have been assigned to 118 ka BP and give evidence for more humid climate conditions (Mercier et al., 1999; Moeyersons et al., 2002). Thus, the development of the cave in the Eocene Thebes limestone is assigned as karstic, but a system of local faults and associated shear zones with vertical displacement surround the cave, which may have also played an important role in shaping the appearance of the cave. The cave and parts of the wadi in front of the cave were surveyed by eight scan positions with several additional tilted recordings. The RTK-GPS measurements were again conducted in WGS 1984, UTM 36N.
The complexly structured Ardales Cave (N 36°52'22'', W 4°49'44'') is located in the south of Spain surrounded by various other archaeological sites near the Strait of Gibraltar, which is regarded as a bridge or barrier (Richter et al., 2012). In addition, Southern Iberia is discussed as the last refuge of Neanderthals, because radiocarbon dates apparently document their prolonged survival until about 28 ka BP (Finlayson et al., 2006), which are a matter of dispute (Kehl et al., 2013). For the Cave of Ardales, several findings proved the repeated use by prehistoric humans, such as 250 panels with rock art (paintings and engravings), as well as bones and artefacts distributed on the cave floor (Cantalejo et al., 2006). The entire outside hill and most of the inside cave were covered by 40 scan positions. Most of the inside positions were additionally conducted with the tilted scanner. Additional light was necessary to achieve good images with the mounted camera.
4. RESULTS
Generally, the TLS surveys allow an accurate documentation of the geoarchaeological sites in the different countries. All data is accurately georeferenced by the point measurements of the RTK-GPS with a worldwide absolute accuracy of 1.5 m in both directions. The high relative accuracy of ~1 cm in both directions is used for an initial estimation of the scanner’s position. The orientation is determined by adding one further measured target, the reflectors on ranging poles, which are also detected by the scanner. This initial estimation is enhanced by the MSA approach, which iteratively searches for the best-fit solution and mostly shows an error > 1 cm.
As aforementioned, the derived, consistent, georeferenced 3D point cloud is used for the documentation and in particular for further analysis. Likewise, cross-sectional drawings and 3D visualisations are possible. The geometric information of the oriented pictures, recorded by the mounted camera, were useful for detailed and accurate drawings. In addition, enhanced analyses on the basis of the derived 3D data were possible. The results are subsequently presented for each site.
`Ain Jamman, Jordan
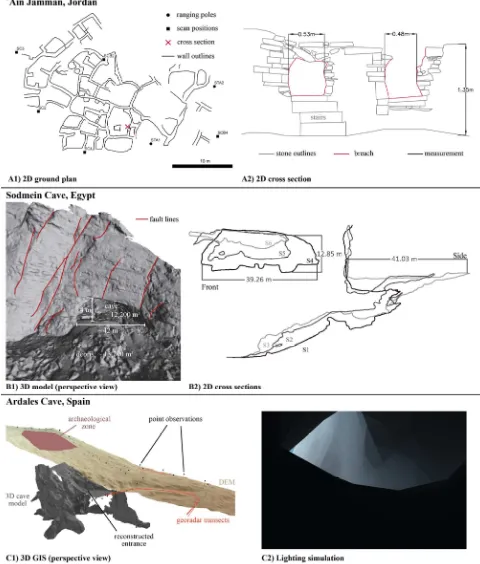
A detailed plan was established for this site (Fig. 3, A1) by applying a symbolic reconstruction. The detected walls cover an area of ~30 by 40 m and several rooms can be distinguished. Additionally, cross sectional profiles of details, like windows, doors and stairs can be derived, as well as the distribution of single stones (Fig. 3, A2). In this case, the breach is slightly collapsed.
Sodmein Cave, Egypt
A 3D model of the cave and the surrounding cliff wall was established (Fig. 3, B1). The fault lines and the vertical displacements (> 2 m) were estimated in the model and match to previous investigations (Moeyersons et al., 2002). The cave volume (~12,200 m³) and the nearly similar debris volume in front of the cave (~13,200 m³) were computed by incorporation of virtual planes for closure. Profiles along and across the cave were established from the 3D model and show the dimensions of the cave (Fig. 3, B2). A height difference between the uppermost part of the cave and the floor of the wadi of ~33 m is indicated. The main cave measures about 40 m by 25 m and the height at the front of the cave is 13-14 m. The small shafts in the back of the cave reach up to 40 m into the backward hill.
Ardales Cave, Spain
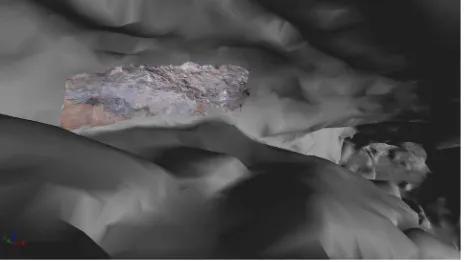
A 3D model of the Ardales Cave and the outside hill was derived from the accurate TLS measurements. The area of the cave shows an extent of ~115 m in a southwestern direction and a maximum width of about 50 m. The biggest hall lies about 20 m below the entrance with a ceiling height of ~20 m. As the outside hill and the inner cave were surveyed, the ceiling thickness can be determined to discover further possible entrances by comparing raster images of the inside top ceiling and the outside hill. All data can be integrated in a consistent 3D GIS (Fig. 3, C1). For instance, the high-resolution scans of important engraving by the mentioned structured-light scanner were fitted into the whole 3D model with a point cloud to point cloud registration (Fig. 2).
Figure 2. Perspective view of the combined 3D model of the entire cave and data from the structured-light scanner, textured by the pictures of the mounted camera
Figure 3. Results from all sites, revealing the potential and accuracy of TLS for geoarchaeological documentation, as well as enhanced analysis based on the derived data. A1 shows the ground plan of the Neolithic site of ´Ain Jamman, Jordan and an according cross section (A2), revealing the details of the partly collapsed architecture. The 3D model of the Sodmein Cave, Egypt is shown in B1, which allows the accurate determination of tectonic displacements and the volumetric dimensions. B2 shows respective cross sections of a perpendicular view of the cave (S1-S3) and the front of the cave (S4-S6). In C1, a perspective view of the 3D GIS
of the Ardales Cave, Spain is depicted with 3D data integrated from different sources, such as, remote sensing, TLS surveying, drilling locations and georadar profiling. The 3D model of the cave is used for lighting simulations (C2) for the estimation of ancient
living conditions. Here, a perspective view of the entrance is shown. Blue areas depict direct light, grey colors show indirect light.
The entrance to the cave, which is now protected by an entrance building, was virtually reconstructed by removing this man-made object. This new entrance area was integrated into the whole cave model and the updated model was used for lighting simulations. These reveal for instance the extent of available daylight. Figure 3, C2 reveals that most of the light does not reach a position in a 5 m distance to the entrance, due to the structure of the cave.
5. DISCUSSION
The field campaigns in Jordan, Spain and Egypt showed that the TLS method is an accurate and reliable tool to support geoarchaeological surveys with 3D data (Remondino, 2011). In particular, it was possible to survey cave sites, which is hardly conductible by other remote sensing methods (Buchroithner and Gaisecker, 2009; Rüther et al., 2009). In addition, custom regulations played an important role, as the equipment is of high value. However, the robust laser scanner and the other required equipment was reliably usable in the cave site of Spain, which was also noticed by Buchroithner and Gaisecker (2009) for the same type of scanner, and the dry, dusty and hot sites of Jordan and Egypt. However, the equipment was extensive, heavy, and thus expensive in terms of transport.
An accurate georeference was established by using the RTK solution in combination with the reflectors on ranging poles for the remote sites. The absolute accuracy of ~1.5 m can be further enhanced, for instance by Precise Point Positioning (PPP). However, this accuracy already allows the integration of further remote sensing data. The relative accuracy of the RTK-GPS allowed the initial registration of the point clouds, which is according to Mårtensson et al. (2012) sufficient. The connection to local surveying networks was enabled by transformation of similar points. This connection was used for the indirect registration (Rüther et al., 2009) and for the integration of points, which were measured by tachymetric surveying, e.g. profiles, locations of archaeological artefacts and sections. Overall, detailed topographic maps, plans and cross-sectional profiles of the archaeological sites were successfully established by the previously stated method and software, similar to the procedure of Rüther et al. (2012).
Although a lot of scan positions at each site were established, a full coverage for several sites could not be achieved in the available time and with the equipment. The weight, measurement time, and minimum distance are a drawback with regard to the complex, sometimes very narrow locations at the selected sites. For such areas, smaller and faster scanners applying the CW-method, such as the Faro Focus3D LS 120, would be more feasible. For detailed studies on small structures, the combination with photogrammetric methods was available by using the additionally recorded pictures with various functions of PointSense Heritage, thereby allowing a more detailed reconstruction for several areas. Further photogrammetric approaches (De Reu et al., 2013) or a combination with triangulation-based scanners and structured-light scanners for a more detailed reconstruction of specific objects is generally an option (Remondino, 2011). This was successfully shown for the Ardales Cave. Accurate texture mapping with a full coverage without occlusions is still a problem. Published work, which use automatic, effective selection procedures for optimal image mapping show faster and more promising results than the incorporated solutions of
simple image wrapping (Al-Khedera et al., 2009; Zalama et al., 2011).
However, the stated method allowed an accurate and promising documentation of the sites. Ground plans and cross-sectional profiles of important, architectural features were successfully established and are now available to serve as a basis for further investigations and excavations. For instance, for the site in Jordan, the established models could be used for an artificial reconstruction in terms of research on this architecture (Kinzel, 2004).
In addition, enhanced analyses for geoarchaeological research were possible. The ceiling thickness of the Ardales Cave, derived by the comparison of the inner and outer 3D model is a valuable result for further geoarchaeological prospection. Rüther et al. (2009) present a similar approach, combining inside TLS measurements with outside tachymetric contour measurements. The 3D model of the Sodmein Cave partly confirms the mostly tectonic origin of the cave, as the volume of the cave and the debris in front are similar. Thus, karstic erosion is small. In addition, the established transformation allows the integration of all archaeological findings into the 3D model, which were measured within this system. This 3D model by itself allows an accurate representation and documentation with regard to possible demolition, as documented for the nearby Tree Shelter area (Kindermann et al., 2013).
In general, the combination of tachymetric networks and 3D models derived by TLS measurements is a promising opportunity for further analysis of 3D distributions of archaeological findings and all other geoscientific measurements in a joint 3D-GIS, as conducted by Katsianis et al. (2008). This combination allows the representation of all integrated information, and an enhanced, interactive visualization of the whole environment in Virtual Reality (VR) (Bruno et al., 2010). The fusion of 3D surfaces and further measurements, such as punctual stratigraphic information or georadar transects is possible (Siart et al., 2013). The illumination analysis for the Ardales cave can be further carried out with regard to living conditions and recorded cave art (Pastoors and Weniger, 2011). For instance, the illumination of oil lamps and torches will be simulated in the 3D model.
6. CONCLUSION
Overall, TLS is an appropriate tool for surveying and documenting geoarchaeological sites, but some constraints, such as the minimum range and measurement time of the TLS, need to be considered. In combination with other remote sensing methods, TLS can offer a crucial contribution to the documentation and analysis of such sites. The 3D information is here used for further new investigations, such as the determination of the ceiling thickness and the simulation of the illumination of the cave site.
REFERENCES
Al-Khedera, S., Al-Shawabkeh, Y., Haala, N., 2009. Developing a documentation system for desert palaces in Jordan using 3D laser scanning and digital photogrammetry. Journal of Archaeological Science 36 (2), pp. 537-546. doi: 10.1016/j.jas.2008.10.009
Besl, P.J., McKay, N.D., 1992. A method for registration of 3-D shapes. IEEE Trans. Pattern Anal. Mach. Intell. 14 (2), pp. 239-256.
Bewley, R.H., Crutchley, S.P., Shell, C.A., 2005. New light on an ancient landscape: Lidar survey in the Stonehenge World Heritage Site. Antiquity 79 (305), pp. 636-647.
Bruno, F., Bruno, S., De Sensi, G., Luchi, M.-L., Mancuso, S., Muzzupappa, M., 2010. From 3D reconstruction to virtual reality: A complete methodology for digital archaeological exhibition. Journal of Cultural Heritage 11 (1), 42-49. doi: 10.1016/j.culher.2009.02.006
Buchroithner, M.F., Gaisecker, T., 2009. Terrestrial laser scanning for the visualization of complex dome in an extreme alpine cave system. Photogrammetrie - Fernerkundung -
Geoinformation 4, pp. 329-339. doi:
10.1127/1432-8364/2009/0025
Cantalejo, P., Maura, R., Espejo, M.M., Ramos, J., Medianero, J., Aranda, A., 2006. La Cueva de Ardales: Arte prehistórico y ocupación en el Paleolítico Superior. Cedma, Diputación de Málaga, Málaga.
CRC806, 2014. Collaborative Research Centre 806 : Our way to Europe. Culture-Environment Interaction and Human Mobility in the Late Quaternary. http://www.sfb806.uni-koeln.de/ (15/02/2014).
De Reu, J., Plets, G., Verhoeven, G., De Smedt, P., Bats, M., Cherretté, B., De Maeyer, W., Deconynck, J., Herremans, D., Laloo, P., Van Meirvenne, M., De Clercq, W., 2013. Towards a three-dimensional cost-effective registration of the archaeological heritage. Journal of Archaeological Science 40 (2), pp. 1108-1121. doi: 10.1016/j.jas.2012.08.040
Devereux, B.J., Amable, G.S., Crow, P., 2008. Visualisation of LiDAR terrain models for archaeological feature detection. Antiquity 82 (316), pp. 470-479.
Doneus, M., Briese, C., Fera, M., Janner, M., 2008. Archaeological prospection of forested areas using full-waveform airborne laser scanning. Journal of Archaeological Science 35 (4), pp. 882-893. doi: 10.1016/j.jas.2007.06.013
Doneus, M., Doneus, N., Briese, C., Pregesbauer, M., Mandlburger, G., Verhoeven, G., 2013. Airborne laser bathymetry – detecting and recording submerged archaeological sites from the air. Journal of Archaeological Science 40 (4), pp. 2136-2151. doi: 10.1016/j.jas.2012.12.021
Fatuzzo, G., Mussumeci, G., Oliveri, S.M., Sequenzia, G., 2011. The “Guerriero di Castiglione”: reconstructing missing elements with integrated non-destructive 3D modelling techniques. Journal of Archaeological Science 38 (12), pp. 3533-3540. doi: 10.1016/j.jas.2011.08.016
Finlayson, C., Giles Pacheco, F., Rodriguez-Vidal, J., Fa, D.A., Gutierrez Lopez, J.M., Santiago Perez, A., Finlayson, G., Allue, E., Preysler, J.B., Caceres, I., Carrion, J.S., Fernandez Jalvo, Y., Gleed-Owen, C.P., Jimenez Espejo, F.J., Lopez, P., Lopez Saez, J.A., Riquelme Cantal, J.A., Sanchez Marco, A., Giles Guzman, F., Brown, K., Fuentes, N., Valarino, C.A., Villalpando, A., Stringer, C.B., Martinez Ruiz, F., Sakamoto, T., 2006. Late survival of Neanderthals at the southernmost extreme of Europe. Nature 443 (7113), pp. 850-853. doi: 10.1038/nature05195
González-Aguilera, D., Muñoz-Nieto, A., Rodriguez-Gonzalvez, P., Menéndez, M., 2011. New tools for rock art
modelling: automated sensor integration in Pindal Cave. Journal of Archaeological Science 38 (1), pp. 120-128. doi: 10.1016/j.jas.2010.08.017
Herdt, G., Jones, M.W., 2008. Scanning Ancient Buildings. Photogrammetrie - Fernerkundung – Geoinformation 4, pp. 245-251.
Katsianis, M., Tsipidis, S., Kotsakis, K., Kousoulakou, A., 2008. A 3D digital workflow for archaeological intra-site research using GIS. Journal of Archaeological Science 35 (3), pp. 655-667. doi: 10.1016/j.jas.2007.06.002
Kehl, M., Burow, C., Hilgers, A., Navazo, M., Pastoors, A., Weniger, G.-C., Wood, R., Jordá Pardo, J.F., 2013. Late Neanderthals at Jarama VI (central Iberia)? Quaternary Research 80 (2), pp. 218-234. doi: 10.1016/j.yqres.2013.06.010
Kindermann, K., Bubenzer, O., Peer, P.V., 2013. Geo-archaeological research on the Late Pleistocene of the Egyptian Eastern Desert: recent threats to the Sodmein Cave. Antiquity 87 (337).
Kinzel, M., 2004. Some Notes on the Reconstruction of PPNB Architecture. Neo-Lithics 2, 18-22.
Lambers, K., Eisenbeiss, H., Sauerbier, M., Kupferschmidt, D., Gaisecker, T., Sotoodeh, S., Hanusch, T., 2007. Combining photogrammetry and laser scanning for the recording and modelling of the Late Intermediate Period site of Pinchango Alto, Palpa, Peru. Journal of Archaeological Science 34 (10), pp. 1702-1712. doi: 10.1016/j.jas.2006.12.008
Lerma, J.L., Navarro, S., Cabrelles, M., Villaverde, V., 2010. Terrestrial laser scanning and close range photogrammetry for 3D archaeological documentation: the Upper Palaeolithic Cave of Parpallo as a case study. Journal of Archaeological Science 37 (3), pp. 499-507. doi: 10.1016/j.jas.2009.10.011
Lerones, P.M., Fernandez, J.L., Gil, A.M., Gomez-Garcia-Bermejo, J., Casanova, E.Z., 2010. A practical approach to making accurate 3D layouts of interesting cultural heritage sites through digital models. Journal of Cultural Heritage 11 (1), pp. 1-9. doi: 10.1016/j.culher.2009.02.007
Makarewicz, C.A., 2009. Complex caprine harvesting practices and diversified hunting strategies: Integrated animal exploitation systems at Late Pre-Pottery Neolithic B 'Ain Jamman. Anthropozoologica 44 (1), pp. 79-101. doi: 10.5252/az2009n1a4
Mårtensson, S.-G., Reshetyuk, Y., Jivall, L., 2012. Measurement uncertainty in network RTK GNSS-based positioning of a terrestrial laser scanner. Journal of Applied Geodesy 6 (1), pp. 25-32. doi: 10.1515/jag-2011-0013
Mercier, N., Valladas, H., Froget, L., 1999. Thermoluminescence Dating of a Middle Palaeolithic Occupation at Sodmein Cave, Red Sea Mountains (Egypt). Journal of Archaeological Science 26, pp. 1339–1345.
Moeyersons, J., Vermeersch, P.M., Van Peer, P., 2002. Dry cave deposits and their palaeoenvironmental significance during the last 115 ka, Sodmein Cave, Red Sea Mountains, Egypt. Quaternary Science Reviews 21 (7), pp. 837-851. doi: 10.1016/S0277-3791(01)00132-9
Pastoors, A., Weniger, G.-C., 2011. Cave Art in Context: Methods for the Analysis of the Spatial Organization of Cave Sites. Journal of Archaeological Research 19 (4), pp. 377-400. doi: 10.1007/s10814-011-9050-5
Plets, G., Gheyle, W., Verhoeven, G., De Reu, J., Bourgeois, J., Verhegge, J., Stichelbaut, B., 2012. Three-dimensional recording of archaeological remains in the Altai Mountains. Antiquity 86 (333), pp. 884-897.
Remondino, F., 2011. Heritage Recording and 3D Modeling with Photogrammetry and 3D Scanning. Remote Sensing 3 (6), pp. 1104-1138. doi: 10.3390/rs3061104
Richter, J., Melles, M., Schäbitz, F., 2012. Temporal and spatial corridors of Homo sapiens sapiens population dynamics during the Late Pleistocene and early Holocene. Quaternary International 274, pp. 1-4. doi: 10.1016/j.quaint.2012.06.009
Rinaudo, F., Chiabrando, F., Lingua, A., Spanò, A., 2012. Archaeological Site Monitoring: UAV Photogrammetry can be an Answer. Int. Arch. Photogramm. Remote Sens. Spatial Inf. Sci., XXXIX-B5, 583-588. doi:10.5194/isprsarchives-XXXIX-B5-583-2012
Riveiro, B., Morer, P., Arias, P., de Arteaga, I., 2011. Terrestrial laser scanning and limit analysis of masonry arch bridges. Construction and Building Materials 25 (4), pp. 1726-1735. doi: 10.1016/j.conbuildmat.2010.11.094
Rollefson, G.O., 2005. Stone Tools from ‘Ayn Jammam, near Ras en-Naqb, Southern Jordan. Neo-Lithics 1, pp. 17-23.
Rüther, H., Bhurtha, R., Held, C., Schroder, R., Wessels, S., 2012. Laser Scanning in Heritage Documentation: The Scanning Pipeline and its Challenges. Photogrammetric Engineering and Remote Sensing 78 (4), pp. 309-316.
Rüther, H., Chazan, M., Schroeder, R., Neeser, R., Held, C., Walker, S.J., Matmon, A., Horwitz, L.K., 2009. Laser scanning for conservation and research of African cultural heritage sites: the case study of Wonderwerk Cave, South Africa. Journal of Archaeological Science 36 (9), pp. 1847-1856. doi: 10.1016/j.jas.2009.04.012
Siart, C., Forbriger, M., Nowaczinski, E., Hecht, S., Höfle, B., 2013. Fusion of multi-resolution surface (terrestrial laser scanning) and subsurface geodata (ERT, SRT) for karst landform investigation and geomorphometric quantification. Earth Surface Processes and Landforms 38 (10), pp. 1135-1147. doi: 10.1002/Esp.3394
Štular, B., Kokalj, Ž., Oštir, K., Nuninger, L., 2012. Visualization of lidar-derived relief models for detection of archaeological features. Journal of Archaeological Science 39 (11), pp. 3354-3360. doi: 10.1016/j.jas.2012.05.029
Vosselman, G., Maas, H.-G., 2010. Airborne and terrestrial laser scanning, 1st ed. Whittles Publishing, Dunbeath, UK, p. 311.
Zalama, E., Gomez-Garcia-Bermejo, J., Llamas, J., Medina, R., 2011. An Effective Texture Mapping Approach for 3D Models Obtained from Laser Scanner Data to Building Documentation. Computer-Aided Civil and Infrastructure Engineering 26 (5), pp. 381-392. doi: 10.1111/j.1467-8667.2010.00699.x
Zielhofer, C., Clare, L., Rollefson, G., Wachter, S., Hoffmeister, D., Bareth, G., Roettig, C., Bullmann, H., Schneider, B., Berke, H., Weninger, B., 2012. The decline of the early Neolithic population center of 'Ain Ghazal and corresponding earth-surface processes, Jordan Rift Valley.
Quaternary Research 78 (3), pp. 427-441. doi:
10.1016/j.yqres.2012.08.006
Revised May 2014