www.elsevier.nlrlocateraqua-online
Geometric morphometrics and internal anatomy in
ž
sea bass shape analysis Dicentrarchus labrax
/
qL., Moronidae
A. Loy
), C. Boglione, F. Gagliardi, L. Ferrucci, S. Cataudella
Laboratorio di Ecologia Sperimentale e Acquacoltura, Dipartimento di Biologia, UniÕersita di Roma ‘‘Tor`
Vergata’’, Via della Ricerca Scientifica, Rome 00133, Italy
Accepted 18 November 1999
Abstract
The effects of different conditions of larval and postlarval rearing on the external morphology and internal anatomical characters were studied in juvenile and adult specimens of Dicentrarchus
Ž .
labrax L. Teleostea, Moronidae in order to assess the potential of a combined methodology in
the assessment of finfish quality. Differences in the external morphology between two samples were analysed before their introduction into floating cages and after 15 months of common rearing. Shape differences were studied with geometric morphometrics. Significant differences in shape were found in juveniles. In adults, at the end of the common rearing, differences were smaller but still significant. The importance of larval rearing conditions in determining sea bass juvenile and adult shape is evident as well as a phenomenon of morphological resilience. On the same specimens, internal anatomical data were collected from X-rays. In this way, it was possible to correlate fish shape with internal anatomical data. Characteristic shapes were associated with particular cadres of internal anatomical anomalies, such as head shape and anomalies in the cephalic region, a bent body shape and lordosis of the haemal and prehaemal regions, the shape of the caudal region and lordosis of the caudal vertebral axis. Streamlined wild-like profiles were associated with light anomaly cadres. The use of the combined approach proposed is, thus, recommended in the description and quantification of shape features and particularly in the context of fish quality assessment.q2000 Elsevier Science B.V. All rights reserved.
Keywords: Morphological anomalies; Deformation; Quality assessment; Fish; Sea bass
q
Ž .
This study was supported by a grant from the Ministero Italiano per le Politiche Agricole Law 41r82 .
)Corresponding author. Tel.:q0039-6-7259-5970; fax:q0039-6-7259-5965.
Ž .
E-mail address: [email protected] A. Loy .
0044-8486r00r$ - see front matterq2000 Elsevier Science B.V. All rights reserved.
Ž .
1. Introduction
With a yearly production of more than 40,000, the Mediterranean aquaculture of the
Ž .
sea bream and the European sea bass Dicentrarchus labrax has lately undergone a very rapid development. At the basis of such development stand both the availability of reliable rearing techniques and the effort devoted to seed production. Although since the
Ž .
beginning, many authors e.g., Barahona-Fernandez, 1982; Chatain, 1994 emphasised the problem of anomalies in hatchery-produced juveniles, skeletal anomalies are still considered an important problem in such activities. They may cause drastic reductions of
Ž
the product’s quality in terms of growth, survival and external morphology Boglione et
.
al., 1994; Cataudella et al., 1995; Koumoundouros et al., 1997 . This is also true in restocking programs, where many authors emphasised the need to obtain individuals
Ž .
with wild-like performances Howell and Baynes, 1993; Mesa, 1994; Olla et al., 1994 . In such contexts, the study of the morphological characteristics of reared fish at the skeletal level and at a higher level of integration, such as the external morphology, is becoming a pivotal topic.
Ž
The use of geometric morphometrics Bookstein, 1991; Rohlf and Marcus, 1993;
.
Marcus et al., 1996 is proposed in this paper in combination with internal anatomical analysis as a tool in the assessment of the phenotypical quality of reared fish.
The effect of different conditions of larval and postlarval rearing on the external
Ž .
morphology shape and internal anatomical characters was studied in two samples of
Ž .
juvenile and adult D. labrax Teleostea, Moronidae .
Differences in shape between two samples were analysed with geometric morphomet-rics. On the same specimens, internal anatomical data were collected from X-rays. In this way, it was possible to correlate fish shape with internal anatomical characteristics. After different larval and postlarval rearings, sea bass were introduced into floating cages: juveniles were sampled before the introduction into these facilities; adults were sampled after 15 months of common rearing in floating cages. Such design was defined to test whether differences in external morphology increased, decreased or remained stable during the trial.
If, today, fish shape represents an important component within the large number of
Ž .
factors that affect the market value, the proposed approach may evidence and visualise abnormalities in the external morphology: these can be associated with particular patterns of skeletal anomalies and substantiated with rigorous statistical inference. If this is true, the combined tool could be considered as part of the approach in the evaluation of fish quality.
2. Materials and methods
Ž
Specimens of European sea bass from a French intensive commercial hatchery FRA,
. Ž
initial mean standard length 55 mm and an Italian intensive commercial hatchery ITA,
. Ž .
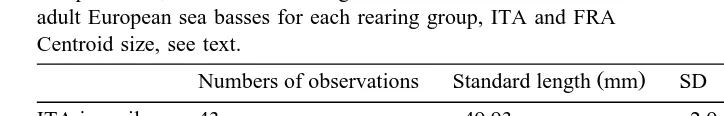
Table 1
Ž .
Samples sizes, mean standard length and mean centroid sizes with standard deviations SD for juvenile and adult European sea basses for each rearing group, ITA and FRA
Centroid size, see text.
Ž .
Numbers of observations Standard length mm SD Centroid size SD
ITA juveniles 43 49.93 2.9 64.62 4.118
FRA juveniles 45 55.49 3.91 71.9 5.231
ITA adults 47 192.38 16.389 279.52 18.151
FRA adults 40 210.93 15.868 256.21 17.792
and 0.13 kgrm3 for ITA. The first sample was collected after 7 months from hatching,
when individuals were introduced in the floating cages. The second sample was
Ž .
collected 22 months after hatching 15 months after the introduction in floating cages . Sea bass were fed twice a day with commercial pellets, in quantities depending on the weight growth of individuals and water temperature. Survival rate was 85%. Final food
Ž . Ž .
conversion indexes were 4.38 FRA and 4.61 ITA . Final rearing densities were 11.8
Ž . 3Ž .
FRA and 8.3 kgrm ITA .
2.1. Geometric morphometrics: a brief introduction to the method
The development of the techniques which constitute the discipline known as geomet-ric morphometgeomet-rics is quite recent and the tool is still not extensively applied. Few
Ž
applications related to fish quality assessment are reported in the literature Cataudella et
.
al., 1995; Loy et al., 1995, 1999 . Because of the complex computational steps involved in this analysis, a brief introduction on the method is given in Section 2.1.
The power of the technique lies in the possibility to visualise shape differences
Žthrough series of deformation grids known as splines , to decompose such differences.
into a uniform component, which describes stretching, compression or shearing of the entire landmark configuration, and a non-uniform, localised, component. Co-variation among portions or entire regions of the body is taken into account by the model. The numerical output can be analysed with traditional multivariate statistics.
At the core of the technique lies the thin-plate spline function; details on the analyses
Ž . Ž .
and algorithms may be found in Bookstein 1991, 1996a, b , Rohlf 1993 , Rohlf and
Ž . Ž . Ž .
Marcus 1993 , Rohlf et al. 1996 , Marcus et al. 1996 .The technique is based on the detection of homologous landmark points, in the form of x, y and eventually, z
Ž
coordinates. The homology of the landmarks can be purely operative from a
geometri-.
cal correspondence of landmarks on the objects to biologically homologous structures according to the purposes of the study. Each individual is then described by a landmark configuration. Once the landmark configurations are collected for each specimen, a series of algorithms is applied. The first step involves a superimposition of all landmark
Ž .
configurations translation and rotation based on a generalised least square method
Ž
according to a size measure known as centroid size the square root of the sum of
.
squared distances from each landmark to the specimen’s centroid . Centroid size is removed from the analysis of shape and can be analysed independently. Residuals after the superimposition can be visualised at each landmark location to explore deviations
Ž
from the consensus configuration growth trends, within group shape variability; Walker,
.
1993 . On the other hand, the residuals and the consensus can be modeled with the thin-plate spline function. The thin-plate spline algorithm uses the residuals of the superimposition to compute a new set of variables. The matrix containing this new set of variables is called the weight matrix. Each row of the weight matrix represents an individual, each column the new variables. Thanks to the properties of the thin-plate
Ž .
spline function Bookstein, 1991 , the new variables can be analysed with traditional multivariate techniques and shape change or shape differences can be visualised as
Ž .
deformation grids splines . The first two columns of the weight matrix represent
Ž .
localised shape features local deformations or non-uniform shape components ; the last
Ž
two columns represent the uniform shape components U , shearing and U , stretching,1 2
.
along the major axis of the fish . Thus, the model offers the possibility to decompose the
Ž . Ž .
shape change into uniform stretching and shearing and non-uniform localised compo-nents, which can be analysed, visualised and interpreted separately, adding to the rigour of the statistical analyses, the quality and immediateness of pictorial representation. No information contained in the original landmark configurations is lost at this step except
Ž .
the one about size centroid size, which can be analysed independently , translation and
Ž .
rotation which have no biological meaning .
2.2. Geometric morphometrics: analyses
Table 1 summarises sample sizes. Standard length was measured with a digital caliper. The images of each specimen were recorded with a Hi8 camcorder. Images were
Ž .
digitised using the image analysis system, Quantimet 970 Cambridge Instruments : 12
Ž .
landmarks were collected on juveniles and 17 on adult specimens Fig. 1 .
Ž
Shape differences were computed for each age class with a MANOVA F values
. Ž
approximated by Wilk’s l of the weight matrix, and U and U computed with the
1 2
.
software, TpsRelww . The scores of canonical variate analysis computed on the shape
Ž .
variables weight matrix were plotted as a histogram and were used as the independent variables in a regression analysis. Splines relative to the extreme values of the canonical
Ž .
variate scores were computed and plotted software TpsRegrw . These splines represent major shape differences between groups.
In order to verify if shape differences between FRA and ITA increased or decreased during growth, squared Mahalanobis distances were computed between the mean value of each group on canonical axes. To compare results at the different ages, the same
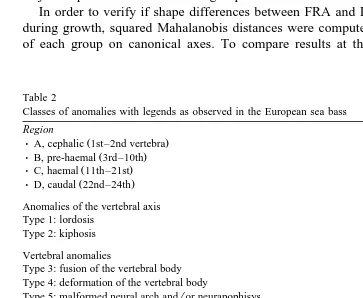
Table 2
Classes of anomalies with legends as observed in the European sea bass Region
Type 3: fusion of the vertebral body Type 4: deformation of the vertebral body
Type 5: malformed neural arch andror neurapophisys Type 6: malformed haemal arch andror hemapophisys Type B7: malformed pleural cost
Type 7: abnormal ray deformed, absent, fused, extranumerary Anomalies of the splanchnocranium
Type I4: elongated dental Type I5: reduced dental Type I6: others
number of landmarks is needed for each class. Thus, only 12 of the 17 landmarks collected on adults were used. Morphological variability for each group at each age class was measured as generalised variance.
Ž .
The morphometric softwares cited TpsRelww and TpsRegrw were implemented by F.J. Rohlf and are available at http:rrlife. bio.sunysb.edurmorph.
2.3. Internal anatomical analysis
After landmark data collection, all individuals were fixed in buffered formaldehyde
Ž10% and X-rayed 4 minr5 mAr80 kW . Internal anatomical anomalies were then. Ž . Ž
observed and classified according to Table 2. The binary matrix of anomalies
trans-.
formed in frequency data was analysed with correspondence analysis. On the corre-spondence analysis plot, only the classes of anomalies were visualised. Specimens scattered on the plot according to their anomalies’ patterns. Individual scores were used as the independent variables in the regression analysis described in Section 2.4.
2.4. Geometric morphometrics combined with internal anatomical analysis
The individual scores on each correspondence axis were used as the independent
Ž .
variables in a regression on the weight matrix software TpsRegrw . Individuals scored differently on correspondence axes according to particular anatomical patterns. This
Ž .
allowed for the visualisation of splines characteristic shapes relative to particular cadres of anomalies.
3. Results
3.1. Geometric morphometrics analysis
Table 3 shows the results of MANOVA. Shape differences between the two samples at each age class are all significant except the one relative to the uniform component in adult specimens. Fig. 2 shows the distribution of juveniles along canonical axis 1. The two groups are well-discriminated. At the top of the histogram, splines relative to the non-uniform component are visualised: the peduncular region appears to be shortened in
Ž .
FRA left spline and the insertion of the pelvic fin is displaced forward relative to the
Ž .
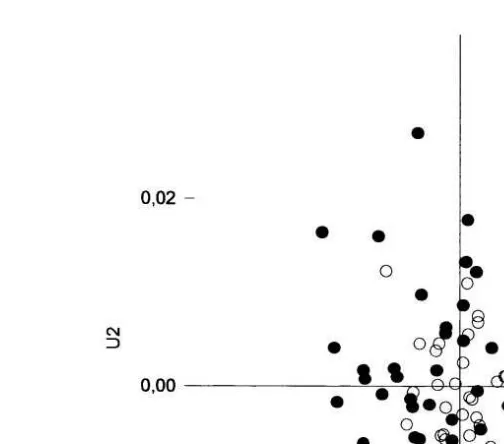
ITA sample. In Fig. 3, the scatter of individuals on U and U1 2 uniform component is reported for juveniles. The two groups are largely overlapping, but still, differences in
Ž .
the uniform component are significant Table 3 . The individuals of the two groups
Ž .
Table 3
Ž
Results of MANOVA F approximation of Wilk’sl, dfnsdegrees of freedom of the numerator, dfdsdegrees
.
of freedom of the denominator, Psprobability values computed on overall shape characters and only on the uniform component of shape change in European sea bass
F dfn dfd P)F
JuÕeniles
Non-uniform and uniform 5.307 20 64 0.0001
Uniform 6.57 2 82 0.0029
Adults
Non-uniform and uniform 10.96 30 56 0.0001
Uniform 3.07 2 84 0.0516
Ž
juveniles. Shape differences between groups decrease during growth Mahalanobis
2 2 .
squared distance M s13.12 for juveniles, M s11.55 for adults .
Morphological variability is higher in juvenile stages: generalised variances for
Ž . Ž .
juveniles are 0.4597 ITA and 0.2927 FRA , while the estimates for adults are 0.1475
ŽITA and 0.1035 FRA .. Ž .
3.2. Morphometrics combined with internal anatomical analysis
The correlation among shape variables and the scores of individuals on
correspon-Ž .
dence axes internal anatomical analysis is significant only for juveniles and, among all
Ž .
Fig. 2. Histogram of the canonical axis scores for juvenile sea bass. Specimens ITA Italy are in black while
Ž .
Ž . Ž .
Fig. 3. Scatter of juveniles on the uniform component U1 shearing and U2 stretching and compression . For positive values of U , the shearing is characterised by a forward displacement of all landmarks below the1 major axis of the fish. For positive values of U , the entire landmark configuration is stretched along the major2 axis of the fish.
Ž . Ž
the correspondence axes CA , only CA2 is significantly correlated with shape Goodall’s
UUU
.
Fs5.43; dfs18, 1584; P-0.001; Goodall, 1991 . Moreover, only the non-uni-form shape component is significantly correlated with internal anatomical data.
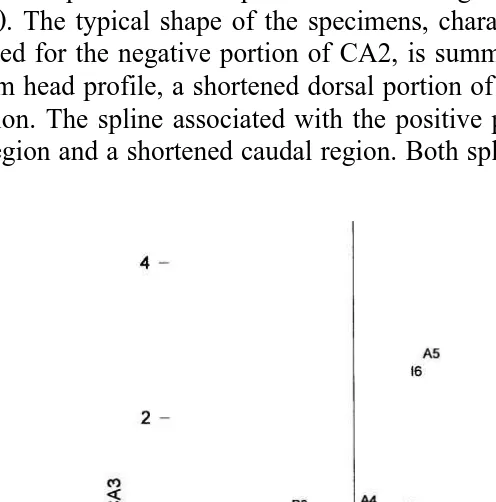
Ž . Ž
As a result of correspondence analysis on CA2 Fig. 5 , the class ABS absence of
.
anomalies lies at the origin, the negative portion is dominated by lordosis in the haemal
ŽC1 and prehaemal regions B1 , as well as by other malformations of the haemal and. Ž .
Ž .
prehaemal vertebrae C4, C5, C6, B3, B4 . In the positive portion of the axis, anomalies
Ž . Ž .
of the caudal vertebrae D3, D4, D5, D6 , caudal lordosis D1 and, among others,
Ž . Ž .
anomalies in the cephalic vertebral region A3, A5 , of the operculum I7 and the
Ž .
splanchnocranium I4, I6 have major loadings.
Since CA2 is significantly correlated with shape data, it is possible to represent by splines the characteristics of the external morphology relative to particular onsets of anomalies, according to the way they scatter on CA2. Typical shapes for the negative and positive portions of the plot and for the origin of the axis are visualised as splines
ŽFig. 5 . The typical shape of the specimens, characterised by the pattern of anomalies.
described for the negative portion of CA2, is summarised by the left spline of Fig. 5: a fusiform head profile, a shortened dorsal portion of the trunk, and a shortened peduncu-lar region. The spline associated with the positive portion of CA2 evidences a rounded head region and a shortened caudal region. Both splines describe characteristic bendings
of the entire body. This general bending is of opposite sign relative to the consensus configuration. The latter represents the class ABS.
4. Discussion
As evidenced by geometric morphometrics, European sea bass from different hatcheries are well-discriminated in their juvenile stages. Moreover, despite the
similar-Ž .
ity in rearing conditions two floating cages of the same fish farm during the following 15 months, the samples still show significant shape differences. This result shows that, despite the eventual change in the subsequent rearing technique, the effects on shape are
Ž .
determined during the pre-growout phase Boglione et al., 1994; Cataudella et al., 1995 .
Ž .
Moreover, Kozhara 1988 hypothesised a major morphological variability in juvenile stages as a form of adaptation in the maintenance of plasticity in crucial growth stages. Such observation may be substantiated in the present paper by the observed higher degree of morphological variability in juvenile stages relative to adults.
Interesting patterns of association between shape and internal anatomical characters emerge and might be significant in the overall performance of the stocks. So far, this type of association has never been reported in literature. Such association concerns the link between the shape of the head and anomalies in the cephalic region; the association
Ž
between the shape of the trunk linked to swimming and maneuverability; Webb, 1984;
.
Wootton, 1990 and lordosis and vertebral anomalies of haemal and prehaemal regions; and caudal lordosis and the downward bending of the caudal region. The scattering of the ABS at the origin of the axis offers the possibility to visualise the typical shape of the anomaly-free specimen, using it in comparison with the shape of malformed individuals. Admittedly, certain degrees of freedom still remain due to the plasticity of teleostean fish, as evidenced by the observed decrease in shape differences during the
Ž .
trial see also Corti et al., 1996 .
5. Conclusion
In this paper, a new descriptor is presented for characterising seed finfish quality. The combined method proposed has the potential to assess the scale at which certain patterns of anomalies influence the shape of the fish, such as large-scale effects for onsets correlated to the uniform component and localised scale effects linked to the non-uni-form component. This study shows how the effect of anomalies on the external morphology of the sea bass tends to influence mainly defined regions. Given the reliability of this method, future research programs could be integrated with the genetic characterisation of the strain considered. Shape characterisation according to rearing
Ž .
shape characterisation and monitoring based on the collection of underwater images might ultimately limit sampling and human intervention. An underwater stereo-imaging system, software for automated image calibration and filtering, and an automated profile acquisition routine appear to be promising tools in the remote monitoring of growth,
Ž
morphological variability and allometric shape changes in sea-based fish farming Loy
.
et al., 1998 .
References
Barahona-Fernandez, M.H., 1982. Body deformation in hatchery reared European sea bass Dicentrarchus labrax L. types, prevalence and effect on fish survival. Journal of Fish Biology 21, 239–249.
Boglione, C., Marino, G., Ferreri, F., Finoia, M.G., Scardi, M., Fresi, E., Cataudella, S., 1994. Anatomical
Ž .
aspects for seed quality assessment in sea bass Dicentrarchus labrax : hatchery and wild populations. In:
Ž .
Kestemont, P., Muir, J., Sevila, F., Williot, P. Eds. , Measures for Success. CEMAGREF, pp. 60–63. Bookstein, F.L., 1991. Morphometric Tools for Landmark Data. Cambridge Univ. Press, Cambridge. Bookstein, F.L., 1996a. A standard formula for the uniform shape component in landmark data. In: Marcus,
Ž .
L.F., Corti, M., Loy, A., Naylor, G.J.P., Slice, D.E. Eds. , Advances in Morphometrics. NATO ASI Series Plenum, New York, pp. 153–168.
Bookstein, F.L., 1996b. Combining the tools of geometric morphometrics. In: Marcus, L.F., Corti, M., Loy,
Ž .
A., Naylor, G.J.P., Slice, D.E. Eds. , Advances in Morphometrics. NATO ASI Series Plenum, New York, pp. 131–152.
Cataudella, S., Marino, G., Ferreri, F., dell’Aquila, M., Loy, A., Scardi, M., Boglione, C., 1995. Morphology
Ž
and morphometrics to evaluate finfish larval and fry quality: the case of the sea bass Dicentrarchus
. Ž .
labrax . In: Lavens, P., Jaspers, E., Roelants, J. Eds. , Larvi ’95 Fish and Shellfish Larviculture Symposium, EAS Special Publication No. 24. pp. 60–63.
Ž .
Chatain, B., 1994. Abnormal swimbladder development and lordosis in sea bass Dicentrarchus labrax and
Ž .
sea bream Sparus aurata . Aquaculture 119, 371–379.
Ž
Corti, M., Loy, A., Cataudella, S., 1996. Form changes in the sea bass, Dicentrarchus labrax Moronidae:
.
Teleostei , after acclimation to freshwater: an analysis using shape coordinates. Environmental Biology of Fishes 47, 165–175.
Ž .
Goodall, C.R., 1991. Procrustes methods in the statistical analysis of shape with discussion and rejoinder . Journal of the Royal Statistical Society, Series B 53, 285–339.
Howell, B.R., Baynes, S.M., 1993. Are hatchery-reared sole equipped for survival in the sea? ICES Council
Ž .
Meeting Papers ICES-CM-1993rF:33 , 11 pp.
Koumoundouros, G., Gagliardi, F., Divanach, P., Boglione, C., Cataudella, S., Kentouri, M., 1997. Normal and abnormal osteological development of caudal fin in Sparus aurata L. fry. Aquaculture 149, 215–226. Kozhara, A.V., 1988. Adaptive strategy of variation and age-dependent determination of developmental
homeoresis in some cyprinids. Voprosky Ikhtiologia 1, 63–69.
Loy, A., Boglione, C., Cataudella, S., 1999. Geometric morphometrics and morphoanatomy: a combined tool
Ž .
in the study of sea bream Sparus aurata, Sparidae shape. Journal of Applied Ichthyology 15, 104–119. Loy, A., Boglione, C., Zanello, L., Ferrucci, L., Cataudella, S., 1995. Morphometrics and image analysis as an
Ž .
emerging method to evaluate sea bass larval quality. In: Lavens, P., Jaspers, E., Roelants, J. Eds. , Larvi ’95 Fish and Shellfish Larviculture Symposium, EAS Special Publication No. 24. pp. 373–376. Loy, A., Busilacchi, S., Ferlin, L., Costa, C., Menesatti, P., Cataudella, S., 1998. Emerging technologies in
marine aquaculture: image analysis in the monitoring of sea-based fish farming. Biologia Marina Mediterranea 3, 830–838.
Marcus, L.F., Corti, M., Loy, A., Naylor, G.J.P., Slice, D.E., 1996. Advances in Morphometrics. NATO ASI Series Plenum, New York.
Olla, B.L., Davis, M.W., Ryer, C.H., 1994. Behavioural deficits in hatchery reared fish: potential effects on
Ž .
survival following release. Aquaculture and Fishery Management 25, 19–34, Suppl. .
Rohlf, F.J., 1993. Relative warp analysis and an example of its application to mosquito wings. In: Marcus,
Ž .
L.F., Bello, E., Garcia-Valdecasas, A. Eds. , Contribution to Morphometrics, Monografias, Museo Nacional de Ciencias Naturales. CSIC, Madrid, pp. 131–158.
Ž .
Rohlf, F.J., Loy, A., Corti, M., 1996. Morphometric analysis of Old World Talpidae Mammalia, Insectivora using partial-warp scores. Systematic Zoology 45, 344–362.
Rohlf, F.J., Marcus, L.F., 1993. A revolution in morphometrics. Trends in Ecology and Systematics 8, 129–132.
Rohlf, F.J., Slice, D.E., 1990. Extensions of the Procrustes method for the optimal superimposition of landmarks. Systematic Zoology 39, 40–59.
Walker, J.A., 1993. Ontogenetic allometry of three-spine stickleback body form using landmark-based
Ž .
morphometrics. In: Marcus, L.F., Bello, E., Garcia-Valdecasas, A. Eds. , Contribution to Morphometrics, Monografias, Museo Nacional de Ciencias Naturales. CSIC, Madrid, pp. 193–210.
Webb, P.W., 1984. Body form, locomotion and foraging in aquatic vertebrates. The American Zoologist 24, 107–120.