ROBUST BUILDING FAÇADE RECONSTRUCTION FROM SPACEBORNE TOMOSAR
POINTS
M. Shahzad a *, X. X.Zhu a,b
a Chair of Remote Sensing Technology (LMF), Technical University Munich, Germany, Arcisstrasse 21, 80333
Munich, Germany - [email protected]
b Remote Sensing Technology Institute (IMF), German Aerospace Center (DLR), Oberpfaffenhofen, 82234 Weßling,
Germany - [email protected]
Commission III, WG III/4 and ICWG III/VII
KEY WORDS: SAR tomography, TerraSAR-X, façade reconstruction, 4D point cloud, clustering, segmentation
ABSTRACT:
With improved sensor resolution and advanced multi-pass interferometric techniques such as SAR tomographic inversion (TomoSAR), it is now possible to reconstruct both shape and motion of urban infrastructures. These sophisticated techniques not only opens up new possibilities to monitor and visualize the dynamics of urban infrastructure in very high level of details but also allows us to take a step further towards generation of 4D (space-time) or even higher dimensional dynamic city models that can potentially incorporate temporal (motion) behaviour along with the 3D information. Motivated by these chances, this paper presents a post processing approach that systematically allows automatic reconstruction of building façades from 4D point cloud generated from tomographic SAR processing and put the particular focus on robust reconstruction of large areas. The approach is modular and consists of extracting facade points via point density estimation procedure based on directional window approach. Segmentation of facades into individual segments is then carried out using an unsupervised clustering procedure combining both the density-based clustering and the mean-shift algorithm. Subsequently, points of individual facade segments are identified as belonging to flat or curved surface and general 1st and 2nd order polynomials are used to model the facade geometry. Finally, intersection points of the adjacent façades describing the vertex points are determined to complete the reconstruction process. The proposed approach is illustrated and validated by examples using TomoSAR point clouds over the city of Las Vegas generated from a stack of TerraSAR-X high resolution spotlight images.
* Corresponding author. This is useful to know for communication with the appropriate person in cases with more than one author. 1. INTRODUCTION
Development of automatic methods for reconstruction of buildings and other urban objects from synthetic aperture radar (SAR) images is of great practical interest for many remote sensing applications due to their independence from solar illumination and all weather capability. In addition to it, very high resolution (VHR) SAR images acquired from spaceborne sensors are also capable of monitoring greater spatial area at significantly reduced costs. These benefits have motivated many researchers and therefore several methods have been developed that use SAR imagery for detection and reconstruction of man-made objects in particular buildings. For instance, (Quartulli, 2004) and (Ferro, 2009) present approaches for building reconstruction based on single-aspect SAR images. However, use of single SAR images only poses greater challenges especially in dense urban areas where the buildings are located closely together resulting in occlusion of smaller buildings from higher ones (Wegner, 2009). To resolve this, interferometric SAR acquisitions (InSAR) are acquired which implies imaging area of interest more than once with different viewing configurations. (Gamba, 2000) proposed an approach that uses such InSAR configuration to detect and extract buildings based on a modified machine vision approach. (Thiele, 2007) also presented a model based approach that employed orthogonal InSAR images to detect and reconstruct building footprints. An automatic approach based on modeling building objects as cuboids using multi-aspect polarimetric SAR images is presented in (Xu, 2007). (Sportouche, 2011) and (Wegner,
2009) also proposed methods that employ optical imagery along with SAR and InSAR datasets, respectively. Despite of the active ongoing research in the area, the problem of building reconstruction still remains challenging due to inherent problems with SAR images such as speckle effect, foreshortening, shadowing, and layover (Still, 2003). Moreover complex building structures and high variability of objects appearing in the images make automatic building detection and reconstruction a difficult problem.
Modern spaceborne SAR sensors such as TerraSAR-X are able to provide meter resolution SAR images. Such very high resolution SAR data is particularly suited to 3D, 4D, or even higher dimensional imaging of buildings and other man-made structures from space. Processing of these VHR SAR images with advanced multi-pass interferometric techniques such as persistent scatterer interferometry (PSI) and tomographic SAR inversion (TomoSAR) not only allows to reconstruct the 3D geometrical shape but also the undergoing temporal motion of individual buildings and urban infrastructures (Bamler,2009) (Gernhardt, 2010) (Reale, 2011) (Zhu, 2010). TomoSAR in particular resolves the layover problem and offer tremendous improvement in detailed reconstruction and monitoring of urban areas, especially building structures (Zhu, 2010).The retrieval of rich number of scatterers via TomoSAR inversion on stacks of VHR SAR images from multiple incidence angles enables us to generate 4D point clouds of the illuminated area. Point density of these point clouds is comparable to LiDAR (100,000 ISPRS Annals of the Photogrammetry, Remote Sensing and Spatial Information Sciences, Volume II-3/W3, 2013
pts/km2) and can be used for building façade reconstruction in urban environment from space (Zhu, 2013a).
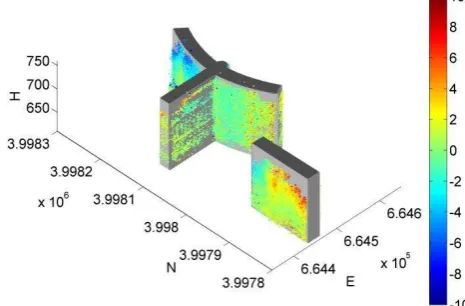
Due to side looking geometry, these point clouds however possess much higher density of points on building facades in contrast to nadir looking LiDAR geometry. Moreover, temporally incoherent objects such as trees cannot be reconstructed from multi-pass spaceborne SAR image stacks and provide moderate 3D positioning accuracy in the order of 1m as compared to airborne LiDAR systems (typically 0.1m) used for building reconstruction purposes. Despite of these special considerations, object reconstruction from these points can greatly support the reconstruction of dynamic city modelsthatbe potentially used to monitor and visualize the dynamics of urban infrastructure in very high level of details. Motivated by these chances, very first results of façade reconstruction from single view (ascending stack) and multi-view (fused ascending and descending stacks) perspectives over a small test building area (Bellagio hotel, Las Vegas) are presented in (Shahzad, 2012) and (Zhu, 2013a) respectively. Figure 1 shows the TomoSAR points colorcoded according to the amplitude of the seasonal motion overplotted onto the resulting façades model.
Figure 1: Reconstructed façade model with overplotted TomoSAR points (Zhu, 2013). Colorbar represents the amplitude of seasonal motion (line-of-sight) caused by thermal dilation in millimeters. Axis labels represents 'N' for northing, 'E' for easting in UTM coordinates and
'H' for height in meters.
This paper extends the previously proposed approach aiming at finding more general solution towards automatic reconstruction of the whole city area. The two major contribution of this paper are the following: Firstly, more robust façade extraction procedure is proposed which do not require any morpohological operations and works in 3D space without rasterization; Secondly, individual façades of the buildings are segmented without any prior knowledge about the number of clusters. These modifications allow completely automatic (but parametric) reconstruction of building façades from the TomoSAR points. To validate our approach, we tested the algorithm ona larger area dataset comprising of TomoSAR point clouds generated using a stack of 25 images from ascending orbits (36 deg. incidence angle) covering approx. 1 km2 area in the city of Las Vegas.
2. RELATED WORK
Detection of buildings is generally the first and important step towards the reconstruction of 3D building models from point clouds generated from aerial or spaceborne acquisitions. Most approaches employ LiDAR data for this purpose. Commonly in LiDAR point cloud processing, the primary step is to compute
(or use an already existing) a digital terrain model (DTM) by filtering techniques, e.g., morphological filtering (Sithole, 2004), gradient analysis (Vosselman, 2000), or iterative densification of triangular irregular network structure (Sohn, 2002) and then use the DTM to extract non ground points (Rottensteiner, 2002) from the rasterized point cloud data. Nadir looking LiDAR points essentially gives a digital surface model (DSM). Subtracting DSM from DTM provides us a normalized DSM (nDSM) which represent the height variation of non ground points. Building points are then extracted out by exploiting geometrical features such as deviations from surface model, local height measures, roughness and slope variations. Methods based on building boundary tracing from nDSM (Gross, 2005) or directly from point clouds (Sampath, 2007) (Rottensteiner, 2002) have also been employed for building detection. With them, finer building boundaries are determined by regularization of the coarsely traced boundaries. All points that lie inside the boundary regions are considered as building points. Building points are also extracted out by explicitly labeling every point in the data set. For labeling purpose, features in local neighborhood like height, eigenvalue and plane features can be determined and used in conjunction with supervised (Mallet, 2011), semi supervised (Sampath, 2010) and unsupervised (Dorninger, 2008) classification techniques.
Detected building regions or points are in turn used in 3D modelling and reconstruction. Most methods make use of the fact that man-made structures such as buildings usually have parametric shapes (model driven) or composed of polyhedral structures only (data-driven). The latter is however more common in the literature where local sets of coplanar points are first determined using 3D Hough transform or RANSAC algorithms and then reconstruction is carried out by surface fitting in the segmented building regions followed by region growing procedure (Dorninger, 2008) or by building up an adjacency graph (Sampath, 2010) (Forlani, 2006). These techniques along with other majority of airborne LiDAR methods that are used for building detection and reconstruction work with nadir looking geometry and therefore cannot be directly applied to TomoSAR point clouds due to different object contents captured by the side looking SAR.
3. METHODOLOGY
The proposed approach takes into account the characteristics of TomoSAR point clouds introduced by the side-looking SAR geometry. When projected onto ground plane, vertical façade regions exhibit much higher scatterer (point) density SD. It is mostly due to the existence of strong corner reflectors, e.g., window frames on the building façades. Taking this fact into account, in (Zhu, 2013a), we proposed to extract façade points by vertically projecting them onto a certain resolution grid. The result is a rastered SD image which after morphological operation returns a mask of façade points. This approach of SD estimation works well for high rise buildings giving much higher point density but limits the extraction of points from low height buildings. The selection of a particular threshold thus becomes crucial. To resolve this issue, in this work we use a more robust façade extraction approach based on directional SD estimation procedure that locally estimate the SD for each point while incorporating the façade geometry (Wang, 2013). Another improvement is in automatic segmentation of points belonging to individual façades. K-means clustering with a criterion for guessing the number of clusters in advance is used in previous work (Shahzad, 2012) (Zhu, 2013a). This technique provides good results for single buildings but when it comes to larger areas, there are two major concerns: 1) guessing number of ISPRS Annals of the Photogrammetry, Remote Sensing and Spatial Information Sciences, Volume II-3/W3, 2013
clusters is not always trivial; 2) certain shape of clusters are not very well recognized. For this reason, an automatic (unsupervised) clustering approach is proposed in this paper for segmentation of individual façade points that combines both the density based clustering and mean shift algorithm. The proposed approach is able to work directly on bigger areas without any need to guess the number of clusters in advance. Segmented façades are then classified as flat or curved. Model parameters are estimated and finally the geometric primitives such as intersection points of the adjacent façades are determined to complete the reconstruction process. Next we detail the processing chain of our proposed approach.
3.1 Estimation of scatterer density SD
For each 3D TomoSAR point p, points within its local neighbourhood� are used for SD estimation. �includes all those points that lie inside a vertical cylinder of radius r centered at p. To incorporate façade geometry in estimating SD, covariance matrix Σ�of points in � are computed. Distance for every point in � is then calculated from the principal axis i.e., eigenvector of the largest eigenvalue of Σ� and the points having distances less than d are taken as “inliers” and used in SD estimation. SD for each point is thus defined as the number of points within a directional (cylindrical) neighbourhood window divided by the area of the window:
i d than a specified threshold TH are removed. Usually, remaining points include not only façade points but also other non-façade points having higher SD e.g., building roof points. These non-façade points must be removed prior to further processing.
In order to reject points having higher SD but not belonging to façades, surface normals are computed for each 3D point in its local neighbourhood� using eigenvalue approach. Robust estimation of covariance matrix Σ� for estimating plane coefficients � +� +� +�= 0 is employed using
minimum covariance determinant (MCD) method with h = 75% (Hubert, 2005). Surface normals for each 3D point is then taken as the eigenvector of the smallest eigenvalue of Σ�:
3 points having normals close to the horizontal axis.
3.2 Automatic clustering of extracted facade points
Density based clustering algorithm proposed by (Ester, 1996) is first applied to coarsely cluster the extracted facade points. It involves the notion of density connectivity between the points. For instance two points are directly density connected to each other if one is in the neighbourhood vicinity of the other point. If the two points are not directly connected to each other, still they can be density connected to each other if there is a chain of points between them such that they all are directly density connected to each other. Two parameters that control the
clustering process include ε and MinPts. The former is the
neighbourhood parameter e.g., radius in case of sphere or
cylindrical neighbourhood while the later indicates the minimum number of points in any cluster. The resulting clusters � contains points such that all the points in any particular cluster are densityconnected to each other but are not density connected to any other point belonging to another cluster. The above process however can merge points of two or more adjacent façade segments into single cluster. Separation of clusters within clusters is therefore necessary for reconstruction of individual façade segments.
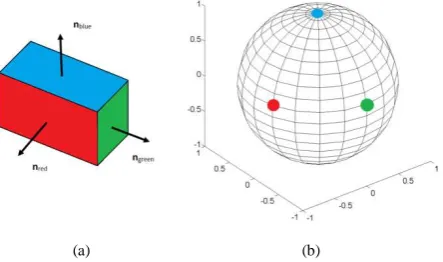
Clusters that group more than one façade are further clustered via meanshift clustering algorithm using their surface normals. For this purpose, we assume that the coarsely clustered segment � consist of one or more vertical adjacent façades �. j here refers to the number of individual façade surfaces (segments) in any particular �. An image of a map M: FF2 that assigns each point in F to its respective unit surface normal is known as Gaussian image GI of F (Carmo, 1976). Flat F (i.e., planar surface, the GI is the union of their individual GIs, i.e., number of clusters in GI equals the number of surfaces in the spatial domain. Moreover, shape of clusters in GI corresponds to the geometry of connected surfaces (Liu, 2008).
(a) (b)
Figure 2 : Gaussian image of three connected planar surfaces: (a) Arrows indicate surface normal vectors (nred, ngreen, nblue) to the
respective surfaces; (b) All points belonging to one particular surface are mapped to same identical point in GI (ideal scenario).
If we assume pf = 1,…,m to be of 3D points and nf as their
corresponding unit normal vectors belonging to one façade surface, then the density of any particular point � in GIis defined as (Liu, 2008): radially symmetric kernel function G x
(Cheng, 1995) and
Density � is higher for points that belong to planar or parabolic surfaces while the lower densities are obtained for points that lie at the transition edges between the surfaces (Liu, 2008). These higher density points in GI are identified and clustered using meanshift (MS) clustering procedure. MS is a mode seeking procedure and works iteratively by shifting every data point towards the mean of points within its neighbourhood. The shift vector m p
q at any particular point is computed as:
q f qm p n n (5)
Applying MS to normal points in GI results in clusters where each cluster potentially represents a different surface. However, the points that belong to different façades having similar normals that are spatially closely spaced but not connected are still clustered into one group. Therefore, the density based clustering is again performed here to separate these clusters. Finally, clusters with very few points are removed from further processing for robust reconstruction.
3.3 Reconstruction of clustered facades
In order to reconstruct individually clustered facades, first they are classified into flat and curved surfaces by analyzing derivatives of the local orientation angle θ. θis computed for each 3D point as:arctan
3y 3x
where λ3x and λ3yrepresents the x and y components of the surface normal λ3 of any 3D point. Ideally, the flat surfaces should have constant orientations, i.e., zero derivatives compared to the curved surfaces that have gradually changing orientations. We exploit this fact and compute the first derivative �′ of the orientation anglefor each façade footprint. Since the original orientation derivatives �′are usually noisy, all the points are first projected to the major (first) principal axis and polynomial fitting is then applied for denoising. Decision whether an individual façade footprint is flat or curved is based on the behaviour of �′. Façade footprints with unchanged orientation are considered to be flat while façade footprints with gradually changing orientation are considered to be curved.
General polynomial models are adopted to model the façade footprints in the x-y plane (Zhu, 2013a):
1 ( , )
p i j
p q
q
f x y a x y i j q
(6)where i and j are permuted accordingly, p is the order of polynomial, the number of terms in the above polynomial is equal to (p + 1)(p + 2)/2. Flat and curved facade segments are modelled by first (p = 1) and second (p = 2) order polynomial coefficients. Model parameters are then estimated for each façade segment using weighted least squares (WLS) method where weight of each facade point is set equal to its corresponding SD. Subsequently, intersection points between the two adjacent facade pairs are determined by building up an adjacency matrix via connectivity analysis (Sampath, 2010) (Zhu, 2013a). These intersection points represent the vertex points which together with the estimated model parameters are finally used to reconstruct 3D facades model.
4. EXPERIMENTAL RESULTS
To illustrate and validate the proposed methodology, we run the algorithm over TomoSAR point clouds generated from TerraSAR-X high spotlight images using theTomo-GENESIS software developed at the German Aerospace Center (Zhu, 2013b). Figure 3(a) shows the optical image of our testarea in Las Vegas while Figure 3(b) shows the respective TomoSAR point cloud in universal transverse mercator (UTM) coordinates. The result of applying SD estimation procedure is illustrated in Figure 3(c). The two parameters r (radius of the neighborhood cylinder) and d are empirically set to 5m and 2m respectively according to the point density of the data set. One can observe that TH value influences the number of extracted façade points. Lower TH value results in higher completeness but lower correctness. To extract lower façades and to automate the procedure, the threshold TH is set to the maximum of SD histogram value. As described in section 3, the result includes not only the façade points but additionally also some non-façade points with relative high SD, e.g., roof points. To reject these points from the set of extracted points after SD thresholding, surface normals information is utilized. Figure 3(d) shows the extracted façade points by retaining only those points having normals between ±15 degrees from the horizontal axis.
Once the facade points are extracted out, the next step is to cluster them into segments where each segment corresponds to an individual façade. For this, we apply the clustering procedure using the cylindrical neighbourhood definition and cluster all
the points with parameter settings: ε = r = 5m and MinPts = 2.
This result in clustering points that are density connected. In order to reconstruct individual façades, they need to be further clustered. To this end, mean shift clustering is applied using Gaussian kernel:
exp 22 x G xh
(7)
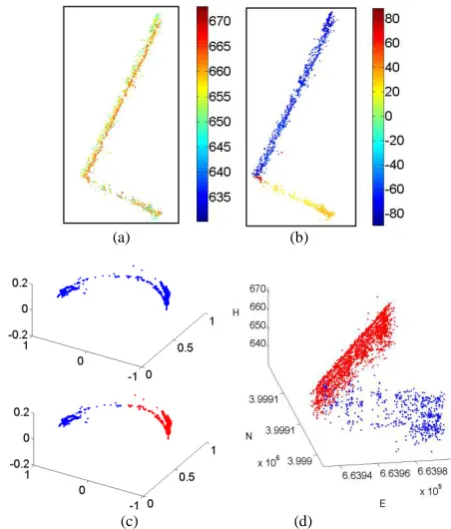
with h = 0.4, to the coarsely clustered segments in their normal feature space (in GI domain). Figure 4(b) shows the estimated orientation angle θ for extracted façade points from single building shown in Figure 4(a). The variation in orientation angle is quite evident and allows meanshift to cluster points having similar orientations together. Further separation of points in the spatial domain is also required in some cases where the spatially separated points are clustered into one segment. Density based clustering is therefore again applied and finally clusters with very few points (less than 50) are removed.
Prior to reconstruction, the segmented façades, are first classified to flat and curved surfaces by analyzing derivatives of the local orientation angle θ. Façade footprints with �′ estimates
with slopes less than 0.01 ≈ 0.6 degrees) are considered to be
flat. Figure 5 depicts the reconstructed façades models of the area of interest. The shown reconstructed façade model can be used to refine the elevation estimates of the raw TomoSAR points as depicted in (Zhu, 2013a).
(a)
(b)
(c)
(d)
Figure 3 : Façade points extraction: (a) Optical image of the test area in Las Vegas © Google; (b) TomoSAR points in UTM coordinates of the
corresponding test image (top view); (c) SD with radius r=5m and inliers d=2m; (d) Extracted building façade points. Colobar indicates
(b)(d) height in meters; (c) SD.
(a) (b)
(c) (d)
Figure 4 : Fine clustering results after applying mean shift clustering to spatially connected clusters: (a) TomoSAR points of one particular
density connected cluster (top view). Colorbar indicates height in meters; (b) Corresponding orientation angle in degrees; (c) Non clustered (top) and clustered (bottom) points in the Gaussian image of
points in (a); (d) Resulting clustered points in 3D.
(a)
(b)
Figure 5 : Reconstructed façades: (a)2D view of the façade footprints overlaid onto the optical image; (b) 3D view.
5. DISCUSSION & CONCLUDING REMARKS
In this paper we have presented an automatic (parametric) approach for robust façade reconstruction using TomoSAR point clouds for large areas. The approach allows for a robust reconstruction of both higher façades and lower height structures, and hence is well suited for urban monitoring of larger areas from space. Few points however need be addressed:
- In our approach, we rely on the assumption of having a high number of scatterers on the building façades. In most cases, the assumption is valid because of the existence of strong corner reflectors, e.g. window frames, on the building façades. However there are exceptional cases: 1) The façade structure is smooth i.e., only very few scatterers can be detected on the façades; 2) The building is low. In these cases, SD might not be the optimum choice. Alternatively, we can use other scatterer characteristics such as intensity (brightness) and SNR for extraction and poles of Earth, we may fail to reconstruct building facades facing North or South due to the missing of measurements. One way to rectify this is by using fused point clouds (i.e., both ascending and descending) and simply connecting the endpoints of the missing facades to get complete shape of the building footprint.
- The proposed approach is parametric. The free parameters are set empirically in this work. A further detailed sensitivity analysis of these parameters is necessary.
In the future, we will concentrate on these improvements and will extend the algorithm towards object based TomoSAR point clouds fusion and automatic building roof reconstruction.
6. REFERENCES
Bamler, R., Eineder, M., Adam, N., Gernhardt, S., Zhu, X., 2009. Interferometric Potential of High Resolution SpaceborneSAR. Photogrammetrie – Fernerkundung – Geoinformation (PGF) 5/2009, pp. 407- 419.
Carmo, MPD., 1976. Differential geometry of curves and surfaces. The Prentice-Hall Press.
Cheng, Y., 1995., Mean shift, mode seeking, and clustering. IEEE Transaction on Pattern Analysis and Machine Intelligence, 17(8), pp. 790-799.
Dorninger, P., Pfeifer, N., 2008. A comprehensive automated 3D approach for building extraction, reconstruction, and regularization from airborne laser scanning point clouds. Sensors 2008, 8, pp. 7323– 7343.
Ester, M., et al., 1996. A density-based algorithm for discovering clusters in large spatial databases with noise. KDD-96, Potland, USA. Ferro, A., Brunner, D., Bruzzone, L., 2009. An advanced technique for building detection in VHR SAR images. In SPIE Europe Remote Sensing, Berlin, Germany, vol. 7477, pp. 74770V–74770V–12. Forlani, G., Nardinocchi, C., Scaioni, M. and Zingaretti, P., 2006. Complete classification of raw Lidar data and 3D reconstruction of buildings. Pattern Analysis Applications, 8, pp. 357–374.
Gamba, P., Houshmand, B., Saccani, M., 2000. Detection and extraction of buildings from interferometric SAR data. IEEE Transactions on Geoscience and Remote Sensing, 38(1), pp. 611–617.
Gernhardt, S., Adam, N., Eineder, M., Bamler, R., 2010. Potential of Very High Resolution SAR for Persistent Scatterer Interferometry in Urban Areas. Annals of GIS, 16(2), pp. 103-111.
Gross, H., Thoennessen, U., Hansen, W., 2005. 3d-modeling of urban structures. In International Archives of Photogrammetry and Remote Sensing, Volume XXXVI/3-W24, Vienna, Austria.
Hubert, M., Rousseeuw, P., K. V. Branden, K. V., 2005. Robpca: A new approach to robust principal components analysis. Technometrics, 47. Liu, Y., Xiong, Y., 2008. Automatic segmentation of unorganized noisy point clouds based on the gaussian map. Computer-Aided Design, 40(5), pp. 576–594.
Mallet, C., Bretar, F., Roux, M., Soergel, U., Heipke, C., 2011. Relevance assessment of full-waveform lidar data for urban area classification. ISPRS Journal of Photogrammetry and Remote Sensing, 66(6), pp. S71–S84.
Quartulli, M., Datcu, M., 2004. Stochastic geometrical modeling for built-up area understanding from a single SAR intensity image with meter resolution. IEEE Transactions on Geoscience and Remote Sensing, 42(9), pp. 1996–2003.
Reale, D., Fornaro, G., Pauciullo, A., Zhu, X., Bamler, R., 2011. Tomographic Imaging and Monitoring of Buildings with Very High Resolution SAR Data. IEEE Geoscience and Remote Sensing Letters, 8(4), pp. 661-665.
Rottensteiner, F., Briese, C., 2002. A new method for building extraction in urban areas from high-resolution LIDAR data.International Archives of Photogrammetry, Remote Sensing and Spatial Information Sciences 34 (Part3A), pp.295-301.
Sampath, A., Shan, J., 2010. Segmentation and reconstruction of polyhedral building roofs from aerial LiDAR point clouds. IEEE Transactions on Geoscience and Remote Sensing, 48(3), pp.1554–1567. Sithole, G., Vosselman, G., 2004. Experimental comparison of filtering algorithms for bare-earth extraction from airborne laser scanning point clouds. ISPRS Journal of Photogrammetry and Remote Sensing, 59(1-2), pp. 85–101.
Sohn, G., Dowman, I., 2002. Terrain surface reconstruction by the use of tetrahedron model with the MDL Criterion.International Archives of Photogrammetry, Remote Sensing and Spatial Information Sciences, XXXIV (Pt. 3A), pp. 336– 344.
Sampath, A., Shan, J., 2007. Building Boundary Tracing and Regularization from Airborne Lidar Point Clouds. Photogrammetric Engineering & Remote Sensing, 73(7), pp. 805-812.
Shahzad, M., Zhu, X., Bamler, R., 2012.Façade Structure Reconstruction Using Spaceborne TomoSAR Point Clouds. Proceedings of the IEEE IGARSS 2012, Munich, Germany.
Sportouche, H., Tupin, F., Denise, L., 2011. Extraction and Three-Dimensional Reconstruction of Isolated Buildings in Urban Scenes From High-Resolution Optical and SAR Spaceborne Images. IEEE Transactions on Geoscience and Remote Sensing, 49(10), pp. 3932-3946.
Stilla, U., Soergel, U., Thoennessen, U., 2003. Potential and limits of InSAR data for building reconstruction in built-up areas. ISPRS Journal of Photogrammetry and Remote Sensing, 58(1-2), pp. 113–123. Thiele, A., Cadario, E., Schulz, K., Thoennessen, U., Soergel, U., 2007. Building recognition from multi-aspect high-resolution InSAR data in urban areas. IEEE Transactions on Geoscience and Remote Sensing, 45(11), pp. 3583–3593.
Vosselman, G., 2000. Slope based filtering of laser altimetry data. International Archives of the Photogrammetry, Remote Sensing and Spatial Information Sciences, XXXIII (Pt. B3), pp. 935-942.
Wang, Y., Zhu, X., Bamler, R., Gernhardt, S., 2013. Towards TerraSAR-X Street View: Creating City Point Cloud from Multi-aspect Data Stacks. JURSE 2013, Sao Paolo, Brasil, 2013.
Wegner, J.D., Soergel, U., Thiele, A., 2009. Building extraction in urban scenes from high resolution InSAR data and optical imagery. URBAN, pp. 1–6.
Xu, F., Jin, Y.-Q., 2007. Automatic reconstruction of building objects from multiaspect meter-resolution SAR images. IEEE Transactions on Geoscience and Remote Sensing. 45(7), pp. 2336–2353.
Zhu, X., Bamler, R., 2010. Very High Resolution Spaceborne SAR Tomography in Urban Environment. IEEE Transactions on Geoscience and Remote Sensing, 48(12), pp. 4296 – 4308.
Zhu, X., Shahzad, M., 2013a. Façade Reconstruction Using Multi-View Spaceborne TomoSAR Point Clouds. IEEE Transactions on Geoscience and Remote Sensing, accepted for publication.
Zhu, X. et al., 2013b. Tomo-GENESIS: DLR's tomographic SAR processing system. JURSE 2013, Sao Paulo, Brazil.